Free Statistics
of Irreproducible Research!
Description of Statistical Computation | |||||||||||||||||||||||||||||||||||||||||
|---|---|---|---|---|---|---|---|---|---|---|---|---|---|---|---|---|---|---|---|---|---|---|---|---|---|---|---|---|---|---|---|---|---|---|---|---|---|---|---|---|---|
| Author's title | |||||||||||||||||||||||||||||||||||||||||
| Author | *Unverified author* | ||||||||||||||||||||||||||||||||||||||||
| R Software Module | rwasp_univariatedataseries.wasp | ||||||||||||||||||||||||||||||||||||||||
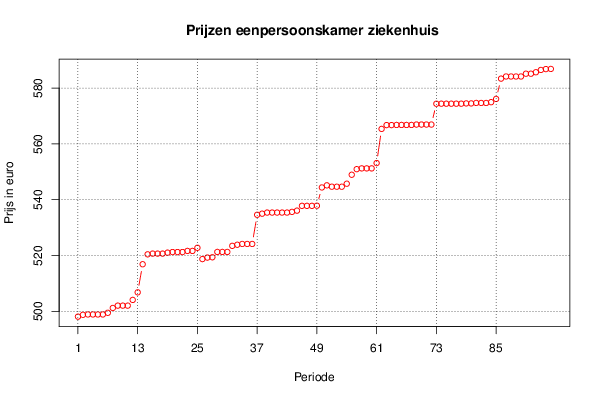
| Title produced by software | Univariate Data Series | ||||||||||||||||||||||||||||||||||||||||
| Date of computation | Tue, 03 Feb 2015 16:22:22 +0000 | ||||||||||||||||||||||||||||||||||||||||
| Cite this page as follows | Statistical Computations at FreeStatistics.org, Office for Research Development and Education, URL https://freestatistics.org/blog/index.php?v=date/2015/Feb/03/t1422980634nui5wbnplpmbjd6.htm/, Retrieved Sat, 18 May 2024 03:59:10 +0000 | ||||||||||||||||||||||||||||||||||||||||
| Statistical Computations at FreeStatistics.org, Office for Research Development and Education, URL https://freestatistics.org/blog/index.php?pk=276563, Retrieved Sat, 18 May 2024 03:59:10 +0000 | |||||||||||||||||||||||||||||||||||||||||
| QR Codes: | |||||||||||||||||||||||||||||||||||||||||
|
| |||||||||||||||||||||||||||||||||||||||||
| Original text written by user: | |||||||||||||||||||||||||||||||||||||||||
| IsPrivate? | No (this computation is public) | ||||||||||||||||||||||||||||||||||||||||
| User-defined keywords | |||||||||||||||||||||||||||||||||||||||||
| Estimated Impact | 165 | ||||||||||||||||||||||||||||||||||||||||
Tree of Dependent Computations | |||||||||||||||||||||||||||||||||||||||||
| Family? (F = Feedback message, R = changed R code, M = changed R Module, P = changed Parameters, D = changed Data) | |||||||||||||||||||||||||||||||||||||||||
| - [Univariate Data Series] [Prijs eenpersoons...] [2015-02-03 16:22:22] [1689e0541609f8eb663ad6752b966f5b] [Current] - R P [Univariate Data Series] [Datareeks - prijs...] [2015-02-09 12:30:43] [77cae2e8655af67d2d17f40c5b6aa8cb] - RMP [Histogram] [Frequentietabel -...] [2015-02-09 12:40:03] [77cae2e8655af67d2d17f40c5b6aa8cb] - R PD [Univariate Data Series] [Gemiddelde wekeli...] [2015-02-09 13:08:49] [77cae2e8655af67d2d17f40c5b6aa8cb] - RMPD [Histogram] [Frequentietabel g...] [2015-02-09 13:14:40] [77cae2e8655af67d2d17f40c5b6aa8cb] - RMP [Kernel Density Estimation] [Dichtheidsgrafiek...] [2015-02-12 14:33:39] [77cae2e8655af67d2d17f40c5b6aa8cb] - R PD [Histogram] [Histogram eenpers...] [2015-02-12 15:17:02] [7bdcffa309b1f761c156f450e03f8548] - RMPD [Kernel Density Estimation] [Dichtheidsgrafiek...] [2015-02-12 15:19:44] [77cae2e8655af67d2d17f40c5b6aa8cb] - RMP [Quartiles] [Berekening kwarti...] [2015-02-12 15:48:26] [77cae2e8655af67d2d17f40c5b6aa8cb] - RMP [Notched Boxplots] [Bokspoot gemiddel...] [2015-02-12 16:04:25] [77cae2e8655af67d2d17f40c5b6aa8cb] - RMPD [Quartiles] [Berekening kwarti...] [2015-02-12 16:36:39] [77cae2e8655af67d2d17f40c5b6aa8cb] - RMPD [Notched Boxplots] [Box-plot eenperso...] [2015-02-12 16:40:17] [77cae2e8655af67d2d17f40c5b6aa8cb] | |||||||||||||||||||||||||||||||||||||||||
| Feedback Forum | |||||||||||||||||||||||||||||||||||||||||
Post a new message | |||||||||||||||||||||||||||||||||||||||||
Dataset | |||||||||||||||||||||||||||||||||||||||||
| Dataseries X: | |||||||||||||||||||||||||||||||||||||||||
498.10 498.76 498.88 498.88 498.88 498.88 499.48 501.21 502.05 502.05 502.05 504.10 506.81 516.88 520.43 520.68 520.68 520.68 521.03 521.25 521.25 521.25 521.65 521.65 522.77 518.72 519.27 519.38 521.29 521.29 521.29 523.47 523.86 524.14 524.14 524.14 534.60 534.99 535.39 535.39 535.39 535.39 535.39 535.64 536.08 537.80 537.80 537.80 537.85 544.39 545.15 544.65 544.65 544.65 545.73 548.94 550.94 551.22 551.22 551.22 553.12 565.37 566.73 566.73 566.78 566.78 566.78 566.78 566.93 566.93 566.93 566.93 574.38 574.40 574.40 574.40 574.40 574.40 574.50 574.50 574.67 574.66 574.66 574.94 576.10 583.38 584.15 584.15 584.15 584.15 585.14 585.14 585.67 586.49 586.81 586.85 | |||||||||||||||||||||||||||||||||||||||||
Tables (Output of Computation) | |||||||||||||||||||||||||||||||||||||||||
| |||||||||||||||||||||||||||||||||||||||||
Figures (Output of Computation) | |||||||||||||||||||||||||||||||||||||||||
Input Parameters & R Code | |||||||||||||||||||||||||||||||||||||||||
| Parameters (Session): | |||||||||||||||||||||||||||||||||||||||||
| par1 = Nursing prices - single room ; par2 = http://www.nbb.be/belgostat/PresentationLinker?Order=true&TableId=596000072&Lang=E&prop=treeview ; par3 = Cijfergegevens van de prijzen van kamers in een ziekenhuis. ; par4 = 12 ; | |||||||||||||||||||||||||||||||||||||||||
| Parameters (R input): | |||||||||||||||||||||||||||||||||||||||||
| par1 = Nursing prices - single room ; par2 = http://www.nbb.be/belgostat/PresentationLinker?Order=true&TableId=596000072&Lang=E&prop=treeview ; par3 = Cijfergegevens van de prijzen van kamers in een ziekenhuis. ; par4 = 12 ; | |||||||||||||||||||||||||||||||||||||||||
| R code (references can be found in the software module): | |||||||||||||||||||||||||||||||||||||||||
par4 <- '12' | |||||||||||||||||||||||||||||||||||||||||