Free Statistics
of Irreproducible Research!
Description of Statistical Computation | |||||||||||||||||||||||||||||||||||||||||
|---|---|---|---|---|---|---|---|---|---|---|---|---|---|---|---|---|---|---|---|---|---|---|---|---|---|---|---|---|---|---|---|---|---|---|---|---|---|---|---|---|---|
| Author's title | |||||||||||||||||||||||||||||||||||||||||
| Author | *Unverified author* | ||||||||||||||||||||||||||||||||||||||||
| R Software Module | rwasp_univariatedataseries.wasp | ||||||||||||||||||||||||||||||||||||||||
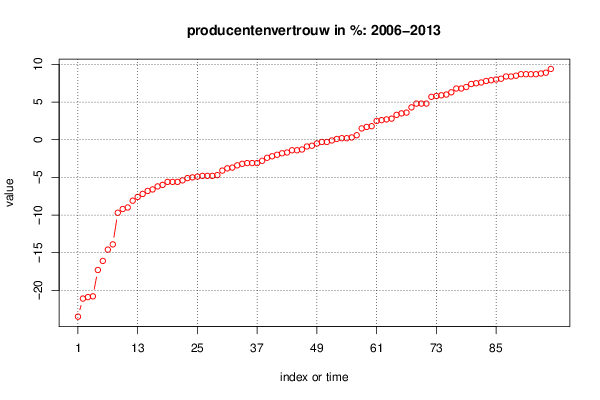
| Title produced by software | Univariate Data Series | ||||||||||||||||||||||||||||||||||||||||
| Date of computation | Mon, 02 Feb 2015 17:11:25 +0000 | ||||||||||||||||||||||||||||||||||||||||
| Cite this page as follows | Statistical Computations at FreeStatistics.org, Office for Research Development and Education, URL https://freestatistics.org/blog/index.php?v=date/2015/Feb/02/t1422897113fx3dnqgzfqds0wc.htm/, Retrieved Sat, 18 May 2024 01:55:57 +0000 | ||||||||||||||||||||||||||||||||||||||||
| Statistical Computations at FreeStatistics.org, Office for Research Development and Education, URL https://freestatistics.org/blog/index.php?pk=276514, Retrieved Sat, 18 May 2024 01:55:57 +0000 | |||||||||||||||||||||||||||||||||||||||||
| QR Codes: | |||||||||||||||||||||||||||||||||||||||||
|
| |||||||||||||||||||||||||||||||||||||||||
| Original text written by user: | |||||||||||||||||||||||||||||||||||||||||
| IsPrivate? | No (this computation is public) | ||||||||||||||||||||||||||||||||||||||||
| User-defined keywords | |||||||||||||||||||||||||||||||||||||||||
| Estimated Impact | 89 | ||||||||||||||||||||||||||||||||||||||||
Tree of Dependent Computations | |||||||||||||||||||||||||||||||||||||||||
| Family? (F = Feedback message, R = changed R code, M = changed R Module, P = changed Parameters, D = changed Data) | |||||||||||||||||||||||||||||||||||||||||
| - [Univariate Data Series] [] [2015-02-02 17:11:25] [70e23d918d09c907c02097a361cd6415] [Current] - RMP [Histogram] [] [2015-02-04 12:07:27] [0335ebbfcd60b9f5a1dafeadb8874636] - RMP [Histogram] [] [2015-02-04 12:09:50] [0335ebbfcd60b9f5a1dafeadb8874636] - RMP [Histogram] [] [2015-02-04 12:11:24] [0335ebbfcd60b9f5a1dafeadb8874636] - RMP [Kernel Density Estimation] [] [2015-02-04 12:13:18] [0335ebbfcd60b9f5a1dafeadb8874636] | |||||||||||||||||||||||||||||||||||||||||
| Feedback Forum | |||||||||||||||||||||||||||||||||||||||||
Post a new message | |||||||||||||||||||||||||||||||||||||||||
Dataset | |||||||||||||||||||||||||||||||||||||||||
| Dataseries X: | |||||||||||||||||||||||||||||||||||||||||
-23.5 -21.1 -20.9 -20.8 -17.3 -16.1 -14.6 -13.9 -9.7 -9.2 -9 -8.1 -7.6 -7.2 -6.8 -6.6 -6.2 -6 -5.6 -5.6 -5.6 -5.4 -5.1 -5 -4.9 -4.8 -4.8 -4.8 -4.7 -4.1 -3.8 -3.7 -3.4 -3.2 -3.1 -3.1 -3.1 -2.8 -2.4 -2.2 -2 -1.8 -1.7 -1.4 -1.4 -1.3 -0.9 -0.8 -0.5 -0.3 -0.3 -0.1 0.1 0.2 0.2 0.3 0.6 1.5 1.7 1.8 2.5 2.6 2.7 2.8 3.3 3.5 3.6 4.3 4.8 4.8 4.8 5.7 5.8 5.9 6 6.3 6.8 6.8 7 7.4 7.5 7.6 7.8 7.9 8 8.1 8.4 8.4 8.5 8.7 8.7 8.7 8.7 8.8 8.9 9.4 | |||||||||||||||||||||||||||||||||||||||||
Tables (Output of Computation) | |||||||||||||||||||||||||||||||||||||||||
| |||||||||||||||||||||||||||||||||||||||||
Figures (Output of Computation) | |||||||||||||||||||||||||||||||||||||||||
Input Parameters & R Code | |||||||||||||||||||||||||||||||||||||||||
| Parameters (Session): | |||||||||||||||||||||||||||||||||||||||||
| par2 = blackbord ; par4 = 12 ; | |||||||||||||||||||||||||||||||||||||||||
| Parameters (R input): | |||||||||||||||||||||||||||||||||||||||||
| par1 = ; par2 = blackbord ; par3 = ; par4 = 12 ; | |||||||||||||||||||||||||||||||||||||||||
| R code (references can be found in the software module): | |||||||||||||||||||||||||||||||||||||||||
par4 <- '12' | |||||||||||||||||||||||||||||||||||||||||