Free Statistics

of Irreproducible Research!

Author's title

Author*Unverified author*
R Software Modulerwasp_autocorrelation.wasp
Title produced by software(Partial) Autocorrelation Function
Date of computationFri, 25 Dec 2015 16:57:43 +0000
Cite this page as followsStatistical Computations at FreeStatistics.org, Office for Research Development and Education, URL https://freestatistics.org/blog/index.php?v=date/2015/Dec/25/t1451062696aigwz7cukzmyjlb.htm/, Retrieved Sat, 18 May 2024 17:37:10 +0000
Statistical Computations at FreeStatistics.org, Office for Research Development and Education, URL https://freestatistics.org/blog/index.php?pk=287093, Retrieved Sat, 18 May 2024 17:37:10 +0000
QR Codes:

Original text written by user:
IsPrivate?No (this computation is public)
User-defined keywords
Estimated Impact151
Family? (F = Feedback message, R = changed R code, M = changed R Module, P = changed Parameters, D = changed Data)
-       [(Partial) Autocorrelation Function] [Opgave 7 Ruben Ru...] [2015-12-25 16:57:43] [bcb0da8ff6be95621a49a67fe6a7b572] [Current]
Feedback Forum

Post a new message
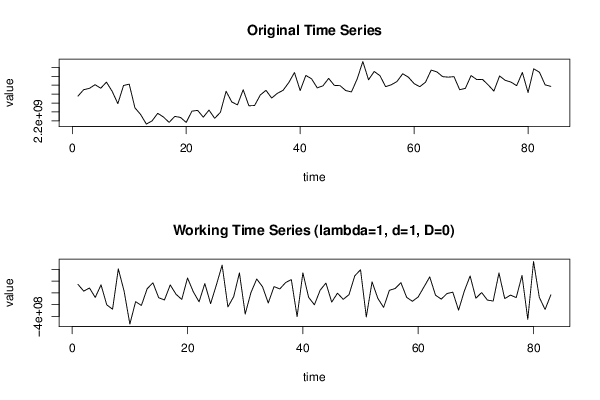
Dataseries X:
2754542000
2899512000
2928886000
3011252000
2932895000
3069307000
2863923000
2585491000
2993900000
3023542000
2491370000
2341705000
2126472000
2196705000
2368313000
2285174000
2163877000
2299241000
2275643000
2163091000
2416149000
2434553000
2281937000
2440464000
2255745000
2389872000
2863148000
2623516000
2558136000
2898129000
2537720000
2543469000
2779739000
2884779000
2711624000
2817771000
2884477000
3058996000
3285298000
2879617000
3220416000
3144280000
2940811000
2986507000
3153720000
2995806000
2990242000
2879837000
2848699000
3138385000
3532447000
3121872000
3309250000
3215022000
2966778000
3010284000
3083824000
3257727000
3180374000
3036414000
2966714000
3067677000
3339789000
3299861000
3193328000
3181266000
3193356000
2898282000
2929524000
3217311000
3126249000
3131083000
3008058000
2868318000
3207495000
3109336000
3070725000
2989963000
3287552000
2835238000
3368961000
3291689000
3008536000
2974109000


Summary of computational transaction
Raw Inputview raw input (R code)
Raw Outputview raw output of R engine
Computing time1 seconds
R Server'Gertrude Mary Cox' @ cox.wessa.net

\begin{tabular}{lllllllll}
\hline
Summary of computational transaction \tabularnewline
Raw Input & view raw input (R code)  \tabularnewline
Raw Output & view raw output of R engine  \tabularnewline
Computing time & 1 seconds \tabularnewline
R Server & 'Gertrude Mary Cox' @ cox.wessa.net \tabularnewline
\hline
\end{tabular}
%Source: https://freestatistics.org/blog/index.php?pk=287093&T=0

[TABLE]
[ROW][C]Summary of computational transaction[/C][/ROW]
[ROW][C]Raw Input[/C][C]view raw input (R code) [/C][/ROW]
[ROW][C]Raw Output[/C][C]view raw output of R engine [/C][/ROW]
[ROW][C]Computing time[/C][C]1 seconds[/C][/ROW]
[ROW][C]R Server[/C][C]'Gertrude Mary Cox' @ cox.wessa.net[/C][/ROW]
[/TABLE]
Source: https://freestatistics.org/blog/index.php?pk=287093&T=0

Globally Unique Identifier (entire table): ba.freestatistics.org/blog/index.php?pk=287093&T=0

As an alternative you can also use a QR Code:  

The GUIDs for individual cells are displayed in the table below:

Summary of computational transaction
Raw Inputview raw input (R code)
Raw Outputview raw output of R engine
Computing time1 seconds
R Server'Gertrude Mary Cox' @ cox.wessa.net


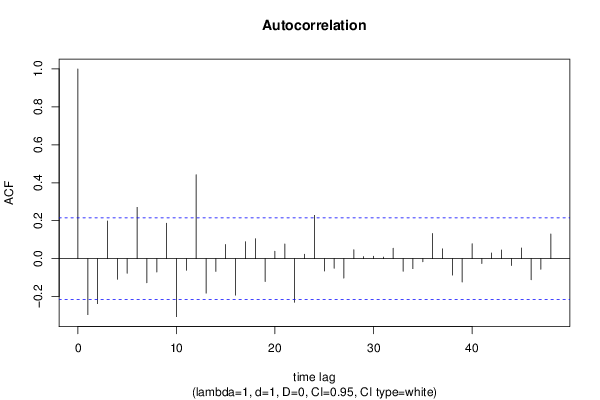
Autocorrelation Function
Time lag kACF(k)T-STATP-value
1-0.295479-2.69190.004295
2-0.237259-2.16150.016767
30.1983551.80710.037185
4-0.109148-0.99440.161463
5-0.077115-0.70260.24215
60.2702432.4620.007943
7-0.126962-1.15670.125361
8-0.07087-0.64570.260141
90.1869321.7030.046152
10-0.306001-2.78780.003289
11-0.061316-0.55860.288964
120.4422954.02956.2e-05
13-0.182204-1.660.050349
14-0.067516-0.61510.270085
150.0747150.68070.248982
16-0.192414-1.7530.04165
170.0891820.81250.209418
180.1044310.95140.172078
19-0.120707-1.09970.137323
200.0391290.35650.361192
210.0768460.70010.242912
22-0.230532-2.10020.019371
230.02290.20860.417623
240.2280622.07770.020412
25-0.065372-0.59560.276544
26-0.050515-0.46020.323282
27-0.102754-0.93610.175961
280.0465760.42430.336213
290.0107210.09770.461216
300.0122370.11150.455752
310.0080910.07370.470709
320.0543210.49490.310994
33-0.066807-0.60860.272212
34-0.053023-0.48310.315162
35-0.016958-0.15450.438798
360.1321171.20360.116075
370.0514130.46840.320363
38-0.08694-0.79210.215292
39-0.123128-1.12170.132602
400.078770.71760.237502
41-0.025864-0.23560.407148
420.0296730.27030.393786
430.0455580.41510.339588
44-0.036305-0.33080.370832
450.0556710.50720.306684
46-0.111738-1.0180.155822
47-0.056279-0.51270.304752
480.1302631.18680.119355

\begin{tabular}{lllllllll}
\hline
Autocorrelation Function \tabularnewline
Time lag k & ACF(k) & T-STAT & P-value \tabularnewline
1 & -0.295479 & -2.6919 & 0.004295 \tabularnewline
2 & -0.237259 & -2.1615 & 0.016767 \tabularnewline
3 & 0.198355 & 1.8071 & 0.037185 \tabularnewline
4 & -0.109148 & -0.9944 & 0.161463 \tabularnewline
5 & -0.077115 & -0.7026 & 0.24215 \tabularnewline
6 & 0.270243 & 2.462 & 0.007943 \tabularnewline
7 & -0.126962 & -1.1567 & 0.125361 \tabularnewline
8 & -0.07087 & -0.6457 & 0.260141 \tabularnewline
9 & 0.186932 & 1.703 & 0.046152 \tabularnewline
10 & -0.306001 & -2.7878 & 0.003289 \tabularnewline
11 & -0.061316 & -0.5586 & 0.288964 \tabularnewline
12 & 0.442295 & 4.0295 & 6.2e-05 \tabularnewline
13 & -0.182204 & -1.66 & 0.050349 \tabularnewline
14 & -0.067516 & -0.6151 & 0.270085 \tabularnewline
15 & 0.074715 & 0.6807 & 0.248982 \tabularnewline
16 & -0.192414 & -1.753 & 0.04165 \tabularnewline
17 & 0.089182 & 0.8125 & 0.209418 \tabularnewline
18 & 0.104431 & 0.9514 & 0.172078 \tabularnewline
19 & -0.120707 & -1.0997 & 0.137323 \tabularnewline
20 & 0.039129 & 0.3565 & 0.361192 \tabularnewline
21 & 0.076846 & 0.7001 & 0.242912 \tabularnewline
22 & -0.230532 & -2.1002 & 0.019371 \tabularnewline
23 & 0.0229 & 0.2086 & 0.417623 \tabularnewline
24 & 0.228062 & 2.0777 & 0.020412 \tabularnewline
25 & -0.065372 & -0.5956 & 0.276544 \tabularnewline
26 & -0.050515 & -0.4602 & 0.323282 \tabularnewline
27 & -0.102754 & -0.9361 & 0.175961 \tabularnewline
28 & 0.046576 & 0.4243 & 0.336213 \tabularnewline
29 & 0.010721 & 0.0977 & 0.461216 \tabularnewline
30 & 0.012237 & 0.1115 & 0.455752 \tabularnewline
31 & 0.008091 & 0.0737 & 0.470709 \tabularnewline
32 & 0.054321 & 0.4949 & 0.310994 \tabularnewline
33 & -0.066807 & -0.6086 & 0.272212 \tabularnewline
34 & -0.053023 & -0.4831 & 0.315162 \tabularnewline
35 & -0.016958 & -0.1545 & 0.438798 \tabularnewline
36 & 0.132117 & 1.2036 & 0.116075 \tabularnewline
37 & 0.051413 & 0.4684 & 0.320363 \tabularnewline
38 & -0.08694 & -0.7921 & 0.215292 \tabularnewline
39 & -0.123128 & -1.1217 & 0.132602 \tabularnewline
40 & 0.07877 & 0.7176 & 0.237502 \tabularnewline
41 & -0.025864 & -0.2356 & 0.407148 \tabularnewline
42 & 0.029673 & 0.2703 & 0.393786 \tabularnewline
43 & 0.045558 & 0.4151 & 0.339588 \tabularnewline
44 & -0.036305 & -0.3308 & 0.370832 \tabularnewline
45 & 0.055671 & 0.5072 & 0.306684 \tabularnewline
46 & -0.111738 & -1.018 & 0.155822 \tabularnewline
47 & -0.056279 & -0.5127 & 0.304752 \tabularnewline
48 & 0.130263 & 1.1868 & 0.119355 \tabularnewline
\hline
\end{tabular}
%Source: https://freestatistics.org/blog/index.php?pk=287093&T=1

[TABLE]
[ROW][C]Autocorrelation Function[/C][/ROW]
[ROW][C]Time lag k[/C][C]ACF(k)[/C][C]T-STAT[/C][C]P-value[/C][/ROW]
[ROW][C]1[/C][C]-0.295479[/C][C]-2.6919[/C][C]0.004295[/C][/ROW]
[ROW][C]2[/C][C]-0.237259[/C][C]-2.1615[/C][C]0.016767[/C][/ROW]
[ROW][C]3[/C][C]0.198355[/C][C]1.8071[/C][C]0.037185[/C][/ROW]
[ROW][C]4[/C][C]-0.109148[/C][C]-0.9944[/C][C]0.161463[/C][/ROW]
[ROW][C]5[/C][C]-0.077115[/C][C]-0.7026[/C][C]0.24215[/C][/ROW]
[ROW][C]6[/C][C]0.270243[/C][C]2.462[/C][C]0.007943[/C][/ROW]
[ROW][C]7[/C][C]-0.126962[/C][C]-1.1567[/C][C]0.125361[/C][/ROW]
[ROW][C]8[/C][C]-0.07087[/C][C]-0.6457[/C][C]0.260141[/C][/ROW]
[ROW][C]9[/C][C]0.186932[/C][C]1.703[/C][C]0.046152[/C][/ROW]
[ROW][C]10[/C][C]-0.306001[/C][C]-2.7878[/C][C]0.003289[/C][/ROW]
[ROW][C]11[/C][C]-0.061316[/C][C]-0.5586[/C][C]0.288964[/C][/ROW]
[ROW][C]12[/C][C]0.442295[/C][C]4.0295[/C][C]6.2e-05[/C][/ROW]
[ROW][C]13[/C][C]-0.182204[/C][C]-1.66[/C][C]0.050349[/C][/ROW]
[ROW][C]14[/C][C]-0.067516[/C][C]-0.6151[/C][C]0.270085[/C][/ROW]
[ROW][C]15[/C][C]0.074715[/C][C]0.6807[/C][C]0.248982[/C][/ROW]
[ROW][C]16[/C][C]-0.192414[/C][C]-1.753[/C][C]0.04165[/C][/ROW]
[ROW][C]17[/C][C]0.089182[/C][C]0.8125[/C][C]0.209418[/C][/ROW]
[ROW][C]18[/C][C]0.104431[/C][C]0.9514[/C][C]0.172078[/C][/ROW]
[ROW][C]19[/C][C]-0.120707[/C][C]-1.0997[/C][C]0.137323[/C][/ROW]
[ROW][C]20[/C][C]0.039129[/C][C]0.3565[/C][C]0.361192[/C][/ROW]
[ROW][C]21[/C][C]0.076846[/C][C]0.7001[/C][C]0.242912[/C][/ROW]
[ROW][C]22[/C][C]-0.230532[/C][C]-2.1002[/C][C]0.019371[/C][/ROW]
[ROW][C]23[/C][C]0.0229[/C][C]0.2086[/C][C]0.417623[/C][/ROW]
[ROW][C]24[/C][C]0.228062[/C][C]2.0777[/C][C]0.020412[/C][/ROW]
[ROW][C]25[/C][C]-0.065372[/C][C]-0.5956[/C][C]0.276544[/C][/ROW]
[ROW][C]26[/C][C]-0.050515[/C][C]-0.4602[/C][C]0.323282[/C][/ROW]
[ROW][C]27[/C][C]-0.102754[/C][C]-0.9361[/C][C]0.175961[/C][/ROW]
[ROW][C]28[/C][C]0.046576[/C][C]0.4243[/C][C]0.336213[/C][/ROW]
[ROW][C]29[/C][C]0.010721[/C][C]0.0977[/C][C]0.461216[/C][/ROW]
[ROW][C]30[/C][C]0.012237[/C][C]0.1115[/C][C]0.455752[/C][/ROW]
[ROW][C]31[/C][C]0.008091[/C][C]0.0737[/C][C]0.470709[/C][/ROW]
[ROW][C]32[/C][C]0.054321[/C][C]0.4949[/C][C]0.310994[/C][/ROW]
[ROW][C]33[/C][C]-0.066807[/C][C]-0.6086[/C][C]0.272212[/C][/ROW]
[ROW][C]34[/C][C]-0.053023[/C][C]-0.4831[/C][C]0.315162[/C][/ROW]
[ROW][C]35[/C][C]-0.016958[/C][C]-0.1545[/C][C]0.438798[/C][/ROW]
[ROW][C]36[/C][C]0.132117[/C][C]1.2036[/C][C]0.116075[/C][/ROW]
[ROW][C]37[/C][C]0.051413[/C][C]0.4684[/C][C]0.320363[/C][/ROW]
[ROW][C]38[/C][C]-0.08694[/C][C]-0.7921[/C][C]0.215292[/C][/ROW]
[ROW][C]39[/C][C]-0.123128[/C][C]-1.1217[/C][C]0.132602[/C][/ROW]
[ROW][C]40[/C][C]0.07877[/C][C]0.7176[/C][C]0.237502[/C][/ROW]
[ROW][C]41[/C][C]-0.025864[/C][C]-0.2356[/C][C]0.407148[/C][/ROW]
[ROW][C]42[/C][C]0.029673[/C][C]0.2703[/C][C]0.393786[/C][/ROW]
[ROW][C]43[/C][C]0.045558[/C][C]0.4151[/C][C]0.339588[/C][/ROW]
[ROW][C]44[/C][C]-0.036305[/C][C]-0.3308[/C][C]0.370832[/C][/ROW]
[ROW][C]45[/C][C]0.055671[/C][C]0.5072[/C][C]0.306684[/C][/ROW]
[ROW][C]46[/C][C]-0.111738[/C][C]-1.018[/C][C]0.155822[/C][/ROW]
[ROW][C]47[/C][C]-0.056279[/C][C]-0.5127[/C][C]0.304752[/C][/ROW]
[ROW][C]48[/C][C]0.130263[/C][C]1.1868[/C][C]0.119355[/C][/ROW]
[/TABLE]
Source: https://freestatistics.org/blog/index.php?pk=287093&T=1

Globally Unique Identifier (entire table): ba.freestatistics.org/blog/index.php?pk=287093&T=1

As an alternative you can also use a QR Code:  

The GUIDs for individual cells are displayed in the table below:

Autocorrelation Function
Time lag kACF(k)T-STATP-value
1-0.295479-2.69190.004295
2-0.237259-2.16150.016767
30.1983551.80710.037185
4-0.109148-0.99440.161463
5-0.077115-0.70260.24215
60.2702432.4620.007943
7-0.126962-1.15670.125361
8-0.07087-0.64570.260141
90.1869321.7030.046152
10-0.306001-2.78780.003289
11-0.061316-0.55860.288964
120.4422954.02956.2e-05
13-0.182204-1.660.050349
14-0.067516-0.61510.270085
150.0747150.68070.248982
16-0.192414-1.7530.04165
170.0891820.81250.209418
180.1044310.95140.172078
19-0.120707-1.09970.137323
200.0391290.35650.361192
210.0768460.70010.242912
22-0.230532-2.10020.019371
230.02290.20860.417623
240.2280622.07770.020412
25-0.065372-0.59560.276544
26-0.050515-0.46020.323282
27-0.102754-0.93610.175961
280.0465760.42430.336213
290.0107210.09770.461216
300.0122370.11150.455752
310.0080910.07370.470709
320.0543210.49490.310994
33-0.066807-0.60860.272212
34-0.053023-0.48310.315162
35-0.016958-0.15450.438798
360.1321171.20360.116075
370.0514130.46840.320363
38-0.08694-0.79210.215292
39-0.123128-1.12170.132602
400.078770.71760.237502
41-0.025864-0.23560.407148
420.0296730.27030.393786
430.0455580.41510.339588
44-0.036305-0.33080.370832
450.0556710.50720.306684
46-0.111738-1.0180.155822
47-0.056279-0.51270.304752
480.1302631.18680.119355


Partial Autocorrelation Function
Time lag kPACF(k)T-STATP-value
1-0.295479-2.69190.004295
2-0.355615-3.23980.000861
3-0.002204-0.02010.492013
4-0.143959-1.31150.096647
5-0.124023-1.12990.130886
60.1715511.56290.06094
70.0051560.0470.481325
80.0186720.17010.432667
90.1236621.12660.131577
10-0.248848-2.26710.012991
11-0.226158-2.06040.021246
120.2135351.94540.027556
130.0527360.48040.316088
140.0885920.80710.210955
15-0.057561-0.52440.300697
16-0.132619-1.20820.115198
170.0331770.30230.381605
18-0.10383-0.94590.173463
19-0.02734-0.24910.401958
20-0.022435-0.20440.419275
21-0.033214-0.30260.381477
22-0.007376-0.06720.473291
23-0.069283-0.63120.264824
240.0356510.32480.373076
250.092680.84440.200448
26-0.077905-0.70970.239924
27-0.211342-1.92540.028801
280.0816870.74420.229429
29-0.088737-0.80840.210576
30-0.026531-0.24170.404801
310.019390.17660.430108
320.0363730.33140.370597
33-0.015492-0.14110.444052
34-0.014323-0.13050.448249
35-0.065403-0.59590.276448
360.0538110.49020.312627
37-0.011576-0.10550.45813
38-0.019705-0.17950.428983
39-0.053587-0.48820.313346
40-0.069148-0.630.265222
41-0.045131-0.41120.341008
42-0.001975-0.0180.492845
43-0.046233-0.42120.337347
44-0.000717-0.00650.497401
450.092360.84140.20126
46-0.098765-0.89980.185416
47-0.02456-0.22370.411752
48-0.051508-0.46930.320057

\begin{tabular}{lllllllll}
\hline
Partial Autocorrelation Function \tabularnewline
Time lag k & PACF(k) & T-STAT & P-value \tabularnewline
1 & -0.295479 & -2.6919 & 0.004295 \tabularnewline
2 & -0.355615 & -3.2398 & 0.000861 \tabularnewline
3 & -0.002204 & -0.0201 & 0.492013 \tabularnewline
4 & -0.143959 & -1.3115 & 0.096647 \tabularnewline
5 & -0.124023 & -1.1299 & 0.130886 \tabularnewline
6 & 0.171551 & 1.5629 & 0.06094 \tabularnewline
7 & 0.005156 & 0.047 & 0.481325 \tabularnewline
8 & 0.018672 & 0.1701 & 0.432667 \tabularnewline
9 & 0.123662 & 1.1266 & 0.131577 \tabularnewline
10 & -0.248848 & -2.2671 & 0.012991 \tabularnewline
11 & -0.226158 & -2.0604 & 0.021246 \tabularnewline
12 & 0.213535 & 1.9454 & 0.027556 \tabularnewline
13 & 0.052736 & 0.4804 & 0.316088 \tabularnewline
14 & 0.088592 & 0.8071 & 0.210955 \tabularnewline
15 & -0.057561 & -0.5244 & 0.300697 \tabularnewline
16 & -0.132619 & -1.2082 & 0.115198 \tabularnewline
17 & 0.033177 & 0.3023 & 0.381605 \tabularnewline
18 & -0.10383 & -0.9459 & 0.173463 \tabularnewline
19 & -0.02734 & -0.2491 & 0.401958 \tabularnewline
20 & -0.022435 & -0.2044 & 0.419275 \tabularnewline
21 & -0.033214 & -0.3026 & 0.381477 \tabularnewline
22 & -0.007376 & -0.0672 & 0.473291 \tabularnewline
23 & -0.069283 & -0.6312 & 0.264824 \tabularnewline
24 & 0.035651 & 0.3248 & 0.373076 \tabularnewline
25 & 0.09268 & 0.8444 & 0.200448 \tabularnewline
26 & -0.077905 & -0.7097 & 0.239924 \tabularnewline
27 & -0.211342 & -1.9254 & 0.028801 \tabularnewline
28 & 0.081687 & 0.7442 & 0.229429 \tabularnewline
29 & -0.088737 & -0.8084 & 0.210576 \tabularnewline
30 & -0.026531 & -0.2417 & 0.404801 \tabularnewline
31 & 0.01939 & 0.1766 & 0.430108 \tabularnewline
32 & 0.036373 & 0.3314 & 0.370597 \tabularnewline
33 & -0.015492 & -0.1411 & 0.444052 \tabularnewline
34 & -0.014323 & -0.1305 & 0.448249 \tabularnewline
35 & -0.065403 & -0.5959 & 0.276448 \tabularnewline
36 & 0.053811 & 0.4902 & 0.312627 \tabularnewline
37 & -0.011576 & -0.1055 & 0.45813 \tabularnewline
38 & -0.019705 & -0.1795 & 0.428983 \tabularnewline
39 & -0.053587 & -0.4882 & 0.313346 \tabularnewline
40 & -0.069148 & -0.63 & 0.265222 \tabularnewline
41 & -0.045131 & -0.4112 & 0.341008 \tabularnewline
42 & -0.001975 & -0.018 & 0.492845 \tabularnewline
43 & -0.046233 & -0.4212 & 0.337347 \tabularnewline
44 & -0.000717 & -0.0065 & 0.497401 \tabularnewline
45 & 0.09236 & 0.8414 & 0.20126 \tabularnewline
46 & -0.098765 & -0.8998 & 0.185416 \tabularnewline
47 & -0.02456 & -0.2237 & 0.411752 \tabularnewline
48 & -0.051508 & -0.4693 & 0.320057 \tabularnewline
\hline
\end{tabular}
%Source: https://freestatistics.org/blog/index.php?pk=287093&T=2

[TABLE]
[ROW][C]Partial Autocorrelation Function[/C][/ROW]
[ROW][C]Time lag k[/C][C]PACF(k)[/C][C]T-STAT[/C][C]P-value[/C][/ROW]
[ROW][C]1[/C][C]-0.295479[/C][C]-2.6919[/C][C]0.004295[/C][/ROW]
[ROW][C]2[/C][C]-0.355615[/C][C]-3.2398[/C][C]0.000861[/C][/ROW]
[ROW][C]3[/C][C]-0.002204[/C][C]-0.0201[/C][C]0.492013[/C][/ROW]
[ROW][C]4[/C][C]-0.143959[/C][C]-1.3115[/C][C]0.096647[/C][/ROW]
[ROW][C]5[/C][C]-0.124023[/C][C]-1.1299[/C][C]0.130886[/C][/ROW]
[ROW][C]6[/C][C]0.171551[/C][C]1.5629[/C][C]0.06094[/C][/ROW]
[ROW][C]7[/C][C]0.005156[/C][C]0.047[/C][C]0.481325[/C][/ROW]
[ROW][C]8[/C][C]0.018672[/C][C]0.1701[/C][C]0.432667[/C][/ROW]
[ROW][C]9[/C][C]0.123662[/C][C]1.1266[/C][C]0.131577[/C][/ROW]
[ROW][C]10[/C][C]-0.248848[/C][C]-2.2671[/C][C]0.012991[/C][/ROW]
[ROW][C]11[/C][C]-0.226158[/C][C]-2.0604[/C][C]0.021246[/C][/ROW]
[ROW][C]12[/C][C]0.213535[/C][C]1.9454[/C][C]0.027556[/C][/ROW]
[ROW][C]13[/C][C]0.052736[/C][C]0.4804[/C][C]0.316088[/C][/ROW]
[ROW][C]14[/C][C]0.088592[/C][C]0.8071[/C][C]0.210955[/C][/ROW]
[ROW][C]15[/C][C]-0.057561[/C][C]-0.5244[/C][C]0.300697[/C][/ROW]
[ROW][C]16[/C][C]-0.132619[/C][C]-1.2082[/C][C]0.115198[/C][/ROW]
[ROW][C]17[/C][C]0.033177[/C][C]0.3023[/C][C]0.381605[/C][/ROW]
[ROW][C]18[/C][C]-0.10383[/C][C]-0.9459[/C][C]0.173463[/C][/ROW]
[ROW][C]19[/C][C]-0.02734[/C][C]-0.2491[/C][C]0.401958[/C][/ROW]
[ROW][C]20[/C][C]-0.022435[/C][C]-0.2044[/C][C]0.419275[/C][/ROW]
[ROW][C]21[/C][C]-0.033214[/C][C]-0.3026[/C][C]0.381477[/C][/ROW]
[ROW][C]22[/C][C]-0.007376[/C][C]-0.0672[/C][C]0.473291[/C][/ROW]
[ROW][C]23[/C][C]-0.069283[/C][C]-0.6312[/C][C]0.264824[/C][/ROW]
[ROW][C]24[/C][C]0.035651[/C][C]0.3248[/C][C]0.373076[/C][/ROW]
[ROW][C]25[/C][C]0.09268[/C][C]0.8444[/C][C]0.200448[/C][/ROW]
[ROW][C]26[/C][C]-0.077905[/C][C]-0.7097[/C][C]0.239924[/C][/ROW]
[ROW][C]27[/C][C]-0.211342[/C][C]-1.9254[/C][C]0.028801[/C][/ROW]
[ROW][C]28[/C][C]0.081687[/C][C]0.7442[/C][C]0.229429[/C][/ROW]
[ROW][C]29[/C][C]-0.088737[/C][C]-0.8084[/C][C]0.210576[/C][/ROW]
[ROW][C]30[/C][C]-0.026531[/C][C]-0.2417[/C][C]0.404801[/C][/ROW]
[ROW][C]31[/C][C]0.01939[/C][C]0.1766[/C][C]0.430108[/C][/ROW]
[ROW][C]32[/C][C]0.036373[/C][C]0.3314[/C][C]0.370597[/C][/ROW]
[ROW][C]33[/C][C]-0.015492[/C][C]-0.1411[/C][C]0.444052[/C][/ROW]
[ROW][C]34[/C][C]-0.014323[/C][C]-0.1305[/C][C]0.448249[/C][/ROW]
[ROW][C]35[/C][C]-0.065403[/C][C]-0.5959[/C][C]0.276448[/C][/ROW]
[ROW][C]36[/C][C]0.053811[/C][C]0.4902[/C][C]0.312627[/C][/ROW]
[ROW][C]37[/C][C]-0.011576[/C][C]-0.1055[/C][C]0.45813[/C][/ROW]
[ROW][C]38[/C][C]-0.019705[/C][C]-0.1795[/C][C]0.428983[/C][/ROW]
[ROW][C]39[/C][C]-0.053587[/C][C]-0.4882[/C][C]0.313346[/C][/ROW]
[ROW][C]40[/C][C]-0.069148[/C][C]-0.63[/C][C]0.265222[/C][/ROW]
[ROW][C]41[/C][C]-0.045131[/C][C]-0.4112[/C][C]0.341008[/C][/ROW]
[ROW][C]42[/C][C]-0.001975[/C][C]-0.018[/C][C]0.492845[/C][/ROW]
[ROW][C]43[/C][C]-0.046233[/C][C]-0.4212[/C][C]0.337347[/C][/ROW]
[ROW][C]44[/C][C]-0.000717[/C][C]-0.0065[/C][C]0.497401[/C][/ROW]
[ROW][C]45[/C][C]0.09236[/C][C]0.8414[/C][C]0.20126[/C][/ROW]
[ROW][C]46[/C][C]-0.098765[/C][C]-0.8998[/C][C]0.185416[/C][/ROW]
[ROW][C]47[/C][C]-0.02456[/C][C]-0.2237[/C][C]0.411752[/C][/ROW]
[ROW][C]48[/C][C]-0.051508[/C][C]-0.4693[/C][C]0.320057[/C][/ROW]
[/TABLE]
Source: https://freestatistics.org/blog/index.php?pk=287093&T=2

Globally Unique Identifier (entire table): ba.freestatistics.org/blog/index.php?pk=287093&T=2

As an alternative you can also use a QR Code:  

The GUIDs for individual cells are displayed in the table below:

Partial Autocorrelation Function
Time lag kPACF(k)T-STATP-value
1-0.295479-2.69190.004295
2-0.355615-3.23980.000861
3-0.002204-0.02010.492013
4-0.143959-1.31150.096647
5-0.124023-1.12990.130886
60.1715511.56290.06094
70.0051560.0470.481325
80.0186720.17010.432667
90.1236621.12660.131577
10-0.248848-2.26710.012991
11-0.226158-2.06040.021246
120.2135351.94540.027556
130.0527360.48040.316088
140.0885920.80710.210955
15-0.057561-0.52440.300697
16-0.132619-1.20820.115198
170.0331770.30230.381605
18-0.10383-0.94590.173463
19-0.02734-0.24910.401958
20-0.022435-0.20440.419275
21-0.033214-0.30260.381477
22-0.007376-0.06720.473291
23-0.069283-0.63120.264824
240.0356510.32480.373076
250.092680.84440.200448
26-0.077905-0.70970.239924
27-0.211342-1.92540.028801
280.0816870.74420.229429
29-0.088737-0.80840.210576
30-0.026531-0.24170.404801
310.019390.17660.430108
320.0363730.33140.370597
33-0.015492-0.14110.444052
34-0.014323-0.13050.448249
35-0.065403-0.59590.276448
360.0538110.49020.312627
37-0.011576-0.10550.45813
38-0.019705-0.17950.428983
39-0.053587-0.48820.313346
40-0.069148-0.630.265222
41-0.045131-0.41120.341008
42-0.001975-0.0180.492845
43-0.046233-0.42120.337347
44-0.000717-0.00650.497401
450.092360.84140.20126
46-0.098765-0.89980.185416
47-0.02456-0.22370.411752
48-0.051508-0.46930.320057


Parameters (Session):
par1 = 48 ; par2 = 1 ; par3 = 1 ; par4 = 0 ; par5 = 12 ; par6 = White Noise ; par7 = 0.95 ;
Parameters (R input):
par1 = 48 ; par2 = 1 ; par3 = 1 ; par4 = 0 ; par5 = 12 ; par6 = White Noise ; par7 = 0.95 ; par8 = ;
R code (references can be found in the software module):
if (par1 == 'Default') {
par1 = 10*log10(length(x))
} else {
par1 <- as.numeric(par1)
}
par2 <- as.numeric(par2)
par3 <- as.numeric(par3)
par4 <- as.numeric(par4)
par5 <- as.numeric(par5)
if (par6 == 'White Noise') par6 <- 'white' else par6 <- 'ma'
par7 <- as.numeric(par7)
if (par8 != '') par8 <- as.numeric(par8)
x <- na.omit(x)
ox <- x
if (par8 == '') {
if (par2 == 0) {
x <- log(x)
} else {
x <- (x ^ par2 - 1) / par2
}
} else {
x <- log(x,base=par8)
}
if (par3 > 0) x <- diff(x,lag=1,difference=par3)
if (par4 > 0) x <- diff(x,lag=par5,difference=par4)
bitmap(file='picts.png')
op <- par(mfrow=c(2,1))
plot(ox,type='l',main='Original Time Series',xlab='time',ylab='value')
if (par8=='') {
mytitle <- paste('Working Time Series (lambda=',par2,', d=',par3,', D=',par4,')',sep='')
mysub <- paste('(lambda=',par2,', d=',par3,', D=',par4,', CI=', par7, ', CI type=',par6,')',sep='')
} else {
mytitle <- paste('Working Time Series (base=',par8,', d=',par3,', D=',par4,')',sep='')
mysub <- paste('(base=',par8,', d=',par3,', D=',par4,', CI=', par7, ', CI type=',par6,')',sep='')
}
plot(x,type='l', main=mytitle,xlab='time',ylab='value')
par(op)
dev.off()
bitmap(file='pic1.png')
racf <- acf(x, par1, main='Autocorrelation', xlab='time lag', ylab='ACF', ci.type=par6, ci=par7, sub=mysub)
dev.off()
bitmap(file='pic2.png')
rpacf <- pacf(x,par1,main='Partial Autocorrelation',xlab='lags',ylab='PACF',sub=mysub)
dev.off()
(myacf <- c(racf$acf))
(mypacf <- c(rpacf$acf))
lengthx <- length(x)
sqrtn <- sqrt(lengthx)
load(file='createtable')
a<-table.start()
a<-table.row.start(a)
a<-table.element(a,'Autocorrelation Function',4,TRUE)
a<-table.row.end(a)
a<-table.row.start(a)
a<-table.element(a,'Time lag k',header=TRUE)
a<-table.element(a,hyperlink('basics.htm','ACF(k)','click here for more information about the Autocorrelation Function'),header=TRUE)
a<-table.element(a,'T-STAT',header=TRUE)
a<-table.element(a,'P-value',header=TRUE)
a<-table.row.end(a)
for (i in 2:(par1+1)) {
a<-table.row.start(a)
a<-table.element(a,i-1,header=TRUE)
a<-table.element(a,round(myacf[i],6))
mytstat <- myacf[i]*sqrtn
a<-table.element(a,round(mytstat,4))
a<-table.element(a,round(1-pt(abs(mytstat),lengthx),6))
a<-table.row.end(a)
}
a<-table.end(a)
table.save(a,file='mytable.tab')
a<-table.start()
a<-table.row.start(a)
a<-table.element(a,'Partial Autocorrelation Function',4,TRUE)
a<-table.row.end(a)
a<-table.row.start(a)
a<-table.element(a,'Time lag k',header=TRUE)
a<-table.element(a,hyperlink('basics.htm','PACF(k)','click here for more information about the Partial Autocorrelation Function'),header=TRUE)
a<-table.element(a,'T-STAT',header=TRUE)
a<-table.element(a,'P-value',header=TRUE)
a<-table.row.end(a)
for (i in 1:par1) {
a<-table.row.start(a)
a<-table.element(a,i,header=TRUE)
a<-table.element(a,round(mypacf[i],6))
mytstat <- mypacf[i]*sqrtn
a<-table.element(a,round(mytstat,4))
a<-table.element(a,round(1-pt(abs(mytstat),lengthx),6))
a<-table.row.end(a)
}
a<-table.end(a)
table.save(a,file='mytable1.tab')