Free Statistics

of Irreproducible Research!

Author's title

Author*Unverified author*
R Software Modulerwasp_autocorrelation.wasp
Title produced by software(Partial) Autocorrelation Function
Date of computationThu, 24 Dec 2015 16:47:40 +0000
Cite this page as followsStatistical Computations at FreeStatistics.org, Office for Research Development and Education, URL https://freestatistics.org/blog/index.php?v=date/2015/Dec/24/t1450975689s119d5ynfio9sq2.htm/, Retrieved Sat, 18 May 2024 09:37:52 +0000
Statistical Computations at FreeStatistics.org, Office for Research Development and Education, URL https://freestatistics.org/blog/index.php?pk=287072, Retrieved Sat, 18 May 2024 09:37:52 +0000
QR Codes:

Original text written by user:
IsPrivate?No (this computation is public)
User-defined keywords
Estimated Impact154
Family? (F = Feedback message, R = changed R code, M = changed R Module, P = changed Parameters, D = changed Data)
-     [(Partial) Autocorrelation Function] [] [2015-10-23 08:40:58] [b63ade344763e232a60872be122cd067]
- R PD    [(Partial) Autocorrelation Function] [] [2015-12-24 16:47:40] [4b4e0ace64f044c9dde59b15676ee69f] [Current]
Feedback Forum

Post a new message
Dataseries X:
104.93
105.68
106.93
107.29
107.25
106.74
106.44
106.6
107.26
107.35
107.22
106.99
106.87
107.68
108.9
109.48
109.57
109.03
109.58
109.76
110.15
110.2
109.86
109.58
109.52
110.35
111.61
112.06
111.9
111.36
112.09
112.24
112.7
113.36
112.9
112.74
112.7
113.66
114.87
114.97
115
114.57
115.54
115.39
115.46
115.13
114.56
114.62
114.37
114.86
115.82
116.35
115.95
115.64
116.58
116.5
116.48
116.34
115.65
115.42


Summary of computational transaction
Raw Inputview raw input (R code)
Raw Outputview raw output of R engine
Computing time1 seconds
R Server'Gwilym Jenkins' @ jenkins.wessa.net

\begin{tabular}{lllllllll}
\hline
Summary of computational transaction \tabularnewline
Raw Input & view raw input (R code)  \tabularnewline
Raw Output & view raw output of R engine  \tabularnewline
Computing time & 1 seconds \tabularnewline
R Server & 'Gwilym Jenkins' @ jenkins.wessa.net \tabularnewline
\hline
\end{tabular}
%Source: https://freestatistics.org/blog/index.php?pk=287072&T=0

[TABLE]
[ROW][C]Summary of computational transaction[/C][/ROW]
[ROW][C]Raw Input[/C][C]view raw input (R code) [/C][/ROW]
[ROW][C]Raw Output[/C][C]view raw output of R engine [/C][/ROW]
[ROW][C]Computing time[/C][C]1 seconds[/C][/ROW]
[ROW][C]R Server[/C][C]'Gwilym Jenkins' @ jenkins.wessa.net[/C][/ROW]
[/TABLE]
Source: https://freestatistics.org/blog/index.php?pk=287072&T=0

Globally Unique Identifier (entire table): ba.freestatistics.org/blog/index.php?pk=287072&T=0

As an alternative you can also use a QR Code:  

The GUIDs for individual cells are displayed in the table below:

Summary of computational transaction
Raw Inputview raw input (R code)
Raw Outputview raw output of R engine
Computing time1 seconds
R Server'Gwilym Jenkins' @ jenkins.wessa.net


Autocorrelation Function
Time lag kACF(k)T-STATP-value
10.2702382.07570.021143
2-0.193514-1.48640.071248
3-0.421691-3.23910.000986
4-0.223307-1.71530.045773
50.2142421.64560.052579
60.2132651.63810.05336
70.1313751.00910.158521
8-0.345606-2.65460.005095
9-0.422776-3.24740.000962
10-0.135456-1.04050.151186
110.236211.81440.037353
120.6919165.31471e-06
130.1619041.24360.109281
14-0.160034-1.22920.11193
15-0.345027-2.65020.005155
16-0.082982-0.63740.263166
170.2646652.03290.023283
180.1808061.38880.085057
190.0107070.08220.467365
20-0.340512-2.61550.005647
21-0.359239-2.75940.003851
22-0.067687-0.51990.302534
230.2281281.75230.04246
240.4848533.72420.00022
250.0552550.42440.336402
26-0.193727-1.4880.071032
27-0.238019-1.82830.036284
28-0.013145-0.1010.45996
290.1775741.3640.088878
300.0892760.68570.247782
31-0.036449-0.280.390241
32-0.255599-1.96330.027166
33-0.235315-1.80750.037892
34-0.003077-0.02360.490611
350.1759141.35120.090891
360.2773022.130.018676
370.0276760.21260.416193
38-0.089145-0.68470.248095
39-0.082711-0.63530.26384
400.0637460.48960.3131
410.1086050.83420.203764
420.0256410.1970.42227
43-0.07527-0.57820.282679
44-0.197134-1.51420.067655
45-0.149329-1.1470.128002
46-0.000976-0.00750.497023
470.0765330.58790.279434
480.0957030.73510.232593

\begin{tabular}{lllllllll}
\hline
Autocorrelation Function \tabularnewline
Time lag k & ACF(k) & T-STAT & P-value \tabularnewline
1 & 0.270238 & 2.0757 & 0.021143 \tabularnewline
2 & -0.193514 & -1.4864 & 0.071248 \tabularnewline
3 & -0.421691 & -3.2391 & 0.000986 \tabularnewline
4 & -0.223307 & -1.7153 & 0.045773 \tabularnewline
5 & 0.214242 & 1.6456 & 0.052579 \tabularnewline
6 & 0.213265 & 1.6381 & 0.05336 \tabularnewline
7 & 0.131375 & 1.0091 & 0.158521 \tabularnewline
8 & -0.345606 & -2.6546 & 0.005095 \tabularnewline
9 & -0.422776 & -3.2474 & 0.000962 \tabularnewline
10 & -0.135456 & -1.0405 & 0.151186 \tabularnewline
11 & 0.23621 & 1.8144 & 0.037353 \tabularnewline
12 & 0.691916 & 5.3147 & 1e-06 \tabularnewline
13 & 0.161904 & 1.2436 & 0.109281 \tabularnewline
14 & -0.160034 & -1.2292 & 0.11193 \tabularnewline
15 & -0.345027 & -2.6502 & 0.005155 \tabularnewline
16 & -0.082982 & -0.6374 & 0.263166 \tabularnewline
17 & 0.264665 & 2.0329 & 0.023283 \tabularnewline
18 & 0.180806 & 1.3888 & 0.085057 \tabularnewline
19 & 0.010707 & 0.0822 & 0.467365 \tabularnewline
20 & -0.340512 & -2.6155 & 0.005647 \tabularnewline
21 & -0.359239 & -2.7594 & 0.003851 \tabularnewline
22 & -0.067687 & -0.5199 & 0.302534 \tabularnewline
23 & 0.228128 & 1.7523 & 0.04246 \tabularnewline
24 & 0.484853 & 3.7242 & 0.00022 \tabularnewline
25 & 0.055255 & 0.4244 & 0.336402 \tabularnewline
26 & -0.193727 & -1.488 & 0.071032 \tabularnewline
27 & -0.238019 & -1.8283 & 0.036284 \tabularnewline
28 & -0.013145 & -0.101 & 0.45996 \tabularnewline
29 & 0.177574 & 1.364 & 0.088878 \tabularnewline
30 & 0.089276 & 0.6857 & 0.247782 \tabularnewline
31 & -0.036449 & -0.28 & 0.390241 \tabularnewline
32 & -0.255599 & -1.9633 & 0.027166 \tabularnewline
33 & -0.235315 & -1.8075 & 0.037892 \tabularnewline
34 & -0.003077 & -0.0236 & 0.490611 \tabularnewline
35 & 0.175914 & 1.3512 & 0.090891 \tabularnewline
36 & 0.277302 & 2.13 & 0.018676 \tabularnewline
37 & 0.027676 & 0.2126 & 0.416193 \tabularnewline
38 & -0.089145 & -0.6847 & 0.248095 \tabularnewline
39 & -0.082711 & -0.6353 & 0.26384 \tabularnewline
40 & 0.063746 & 0.4896 & 0.3131 \tabularnewline
41 & 0.108605 & 0.8342 & 0.203764 \tabularnewline
42 & 0.025641 & 0.197 & 0.42227 \tabularnewline
43 & -0.07527 & -0.5782 & 0.282679 \tabularnewline
44 & -0.197134 & -1.5142 & 0.067655 \tabularnewline
45 & -0.149329 & -1.147 & 0.128002 \tabularnewline
46 & -0.000976 & -0.0075 & 0.497023 \tabularnewline
47 & 0.076533 & 0.5879 & 0.279434 \tabularnewline
48 & 0.095703 & 0.7351 & 0.232593 \tabularnewline
\hline
\end{tabular}
%Source: https://freestatistics.org/blog/index.php?pk=287072&T=1

[TABLE]
[ROW][C]Autocorrelation Function[/C][/ROW]
[ROW][C]Time lag k[/C][C]ACF(k)[/C][C]T-STAT[/C][C]P-value[/C][/ROW]
[ROW][C]1[/C][C]0.270238[/C][C]2.0757[/C][C]0.021143[/C][/ROW]
[ROW][C]2[/C][C]-0.193514[/C][C]-1.4864[/C][C]0.071248[/C][/ROW]
[ROW][C]3[/C][C]-0.421691[/C][C]-3.2391[/C][C]0.000986[/C][/ROW]
[ROW][C]4[/C][C]-0.223307[/C][C]-1.7153[/C][C]0.045773[/C][/ROW]
[ROW][C]5[/C][C]0.214242[/C][C]1.6456[/C][C]0.052579[/C][/ROW]
[ROW][C]6[/C][C]0.213265[/C][C]1.6381[/C][C]0.05336[/C][/ROW]
[ROW][C]7[/C][C]0.131375[/C][C]1.0091[/C][C]0.158521[/C][/ROW]
[ROW][C]8[/C][C]-0.345606[/C][C]-2.6546[/C][C]0.005095[/C][/ROW]
[ROW][C]9[/C][C]-0.422776[/C][C]-3.2474[/C][C]0.000962[/C][/ROW]
[ROW][C]10[/C][C]-0.135456[/C][C]-1.0405[/C][C]0.151186[/C][/ROW]
[ROW][C]11[/C][C]0.23621[/C][C]1.8144[/C][C]0.037353[/C][/ROW]
[ROW][C]12[/C][C]0.691916[/C][C]5.3147[/C][C]1e-06[/C][/ROW]
[ROW][C]13[/C][C]0.161904[/C][C]1.2436[/C][C]0.109281[/C][/ROW]
[ROW][C]14[/C][C]-0.160034[/C][C]-1.2292[/C][C]0.11193[/C][/ROW]
[ROW][C]15[/C][C]-0.345027[/C][C]-2.6502[/C][C]0.005155[/C][/ROW]
[ROW][C]16[/C][C]-0.082982[/C][C]-0.6374[/C][C]0.263166[/C][/ROW]
[ROW][C]17[/C][C]0.264665[/C][C]2.0329[/C][C]0.023283[/C][/ROW]
[ROW][C]18[/C][C]0.180806[/C][C]1.3888[/C][C]0.085057[/C][/ROW]
[ROW][C]19[/C][C]0.010707[/C][C]0.0822[/C][C]0.467365[/C][/ROW]
[ROW][C]20[/C][C]-0.340512[/C][C]-2.6155[/C][C]0.005647[/C][/ROW]
[ROW][C]21[/C][C]-0.359239[/C][C]-2.7594[/C][C]0.003851[/C][/ROW]
[ROW][C]22[/C][C]-0.067687[/C][C]-0.5199[/C][C]0.302534[/C][/ROW]
[ROW][C]23[/C][C]0.228128[/C][C]1.7523[/C][C]0.04246[/C][/ROW]
[ROW][C]24[/C][C]0.484853[/C][C]3.7242[/C][C]0.00022[/C][/ROW]
[ROW][C]25[/C][C]0.055255[/C][C]0.4244[/C][C]0.336402[/C][/ROW]
[ROW][C]26[/C][C]-0.193727[/C][C]-1.488[/C][C]0.071032[/C][/ROW]
[ROW][C]27[/C][C]-0.238019[/C][C]-1.8283[/C][C]0.036284[/C][/ROW]
[ROW][C]28[/C][C]-0.013145[/C][C]-0.101[/C][C]0.45996[/C][/ROW]
[ROW][C]29[/C][C]0.177574[/C][C]1.364[/C][C]0.088878[/C][/ROW]
[ROW][C]30[/C][C]0.089276[/C][C]0.6857[/C][C]0.247782[/C][/ROW]
[ROW][C]31[/C][C]-0.036449[/C][C]-0.28[/C][C]0.390241[/C][/ROW]
[ROW][C]32[/C][C]-0.255599[/C][C]-1.9633[/C][C]0.027166[/C][/ROW]
[ROW][C]33[/C][C]-0.235315[/C][C]-1.8075[/C][C]0.037892[/C][/ROW]
[ROW][C]34[/C][C]-0.003077[/C][C]-0.0236[/C][C]0.490611[/C][/ROW]
[ROW][C]35[/C][C]0.175914[/C][C]1.3512[/C][C]0.090891[/C][/ROW]
[ROW][C]36[/C][C]0.277302[/C][C]2.13[/C][C]0.018676[/C][/ROW]
[ROW][C]37[/C][C]0.027676[/C][C]0.2126[/C][C]0.416193[/C][/ROW]
[ROW][C]38[/C][C]-0.089145[/C][C]-0.6847[/C][C]0.248095[/C][/ROW]
[ROW][C]39[/C][C]-0.082711[/C][C]-0.6353[/C][C]0.26384[/C][/ROW]
[ROW][C]40[/C][C]0.063746[/C][C]0.4896[/C][C]0.3131[/C][/ROW]
[ROW][C]41[/C][C]0.108605[/C][C]0.8342[/C][C]0.203764[/C][/ROW]
[ROW][C]42[/C][C]0.025641[/C][C]0.197[/C][C]0.42227[/C][/ROW]
[ROW][C]43[/C][C]-0.07527[/C][C]-0.5782[/C][C]0.282679[/C][/ROW]
[ROW][C]44[/C][C]-0.197134[/C][C]-1.5142[/C][C]0.067655[/C][/ROW]
[ROW][C]45[/C][C]-0.149329[/C][C]-1.147[/C][C]0.128002[/C][/ROW]
[ROW][C]46[/C][C]-0.000976[/C][C]-0.0075[/C][C]0.497023[/C][/ROW]
[ROW][C]47[/C][C]0.076533[/C][C]0.5879[/C][C]0.279434[/C][/ROW]
[ROW][C]48[/C][C]0.095703[/C][C]0.7351[/C][C]0.232593[/C][/ROW]
[/TABLE]
Source: https://freestatistics.org/blog/index.php?pk=287072&T=1

Globally Unique Identifier (entire table): ba.freestatistics.org/blog/index.php?pk=287072&T=1

As an alternative you can also use a QR Code:  

The GUIDs for individual cells are displayed in the table below:

Autocorrelation Function
Time lag kACF(k)T-STATP-value
10.2702382.07570.021143
2-0.193514-1.48640.071248
3-0.421691-3.23910.000986
4-0.223307-1.71530.045773
50.2142421.64560.052579
60.2132651.63810.05336
70.1313751.00910.158521
8-0.345606-2.65460.005095
9-0.422776-3.24740.000962
10-0.135456-1.04050.151186
110.236211.81440.037353
120.6919165.31471e-06
130.1619041.24360.109281
14-0.160034-1.22920.11193
15-0.345027-2.65020.005155
16-0.082982-0.63740.263166
170.2646652.03290.023283
180.1808061.38880.085057
190.0107070.08220.467365
20-0.340512-2.61550.005647
21-0.359239-2.75940.003851
22-0.067687-0.51990.302534
230.2281281.75230.04246
240.4848533.72420.00022
250.0552550.42440.336402
26-0.193727-1.4880.071032
27-0.238019-1.82830.036284
28-0.013145-0.1010.45996
290.1775741.3640.088878
300.0892760.68570.247782
31-0.036449-0.280.390241
32-0.255599-1.96330.027166
33-0.235315-1.80750.037892
34-0.003077-0.02360.490611
350.1759141.35120.090891
360.2773022.130.018676
370.0276760.21260.416193
38-0.089145-0.68470.248095
39-0.082711-0.63530.26384
400.0637460.48960.3131
410.1086050.83420.203764
420.0256410.1970.42227
43-0.07527-0.57820.282679
44-0.197134-1.51420.067655
45-0.149329-1.1470.128002
46-0.000976-0.00750.497023
470.0765330.58790.279434
480.0957030.73510.232593


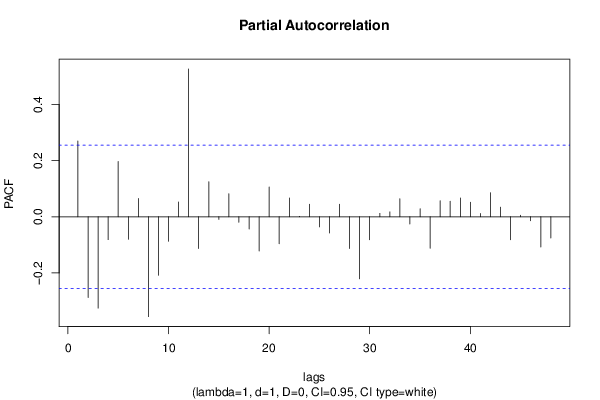
Partial Autocorrelation Function
Time lag kPACF(k)T-STATP-value
10.2702382.07570.021143
2-0.287541-2.20860.015548
3-0.32535-2.49910.007628
4-0.081344-0.62480.26725
50.1968381.51190.067944
6-0.080084-0.61510.270416
70.0653160.50170.308873
8-0.355652-2.73180.004148
9-0.208057-1.59810.05768
10-0.087372-0.67110.252382
110.052780.40540.343321
120.5265564.04467.7e-05
13-0.113197-0.86950.194053
140.1245820.95690.171253
15-0.00924-0.0710.471829
160.0820860.63050.265397
17-0.019614-0.15070.440379
18-0.043212-0.33190.370565
19-0.121598-0.9340.177053
200.1063930.81720.208546
21-0.095905-0.73670.232124
220.0667960.51310.304909
230.0016270.01250.495036
240.0447030.34340.366272
25-0.036018-0.27670.391505
26-0.057713-0.44330.329585
270.04470.34330.36628
28-0.112884-0.86710.194705
29-0.221018-1.69770.047419
30-0.081658-0.62720.266466
310.012290.09440.462554
320.0176790.13580.446223
330.0644230.49480.311274
34-0.025573-0.19640.422473
350.0287560.22090.412976
36-0.111971-0.86010.196617
370.0568980.4370.331837
380.0551540.42360.336682
390.0668210.51330.304844
400.0518570.39830.345914
410.0117660.09040.464147
420.0858060.65910.256202
430.034340.26380.396438
44-0.081756-0.6280.266221
450.0055970.0430.482925
46-0.014124-0.10850.456988
47-0.107663-0.8270.205793
48-0.075666-0.58120.281658

\begin{tabular}{lllllllll}
\hline
Partial Autocorrelation Function \tabularnewline
Time lag k & PACF(k) & T-STAT & P-value \tabularnewline
1 & 0.270238 & 2.0757 & 0.021143 \tabularnewline
2 & -0.287541 & -2.2086 & 0.015548 \tabularnewline
3 & -0.32535 & -2.4991 & 0.007628 \tabularnewline
4 & -0.081344 & -0.6248 & 0.26725 \tabularnewline
5 & 0.196838 & 1.5119 & 0.067944 \tabularnewline
6 & -0.080084 & -0.6151 & 0.270416 \tabularnewline
7 & 0.065316 & 0.5017 & 0.308873 \tabularnewline
8 & -0.355652 & -2.7318 & 0.004148 \tabularnewline
9 & -0.208057 & -1.5981 & 0.05768 \tabularnewline
10 & -0.087372 & -0.6711 & 0.252382 \tabularnewline
11 & 0.05278 & 0.4054 & 0.343321 \tabularnewline
12 & 0.526556 & 4.0446 & 7.7e-05 \tabularnewline
13 & -0.113197 & -0.8695 & 0.194053 \tabularnewline
14 & 0.124582 & 0.9569 & 0.171253 \tabularnewline
15 & -0.00924 & -0.071 & 0.471829 \tabularnewline
16 & 0.082086 & 0.6305 & 0.265397 \tabularnewline
17 & -0.019614 & -0.1507 & 0.440379 \tabularnewline
18 & -0.043212 & -0.3319 & 0.370565 \tabularnewline
19 & -0.121598 & -0.934 & 0.177053 \tabularnewline
20 & 0.106393 & 0.8172 & 0.208546 \tabularnewline
21 & -0.095905 & -0.7367 & 0.232124 \tabularnewline
22 & 0.066796 & 0.5131 & 0.304909 \tabularnewline
23 & 0.001627 & 0.0125 & 0.495036 \tabularnewline
24 & 0.044703 & 0.3434 & 0.366272 \tabularnewline
25 & -0.036018 & -0.2767 & 0.391505 \tabularnewline
26 & -0.057713 & -0.4433 & 0.329585 \tabularnewline
27 & 0.0447 & 0.3433 & 0.36628 \tabularnewline
28 & -0.112884 & -0.8671 & 0.194705 \tabularnewline
29 & -0.221018 & -1.6977 & 0.047419 \tabularnewline
30 & -0.081658 & -0.6272 & 0.266466 \tabularnewline
31 & 0.01229 & 0.0944 & 0.462554 \tabularnewline
32 & 0.017679 & 0.1358 & 0.446223 \tabularnewline
33 & 0.064423 & 0.4948 & 0.311274 \tabularnewline
34 & -0.025573 & -0.1964 & 0.422473 \tabularnewline
35 & 0.028756 & 0.2209 & 0.412976 \tabularnewline
36 & -0.111971 & -0.8601 & 0.196617 \tabularnewline
37 & 0.056898 & 0.437 & 0.331837 \tabularnewline
38 & 0.055154 & 0.4236 & 0.336682 \tabularnewline
39 & 0.066821 & 0.5133 & 0.304844 \tabularnewline
40 & 0.051857 & 0.3983 & 0.345914 \tabularnewline
41 & 0.011766 & 0.0904 & 0.464147 \tabularnewline
42 & 0.085806 & 0.6591 & 0.256202 \tabularnewline
43 & 0.03434 & 0.2638 & 0.396438 \tabularnewline
44 & -0.081756 & -0.628 & 0.266221 \tabularnewline
45 & 0.005597 & 0.043 & 0.482925 \tabularnewline
46 & -0.014124 & -0.1085 & 0.456988 \tabularnewline
47 & -0.107663 & -0.827 & 0.205793 \tabularnewline
48 & -0.075666 & -0.5812 & 0.281658 \tabularnewline
\hline
\end{tabular}
%Source: https://freestatistics.org/blog/index.php?pk=287072&T=2

[TABLE]
[ROW][C]Partial Autocorrelation Function[/C][/ROW]
[ROW][C]Time lag k[/C][C]PACF(k)[/C][C]T-STAT[/C][C]P-value[/C][/ROW]
[ROW][C]1[/C][C]0.270238[/C][C]2.0757[/C][C]0.021143[/C][/ROW]
[ROW][C]2[/C][C]-0.287541[/C][C]-2.2086[/C][C]0.015548[/C][/ROW]
[ROW][C]3[/C][C]-0.32535[/C][C]-2.4991[/C][C]0.007628[/C][/ROW]
[ROW][C]4[/C][C]-0.081344[/C][C]-0.6248[/C][C]0.26725[/C][/ROW]
[ROW][C]5[/C][C]0.196838[/C][C]1.5119[/C][C]0.067944[/C][/ROW]
[ROW][C]6[/C][C]-0.080084[/C][C]-0.6151[/C][C]0.270416[/C][/ROW]
[ROW][C]7[/C][C]0.065316[/C][C]0.5017[/C][C]0.308873[/C][/ROW]
[ROW][C]8[/C][C]-0.355652[/C][C]-2.7318[/C][C]0.004148[/C][/ROW]
[ROW][C]9[/C][C]-0.208057[/C][C]-1.5981[/C][C]0.05768[/C][/ROW]
[ROW][C]10[/C][C]-0.087372[/C][C]-0.6711[/C][C]0.252382[/C][/ROW]
[ROW][C]11[/C][C]0.05278[/C][C]0.4054[/C][C]0.343321[/C][/ROW]
[ROW][C]12[/C][C]0.526556[/C][C]4.0446[/C][C]7.7e-05[/C][/ROW]
[ROW][C]13[/C][C]-0.113197[/C][C]-0.8695[/C][C]0.194053[/C][/ROW]
[ROW][C]14[/C][C]0.124582[/C][C]0.9569[/C][C]0.171253[/C][/ROW]
[ROW][C]15[/C][C]-0.00924[/C][C]-0.071[/C][C]0.471829[/C][/ROW]
[ROW][C]16[/C][C]0.082086[/C][C]0.6305[/C][C]0.265397[/C][/ROW]
[ROW][C]17[/C][C]-0.019614[/C][C]-0.1507[/C][C]0.440379[/C][/ROW]
[ROW][C]18[/C][C]-0.043212[/C][C]-0.3319[/C][C]0.370565[/C][/ROW]
[ROW][C]19[/C][C]-0.121598[/C][C]-0.934[/C][C]0.177053[/C][/ROW]
[ROW][C]20[/C][C]0.106393[/C][C]0.8172[/C][C]0.208546[/C][/ROW]
[ROW][C]21[/C][C]-0.095905[/C][C]-0.7367[/C][C]0.232124[/C][/ROW]
[ROW][C]22[/C][C]0.066796[/C][C]0.5131[/C][C]0.304909[/C][/ROW]
[ROW][C]23[/C][C]0.001627[/C][C]0.0125[/C][C]0.495036[/C][/ROW]
[ROW][C]24[/C][C]0.044703[/C][C]0.3434[/C][C]0.366272[/C][/ROW]
[ROW][C]25[/C][C]-0.036018[/C][C]-0.2767[/C][C]0.391505[/C][/ROW]
[ROW][C]26[/C][C]-0.057713[/C][C]-0.4433[/C][C]0.329585[/C][/ROW]
[ROW][C]27[/C][C]0.0447[/C][C]0.3433[/C][C]0.36628[/C][/ROW]
[ROW][C]28[/C][C]-0.112884[/C][C]-0.8671[/C][C]0.194705[/C][/ROW]
[ROW][C]29[/C][C]-0.221018[/C][C]-1.6977[/C][C]0.047419[/C][/ROW]
[ROW][C]30[/C][C]-0.081658[/C][C]-0.6272[/C][C]0.266466[/C][/ROW]
[ROW][C]31[/C][C]0.01229[/C][C]0.0944[/C][C]0.462554[/C][/ROW]
[ROW][C]32[/C][C]0.017679[/C][C]0.1358[/C][C]0.446223[/C][/ROW]
[ROW][C]33[/C][C]0.064423[/C][C]0.4948[/C][C]0.311274[/C][/ROW]
[ROW][C]34[/C][C]-0.025573[/C][C]-0.1964[/C][C]0.422473[/C][/ROW]
[ROW][C]35[/C][C]0.028756[/C][C]0.2209[/C][C]0.412976[/C][/ROW]
[ROW][C]36[/C][C]-0.111971[/C][C]-0.8601[/C][C]0.196617[/C][/ROW]
[ROW][C]37[/C][C]0.056898[/C][C]0.437[/C][C]0.331837[/C][/ROW]
[ROW][C]38[/C][C]0.055154[/C][C]0.4236[/C][C]0.336682[/C][/ROW]
[ROW][C]39[/C][C]0.066821[/C][C]0.5133[/C][C]0.304844[/C][/ROW]
[ROW][C]40[/C][C]0.051857[/C][C]0.3983[/C][C]0.345914[/C][/ROW]
[ROW][C]41[/C][C]0.011766[/C][C]0.0904[/C][C]0.464147[/C][/ROW]
[ROW][C]42[/C][C]0.085806[/C][C]0.6591[/C][C]0.256202[/C][/ROW]
[ROW][C]43[/C][C]0.03434[/C][C]0.2638[/C][C]0.396438[/C][/ROW]
[ROW][C]44[/C][C]-0.081756[/C][C]-0.628[/C][C]0.266221[/C][/ROW]
[ROW][C]45[/C][C]0.005597[/C][C]0.043[/C][C]0.482925[/C][/ROW]
[ROW][C]46[/C][C]-0.014124[/C][C]-0.1085[/C][C]0.456988[/C][/ROW]
[ROW][C]47[/C][C]-0.107663[/C][C]-0.827[/C][C]0.205793[/C][/ROW]
[ROW][C]48[/C][C]-0.075666[/C][C]-0.5812[/C][C]0.281658[/C][/ROW]
[/TABLE]
Source: https://freestatistics.org/blog/index.php?pk=287072&T=2

Globally Unique Identifier (entire table): ba.freestatistics.org/blog/index.php?pk=287072&T=2

As an alternative you can also use a QR Code:  

The GUIDs for individual cells are displayed in the table below:

Partial Autocorrelation Function
Time lag kPACF(k)T-STATP-value
10.2702382.07570.021143
2-0.287541-2.20860.015548
3-0.32535-2.49910.007628
4-0.081344-0.62480.26725
50.1968381.51190.067944
6-0.080084-0.61510.270416
70.0653160.50170.308873
8-0.355652-2.73180.004148
9-0.208057-1.59810.05768
10-0.087372-0.67110.252382
110.052780.40540.343321
120.5265564.04467.7e-05
13-0.113197-0.86950.194053
140.1245820.95690.171253
15-0.00924-0.0710.471829
160.0820860.63050.265397
17-0.019614-0.15070.440379
18-0.043212-0.33190.370565
19-0.121598-0.9340.177053
200.1063930.81720.208546
21-0.095905-0.73670.232124
220.0667960.51310.304909
230.0016270.01250.495036
240.0447030.34340.366272
25-0.036018-0.27670.391505
26-0.057713-0.44330.329585
270.04470.34330.36628
28-0.112884-0.86710.194705
29-0.221018-1.69770.047419
30-0.081658-0.62720.266466
310.012290.09440.462554
320.0176790.13580.446223
330.0644230.49480.311274
34-0.025573-0.19640.422473
350.0287560.22090.412976
36-0.111971-0.86010.196617
370.0568980.4370.331837
380.0551540.42360.336682
390.0668210.51330.304844
400.0518570.39830.345914
410.0117660.09040.464147
420.0858060.65910.256202
430.034340.26380.396438
44-0.081756-0.6280.266221
450.0055970.0430.482925
46-0.014124-0.10850.456988
47-0.107663-0.8270.205793
48-0.075666-0.58120.281658


Parameters (Session):
par1 = 48 ; par2 = 1 ; par3 = 1 ; par4 = 0 ; par5 = 12 ; par6 = White Noise ; par7 = 0.95 ;
Parameters (R input):
par1 = 48 ; par2 = 1 ; par3 = 1 ; par4 = 0 ; par5 = 12 ; par6 = White Noise ; par7 = 0.95 ; par8 = ;
R code (references can be found in the software module):
if (par1 == 'Default') {
par1 = 10*log10(length(x))
} else {
par1 <- as.numeric(par1)
}
par2 <- as.numeric(par2)
par3 <- as.numeric(par3)
par4 <- as.numeric(par4)
par5 <- as.numeric(par5)
if (par6 == 'White Noise') par6 <- 'white' else par6 <- 'ma'
par7 <- as.numeric(par7)
if (par8 != '') par8 <- as.numeric(par8)
ox <- x
if (par8 == '') {
if (par2 == 0) {
x <- log(x)
} else {
x <- (x ^ par2 - 1) / par2
}
} else {
x <- log(x,base=par8)
}
if (par3 > 0) x <- diff(x,lag=1,difference=par3)
if (par4 > 0) x <- diff(x,lag=par5,difference=par4)
bitmap(file='picts.png')
op <- par(mfrow=c(2,1))
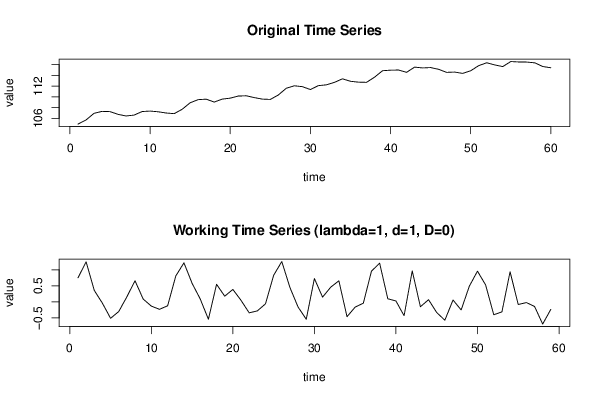
plot(ox,type='l',main='Original Time Series',xlab='time',ylab='value')
if (par8=='') {
mytitle <- paste('Working Time Series (lambda=',par2,', d=',par3,', D=',par4,')',sep='')
mysub <- paste('(lambda=',par2,', d=',par3,', D=',par4,', CI=', par7, ', CI type=',par6,')',sep='')
} else {
mytitle <- paste('Working Time Series (base=',par8,', d=',par3,', D=',par4,')',sep='')
mysub <- paste('(base=',par8,', d=',par3,', D=',par4,', CI=', par7, ', CI type=',par6,')',sep='')
}
plot(x,type='l', main=mytitle,xlab='time',ylab='value')
par(op)
dev.off()
bitmap(file='pic1.png')
racf <- acf(x, par1, main='Autocorrelation', xlab='time lag', ylab='ACF', ci.type=par6, ci=par7, sub=mysub)
dev.off()
bitmap(file='pic2.png')
rpacf <- pacf(x,par1,main='Partial Autocorrelation',xlab='lags',ylab='PACF',sub=mysub)
dev.off()
(myacf <- c(racf$acf))
(mypacf <- c(rpacf$acf))
lengthx <- length(x)
sqrtn <- sqrt(lengthx)
load(file='createtable')
a<-table.start()
a<-table.row.start(a)
a<-table.element(a,'Autocorrelation Function',4,TRUE)
a<-table.row.end(a)
a<-table.row.start(a)
a<-table.element(a,'Time lag k',header=TRUE)
a<-table.element(a,hyperlink('basics.htm','ACF(k)','click here for more information about the Autocorrelation Function'),header=TRUE)
a<-table.element(a,'T-STAT',header=TRUE)
a<-table.element(a,'P-value',header=TRUE)
a<-table.row.end(a)
for (i in 2:(par1+1)) {
a<-table.row.start(a)
a<-table.element(a,i-1,header=TRUE)
a<-table.element(a,round(myacf[i],6))
mytstat <- myacf[i]*sqrtn
a<-table.element(a,round(mytstat,4))
a<-table.element(a,round(1-pt(abs(mytstat),lengthx),6))
a<-table.row.end(a)
}
a<-table.end(a)
table.save(a,file='mytable.tab')
a<-table.start()
a<-table.row.start(a)
a<-table.element(a,'Partial Autocorrelation Function',4,TRUE)
a<-table.row.end(a)
a<-table.row.start(a)
a<-table.element(a,'Time lag k',header=TRUE)
a<-table.element(a,hyperlink('basics.htm','PACF(k)','click here for more information about the Partial Autocorrelation Function'),header=TRUE)
a<-table.element(a,'T-STAT',header=TRUE)
a<-table.element(a,'P-value',header=TRUE)
a<-table.row.end(a)
for (i in 1:par1) {
a<-table.row.start(a)
a<-table.element(a,i,header=TRUE)
a<-table.element(a,round(mypacf[i],6))
mytstat <- mypacf[i]*sqrtn
a<-table.element(a,round(mytstat,4))
a<-table.element(a,round(1-pt(abs(mytstat),lengthx),6))
a<-table.row.end(a)
}
a<-table.end(a)
table.save(a,file='mytable1.tab')