Free Statistics
of Irreproducible Research!
Description of Statistical Computation | |||||||||||||||||||||||||||||||||||||||
|---|---|---|---|---|---|---|---|---|---|---|---|---|---|---|---|---|---|---|---|---|---|---|---|---|---|---|---|---|---|---|---|---|---|---|---|---|---|---|---|
| Author's title | |||||||||||||||||||||||||||||||||||||||
| Author | *The author of this computation has been verified* | ||||||||||||||||||||||||||||||||||||||
| R Software Module | rwasp_fitdistrnorm.wasp | ||||||||||||||||||||||||||||||||||||||
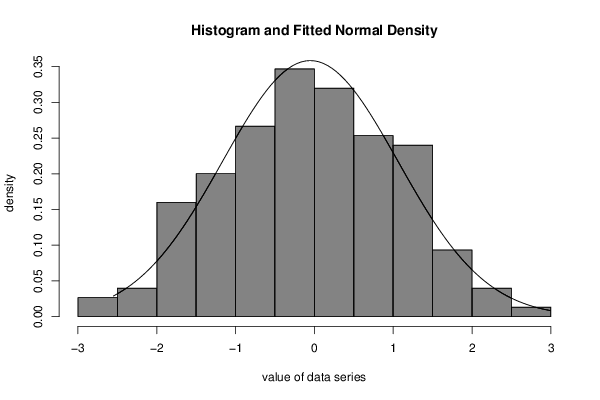
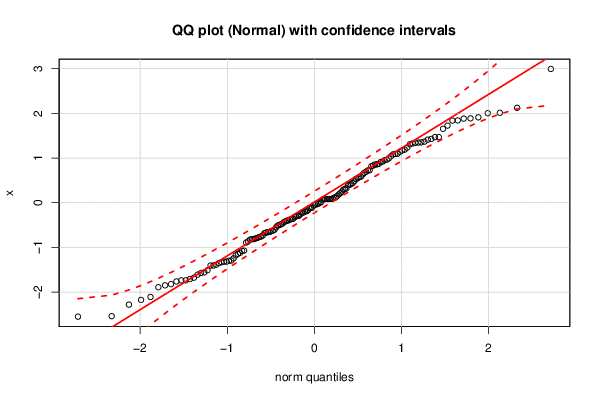
| Title produced by software | ML Fitting and QQ Plot- Normal Distribution | ||||||||||||||||||||||||||||||||||||||
| Date of computation | Thu, 24 Dec 2015 11:52:32 +0000 | ||||||||||||||||||||||||||||||||||||||
| Cite this page as follows | Statistical Computations at FreeStatistics.org, Office for Research Development and Education, URL https://freestatistics.org/blog/index.php?v=date/2015/Dec/24/t1450957965u60l8hzdimdkabt.htm/, Retrieved Sat, 18 May 2024 09:35:10 +0000 | ||||||||||||||||||||||||||||||||||||||
| Statistical Computations at FreeStatistics.org, Office for Research Development and Education, URL https://freestatistics.org/blog/index.php?pk=287048, Retrieved Sat, 18 May 2024 09:35:10 +0000 | |||||||||||||||||||||||||||||||||||||||
| QR Codes: | |||||||||||||||||||||||||||||||||||||||
|
| |||||||||||||||||||||||||||||||||||||||
| Original text written by user: | |||||||||||||||||||||||||||||||||||||||
| IsPrivate? | No (this computation is public) | ||||||||||||||||||||||||||||||||||||||
| User-defined keywords | |||||||||||||||||||||||||||||||||||||||
| Estimated Impact | 133 | ||||||||||||||||||||||||||||||||||||||
Tree of Dependent Computations | |||||||||||||||||||||||||||||||||||||||
| Family? (F = Feedback message, R = changed R code, M = changed R Module, P = changed Parameters, D = changed Data) | |||||||||||||||||||||||||||||||||||||||
| - [ML Fitting and QQ Plot- Normal Distribution] [x] [2015-12-24 11:52:32] [a3c9582f1a47633c0b9d0c2ac629e9ce] [Current] | |||||||||||||||||||||||||||||||||||||||
| Feedback Forum | |||||||||||||||||||||||||||||||||||||||
Post a new message | |||||||||||||||||||||||||||||||||||||||
Dataset | |||||||||||||||||||||||||||||||||||||||
| Dataseries X: | |||||||||||||||||||||||||||||||||||||||
-0.4683235101 0.3006506416 0.07401691761 -0.1744677605 -1.892089081 -0.8932752819 0.9104701002 -0.7325671037 -1.388300888 -0.2226213776 -0.4181712337 1.345382244 1.426802826 0.9904116311 0.4825448792 -1.318277215 -1.301370959 -0.06128305441 -0.1980201327 -0.2188603188 0.6312271648 0.4202471689 0.5323391949 0.0815634957 -1.29383893 1.349855484 0.398481836 -1.573051168 -2.176743855 -0.3069886772 -0.2903948419 0.9619276498 -0.6367784915 -1.178608782 -0.8671959172 -0.5516624748 -0.8278533229 -1.709655423 -1.611494001 2.003624962 1.467874137 1.038234603 0.8677801894 -1.738876396 0.6682461088 0.007653863441 1.171522255 0.9522078927 1.14122665 1.188515464 0.5715140457 1.910321011 -1.123101154 0.08301866015 -0.6066421706 -0.5031215525 0.08133670693 -1.407510296 0.3212862401 -2.550953819 0.6923524303 1.326097677 -0.3751535251 0.1493940052 0.817118386 -0.6685547802 1.307460197 -0.6825759598 1.091663966 0.2470346296 -1.82314203 2.12297379 -0.0377517805 -0.1233916769 1.837388686 0.7214946047 -0.1113937871 0.1853649046 -0.3957957065 0.2112050862 1.469071664 -2.281950165 -0.6606804436 2.0121191 -1.512426238 0.4389214111 -0.7904539193 -1.333050585 -0.1174906864 2.993591523 1.366302428 0.06388594569 -0.3625104118 0.3927412916 0.5472984713 1.081248926 -1.406037134 0.117712211 -0.3999051463 1.654017432 -0.8142890129 -1.352028258 -1.072462195 -1.737767457 1.095221824 1.410454081 -1.144931524 1.841275655 0.8319359791 -1.849223606 0.9199076898 0.1140220745 -0.7676306709 0.7263290051 0.08211535656 -0.6551310442 1.882109561 -1.678758282 0.857525106 -0.484361104 -2.540311255 0.08322452442 -0.6274459197 -1.076641978 0.002329929451 -0.8177168027 1.340886994 -0.8000903276 0.09356965249 0.2913104754 -0.0379637304 -1.246437753 -0.02724534225 -0.5114485545 -0.2582238546 -0.3676269761 -0.4335857589 0.5819449968 1.234452585 -0.190534101 -1.558492901 0.8553387101 -0.2928323799 -2.109814555 -0.3194563991 -1.763419391 1.725839116 -0.7588754375 -1.321417437 1.887484617 | |||||||||||||||||||||||||||||||||||||||
Tables (Output of Computation) | |||||||||||||||||||||||||||||||||||||||
| |||||||||||||||||||||||||||||||||||||||
Figures (Output of Computation) | |||||||||||||||||||||||||||||||||||||||
Input Parameters & R Code | |||||||||||||||||||||||||||||||||||||||
| Parameters (Session): | |||||||||||||||||||||||||||||||||||||||
| par1 = 8 ; par2 = 0 ; | |||||||||||||||||||||||||||||||||||||||
| Parameters (R input): | |||||||||||||||||||||||||||||||||||||||
| par1 = 8 ; par2 = 0 ; | |||||||||||||||||||||||||||||||||||||||
| R code (references can be found in the software module): | |||||||||||||||||||||||||||||||||||||||
par2 <- '0' | |||||||||||||||||||||||||||||||||||||||