Free Statistics

of Irreproducible Research!

Author's title

Author*Unverified author*
R Software Modulerwasp_autocorrelation.wasp
Title produced by software(Partial) Autocorrelation Function
Date of computationTue, 22 Dec 2015 14:20:54 +0000
Cite this page as followsStatistical Computations at FreeStatistics.org, Office for Research Development and Education, URL https://freestatistics.org/blog/index.php?v=date/2015/Dec/22/t1450794098guwmyshe5lwsh51.htm/, Retrieved Sun, 19 May 2024 00:38:53 +0000
Statistical Computations at FreeStatistics.org, Office for Research Development and Education, URL https://freestatistics.org/blog/index.php?pk=287027, Retrieved Sun, 19 May 2024 00:38:53 +0000
QR Codes:

Original text written by user:
IsPrivate?No (this computation is public)
User-defined keywords
Estimated Impact121
Family? (F = Feedback message, R = changed R code, M = changed R Module, P = changed Parameters, D = changed Data)
-       [(Partial) Autocorrelation Function] [Koffie indexprijz...] [2015-12-22 14:20:54] [91f26e786dd8a1c147ebc049dd81fbad] [Current]
Feedback Forum

Post a new message
Dataseries X:
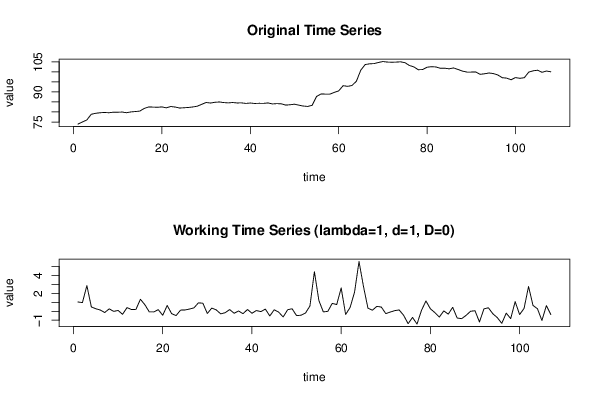
73,97
75,01
75,98
78,85
79,34
79,62
79,76
79,62
79,89
79,88
79,97
79,63
80,04
80,23
80,44
81,78
82,51
82,43
82,35
82,53
82,08
82,73
82,46
81,98
82,11
82,26
82,51
82,89
83,83
84,73
84,48
84,84
84,99
84,7
84,54
84,73
84,51
84,54
84,27
84,47
84,25
84,33
84,29
84,53
84,01
84,18
84,08
83,44
83,61
83,89
83,4
82,96
82,76
83,35
87,78
88,99
88,92
88,91
89,79
90,54
93,15
92,79
93,21
95,35
100,91
103,69
104,04
104,16
104,71
105,18
104,92
104,83
104,9
105,05
104,6
103,21
102,52
101,09
101,19
102,34
102,62
102,47
101,82
101,86
101,54
101,98
101,23
100,4
99,94
99,94
100
98,8
99,07
99,46
99,18
98,47
97,12
96,91
96,09
97,17
96,8
97,13
99,9
100,56
100,84
99,81
100,44
100,07


Summary of computational transaction
Raw Inputview raw input (R code)
Raw Outputview raw output of R engine
Computing time2 seconds
R Server'George Udny Yule' @ yule.wessa.net

\begin{tabular}{lllllllll}
\hline
Summary of computational transaction \tabularnewline
Raw Input & view raw input (R code)  \tabularnewline
Raw Output & view raw output of R engine  \tabularnewline
Computing time & 2 seconds \tabularnewline
R Server & 'George Udny Yule' @ yule.wessa.net \tabularnewline
\hline
\end{tabular}
%Source: https://freestatistics.org/blog/index.php?pk=287027&T=0

[TABLE]
[ROW][C]Summary of computational transaction[/C][/ROW]
[ROW][C]Raw Input[/C][C]view raw input (R code) [/C][/ROW]
[ROW][C]Raw Output[/C][C]view raw output of R engine [/C][/ROW]
[ROW][C]Computing time[/C][C]2 seconds[/C][/ROW]
[ROW][C]R Server[/C][C]'George Udny Yule' @ yule.wessa.net[/C][/ROW]
[/TABLE]
Source: https://freestatistics.org/blog/index.php?pk=287027&T=0

Globally Unique Identifier (entire table): ba.freestatistics.org/blog/index.php?pk=287027&T=0

As an alternative you can also use a QR Code:  

The GUIDs for individual cells are displayed in the table below:

Summary of computational transaction
Raw Inputview raw input (R code)
Raw Outputview raw output of R engine
Computing time2 seconds
R Server'George Udny Yule' @ yule.wessa.net


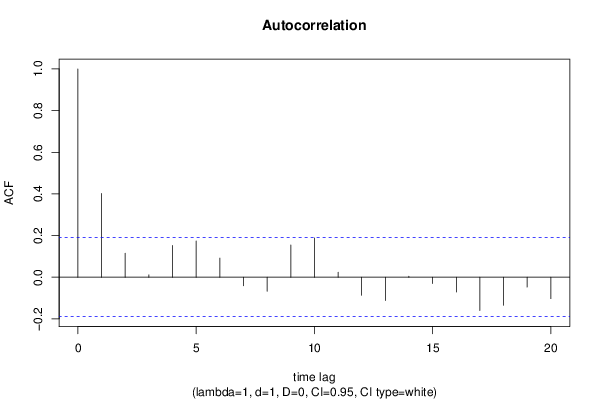
Autocorrelation Function
Time lag kACF(k)T-STATP-value
10.4020574.15893.2e-05
20.1152491.19210.117921
30.0111780.11560.454084
40.1525091.57760.058809
50.1738141.7980.037502
60.091790.94950.172257
7-0.040995-0.42410.336189
8-0.067593-0.69920.242977
90.1548991.60230.05602
100.1883871.94870.026976
110.0234310.24240.404479
12-0.086789-0.89780.185667
13-0.111975-1.15830.124665
140.0046940.04860.48068
15-0.030164-0.3120.377818
16-0.071394-0.73850.230911
17-0.159666-1.65160.050775
18-0.134518-1.39150.083485
19-0.047578-0.49210.311812
20-0.102898-1.06440.144776

\begin{tabular}{lllllllll}
\hline
Autocorrelation Function \tabularnewline
Time lag k & ACF(k) & T-STAT & P-value \tabularnewline
1 & 0.402057 & 4.1589 & 3.2e-05 \tabularnewline
2 & 0.115249 & 1.1921 & 0.117921 \tabularnewline
3 & 0.011178 & 0.1156 & 0.454084 \tabularnewline
4 & 0.152509 & 1.5776 & 0.058809 \tabularnewline
5 & 0.173814 & 1.798 & 0.037502 \tabularnewline
6 & 0.09179 & 0.9495 & 0.172257 \tabularnewline
7 & -0.040995 & -0.4241 & 0.336189 \tabularnewline
8 & -0.067593 & -0.6992 & 0.242977 \tabularnewline
9 & 0.154899 & 1.6023 & 0.05602 \tabularnewline
10 & 0.188387 & 1.9487 & 0.026976 \tabularnewline
11 & 0.023431 & 0.2424 & 0.404479 \tabularnewline
12 & -0.086789 & -0.8978 & 0.185667 \tabularnewline
13 & -0.111975 & -1.1583 & 0.124665 \tabularnewline
14 & 0.004694 & 0.0486 & 0.48068 \tabularnewline
15 & -0.030164 & -0.312 & 0.377818 \tabularnewline
16 & -0.071394 & -0.7385 & 0.230911 \tabularnewline
17 & -0.159666 & -1.6516 & 0.050775 \tabularnewline
18 & -0.134518 & -1.3915 & 0.083485 \tabularnewline
19 & -0.047578 & -0.4921 & 0.311812 \tabularnewline
20 & -0.102898 & -1.0644 & 0.144776 \tabularnewline
\hline
\end{tabular}
%Source: https://freestatistics.org/blog/index.php?pk=287027&T=1

[TABLE]
[ROW][C]Autocorrelation Function[/C][/ROW]
[ROW][C]Time lag k[/C][C]ACF(k)[/C][C]T-STAT[/C][C]P-value[/C][/ROW]
[ROW][C]1[/C][C]0.402057[/C][C]4.1589[/C][C]3.2e-05[/C][/ROW]
[ROW][C]2[/C][C]0.115249[/C][C]1.1921[/C][C]0.117921[/C][/ROW]
[ROW][C]3[/C][C]0.011178[/C][C]0.1156[/C][C]0.454084[/C][/ROW]
[ROW][C]4[/C][C]0.152509[/C][C]1.5776[/C][C]0.058809[/C][/ROW]
[ROW][C]5[/C][C]0.173814[/C][C]1.798[/C][C]0.037502[/C][/ROW]
[ROW][C]6[/C][C]0.09179[/C][C]0.9495[/C][C]0.172257[/C][/ROW]
[ROW][C]7[/C][C]-0.040995[/C][C]-0.4241[/C][C]0.336189[/C][/ROW]
[ROW][C]8[/C][C]-0.067593[/C][C]-0.6992[/C][C]0.242977[/C][/ROW]
[ROW][C]9[/C][C]0.154899[/C][C]1.6023[/C][C]0.05602[/C][/ROW]
[ROW][C]10[/C][C]0.188387[/C][C]1.9487[/C][C]0.026976[/C][/ROW]
[ROW][C]11[/C][C]0.023431[/C][C]0.2424[/C][C]0.404479[/C][/ROW]
[ROW][C]12[/C][C]-0.086789[/C][C]-0.8978[/C][C]0.185667[/C][/ROW]
[ROW][C]13[/C][C]-0.111975[/C][C]-1.1583[/C][C]0.124665[/C][/ROW]
[ROW][C]14[/C][C]0.004694[/C][C]0.0486[/C][C]0.48068[/C][/ROW]
[ROW][C]15[/C][C]-0.030164[/C][C]-0.312[/C][C]0.377818[/C][/ROW]
[ROW][C]16[/C][C]-0.071394[/C][C]-0.7385[/C][C]0.230911[/C][/ROW]
[ROW][C]17[/C][C]-0.159666[/C][C]-1.6516[/C][C]0.050775[/C][/ROW]
[ROW][C]18[/C][C]-0.134518[/C][C]-1.3915[/C][C]0.083485[/C][/ROW]
[ROW][C]19[/C][C]-0.047578[/C][C]-0.4921[/C][C]0.311812[/C][/ROW]
[ROW][C]20[/C][C]-0.102898[/C][C]-1.0644[/C][C]0.144776[/C][/ROW]
[/TABLE]
Source: https://freestatistics.org/blog/index.php?pk=287027&T=1

Globally Unique Identifier (entire table): ba.freestatistics.org/blog/index.php?pk=287027&T=1

As an alternative you can also use a QR Code:  

The GUIDs for individual cells are displayed in the table below:

Autocorrelation Function
Time lag kACF(k)T-STATP-value
10.4020574.15893.2e-05
20.1152491.19210.117921
30.0111780.11560.454084
40.1525091.57760.058809
50.1738141.7980.037502
60.091790.94950.172257
7-0.040995-0.42410.336189
8-0.067593-0.69920.242977
90.1548991.60230.05602
100.1883871.94870.026976
110.0234310.24240.404479
12-0.086789-0.89780.185667
13-0.111975-1.15830.124665
140.0046940.04860.48068
15-0.030164-0.3120.377818
16-0.071394-0.73850.230911
17-0.159666-1.65160.050775
18-0.134518-1.39150.083485
19-0.047578-0.49210.311812
20-0.102898-1.06440.144776


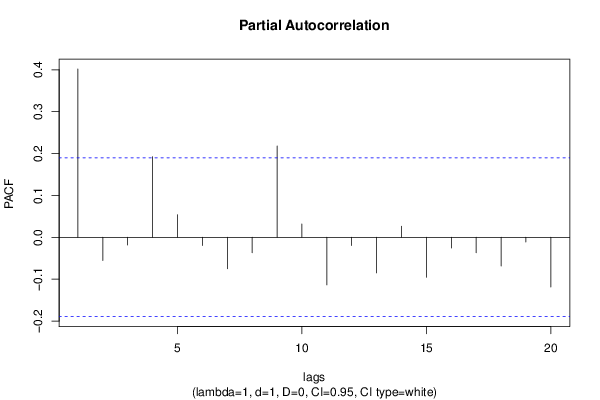
Partial Autocorrelation Function
Time lag kPACF(k)T-STATP-value
10.4020574.15893.2e-05
2-0.055348-0.57250.284083
3-0.01851-0.19150.424261
40.1923331.98950.024599
50.0538570.55710.289312
6-0.019506-0.20180.420241
7-0.074985-0.77570.219833
8-0.037074-0.38350.351057
90.2179792.25480.013091
100.0318880.32990.371077
11-0.113643-1.17550.121195
12-0.019462-0.20130.420419
13-0.084972-0.8790.190698
140.0263680.27280.392785
15-0.09521-0.98490.163458
16-0.025395-0.26270.396647
17-0.036835-0.3810.351972
18-0.068621-0.70980.239681
19-0.011206-0.11590.453968
20-0.118603-1.22680.111288

\begin{tabular}{lllllllll}
\hline
Partial Autocorrelation Function \tabularnewline
Time lag k & PACF(k) & T-STAT & P-value \tabularnewline
1 & 0.402057 & 4.1589 & 3.2e-05 \tabularnewline
2 & -0.055348 & -0.5725 & 0.284083 \tabularnewline
3 & -0.01851 & -0.1915 & 0.424261 \tabularnewline
4 & 0.192333 & 1.9895 & 0.024599 \tabularnewline
5 & 0.053857 & 0.5571 & 0.289312 \tabularnewline
6 & -0.019506 & -0.2018 & 0.420241 \tabularnewline
7 & -0.074985 & -0.7757 & 0.219833 \tabularnewline
8 & -0.037074 & -0.3835 & 0.351057 \tabularnewline
9 & 0.217979 & 2.2548 & 0.013091 \tabularnewline
10 & 0.031888 & 0.3299 & 0.371077 \tabularnewline
11 & -0.113643 & -1.1755 & 0.121195 \tabularnewline
12 & -0.019462 & -0.2013 & 0.420419 \tabularnewline
13 & -0.084972 & -0.879 & 0.190698 \tabularnewline
14 & 0.026368 & 0.2728 & 0.392785 \tabularnewline
15 & -0.09521 & -0.9849 & 0.163458 \tabularnewline
16 & -0.025395 & -0.2627 & 0.396647 \tabularnewline
17 & -0.036835 & -0.381 & 0.351972 \tabularnewline
18 & -0.068621 & -0.7098 & 0.239681 \tabularnewline
19 & -0.011206 & -0.1159 & 0.453968 \tabularnewline
20 & -0.118603 & -1.2268 & 0.111288 \tabularnewline
\hline
\end{tabular}
%Source: https://freestatistics.org/blog/index.php?pk=287027&T=2

[TABLE]
[ROW][C]Partial Autocorrelation Function[/C][/ROW]
[ROW][C]Time lag k[/C][C]PACF(k)[/C][C]T-STAT[/C][C]P-value[/C][/ROW]
[ROW][C]1[/C][C]0.402057[/C][C]4.1589[/C][C]3.2e-05[/C][/ROW]
[ROW][C]2[/C][C]-0.055348[/C][C]-0.5725[/C][C]0.284083[/C][/ROW]
[ROW][C]3[/C][C]-0.01851[/C][C]-0.1915[/C][C]0.424261[/C][/ROW]
[ROW][C]4[/C][C]0.192333[/C][C]1.9895[/C][C]0.024599[/C][/ROW]
[ROW][C]5[/C][C]0.053857[/C][C]0.5571[/C][C]0.289312[/C][/ROW]
[ROW][C]6[/C][C]-0.019506[/C][C]-0.2018[/C][C]0.420241[/C][/ROW]
[ROW][C]7[/C][C]-0.074985[/C][C]-0.7757[/C][C]0.219833[/C][/ROW]
[ROW][C]8[/C][C]-0.037074[/C][C]-0.3835[/C][C]0.351057[/C][/ROW]
[ROW][C]9[/C][C]0.217979[/C][C]2.2548[/C][C]0.013091[/C][/ROW]
[ROW][C]10[/C][C]0.031888[/C][C]0.3299[/C][C]0.371077[/C][/ROW]
[ROW][C]11[/C][C]-0.113643[/C][C]-1.1755[/C][C]0.121195[/C][/ROW]
[ROW][C]12[/C][C]-0.019462[/C][C]-0.2013[/C][C]0.420419[/C][/ROW]
[ROW][C]13[/C][C]-0.084972[/C][C]-0.879[/C][C]0.190698[/C][/ROW]
[ROW][C]14[/C][C]0.026368[/C][C]0.2728[/C][C]0.392785[/C][/ROW]
[ROW][C]15[/C][C]-0.09521[/C][C]-0.9849[/C][C]0.163458[/C][/ROW]
[ROW][C]16[/C][C]-0.025395[/C][C]-0.2627[/C][C]0.396647[/C][/ROW]
[ROW][C]17[/C][C]-0.036835[/C][C]-0.381[/C][C]0.351972[/C][/ROW]
[ROW][C]18[/C][C]-0.068621[/C][C]-0.7098[/C][C]0.239681[/C][/ROW]
[ROW][C]19[/C][C]-0.011206[/C][C]-0.1159[/C][C]0.453968[/C][/ROW]
[ROW][C]20[/C][C]-0.118603[/C][C]-1.2268[/C][C]0.111288[/C][/ROW]
[/TABLE]
Source: https://freestatistics.org/blog/index.php?pk=287027&T=2

Globally Unique Identifier (entire table): ba.freestatistics.org/blog/index.php?pk=287027&T=2

As an alternative you can also use a QR Code:  

The GUIDs for individual cells are displayed in the table below:

Partial Autocorrelation Function
Time lag kPACF(k)T-STATP-value
10.4020574.15893.2e-05
2-0.055348-0.57250.284083
3-0.01851-0.19150.424261
40.1923331.98950.024599
50.0538570.55710.289312
6-0.019506-0.20180.420241
7-0.074985-0.77570.219833
8-0.037074-0.38350.351057
90.2179792.25480.013091
100.0318880.32990.371077
11-0.113643-1.17550.121195
12-0.019462-0.20130.420419
13-0.084972-0.8790.190698
140.0263680.27280.392785
15-0.09521-0.98490.163458
16-0.025395-0.26270.396647
17-0.036835-0.3810.351972
18-0.068621-0.70980.239681
19-0.011206-0.11590.453968
20-0.118603-1.22680.111288


Parameters (Session):
par1 = Default ; par2 = 1 ; par3 = 1 ; par4 = 0 ; par5 = 12 ; par6 = White Noise ; par7 = 0.95 ;
Parameters (R input):
par1 = Default ; par2 = 1 ; par3 = 1 ; par4 = 0 ; par5 = 12 ; par6 = White Noise ; par7 = 0.95 ; par8 = ;
R code (references can be found in the software module):
if (par1 == 'Default') {
par1 = 10*log10(length(x))
} else {
par1 <- as.numeric(par1)
}
par2 <- as.numeric(par2)
par3 <- as.numeric(par3)
par4 <- as.numeric(par4)
par5 <- as.numeric(par5)
if (par6 == 'White Noise') par6 <- 'white' else par6 <- 'ma'
par7 <- as.numeric(par7)
if (par8 != '') par8 <- as.numeric(par8)
x <- na.omit(x)
ox <- x
if (par8 == '') {
if (par2 == 0) {
x <- log(x)
} else {
x <- (x ^ par2 - 1) / par2
}
} else {
x <- log(x,base=par8)
}
if (par3 > 0) x <- diff(x,lag=1,difference=par3)
if (par4 > 0) x <- diff(x,lag=par5,difference=par4)
bitmap(file='picts.png')
op <- par(mfrow=c(2,1))
plot(ox,type='l',main='Original Time Series',xlab='time',ylab='value')
if (par8=='') {
mytitle <- paste('Working Time Series (lambda=',par2,', d=',par3,', D=',par4,')',sep='')
mysub <- paste('(lambda=',par2,', d=',par3,', D=',par4,', CI=', par7, ', CI type=',par6,')',sep='')
} else {
mytitle <- paste('Working Time Series (base=',par8,', d=',par3,', D=',par4,')',sep='')
mysub <- paste('(base=',par8,', d=',par3,', D=',par4,', CI=', par7, ', CI type=',par6,')',sep='')
}
plot(x,type='l', main=mytitle,xlab='time',ylab='value')
par(op)
dev.off()
bitmap(file='pic1.png')
racf <- acf(x, par1, main='Autocorrelation', xlab='time lag', ylab='ACF', ci.type=par6, ci=par7, sub=mysub)
dev.off()
bitmap(file='pic2.png')
rpacf <- pacf(x,par1,main='Partial Autocorrelation',xlab='lags',ylab='PACF',sub=mysub)
dev.off()
(myacf <- c(racf$acf))
(mypacf <- c(rpacf$acf))
lengthx <- length(x)
sqrtn <- sqrt(lengthx)
load(file='createtable')
a<-table.start()
a<-table.row.start(a)
a<-table.element(a,'Autocorrelation Function',4,TRUE)
a<-table.row.end(a)
a<-table.row.start(a)
a<-table.element(a,'Time lag k',header=TRUE)
a<-table.element(a,hyperlink('basics.htm','ACF(k)','click here for more information about the Autocorrelation Function'),header=TRUE)
a<-table.element(a,'T-STAT',header=TRUE)
a<-table.element(a,'P-value',header=TRUE)
a<-table.row.end(a)
for (i in 2:(par1+1)) {
a<-table.row.start(a)
a<-table.element(a,i-1,header=TRUE)
a<-table.element(a,round(myacf[i],6))
mytstat <- myacf[i]*sqrtn
a<-table.element(a,round(mytstat,4))
a<-table.element(a,round(1-pt(abs(mytstat),lengthx),6))
a<-table.row.end(a)
}
a<-table.end(a)
table.save(a,file='mytable.tab')
a<-table.start()
a<-table.row.start(a)
a<-table.element(a,'Partial Autocorrelation Function',4,TRUE)
a<-table.row.end(a)
a<-table.row.start(a)
a<-table.element(a,'Time lag k',header=TRUE)
a<-table.element(a,hyperlink('basics.htm','PACF(k)','click here for more information about the Partial Autocorrelation Function'),header=TRUE)
a<-table.element(a,'T-STAT',header=TRUE)
a<-table.element(a,'P-value',header=TRUE)
a<-table.row.end(a)
for (i in 1:par1) {
a<-table.row.start(a)
a<-table.element(a,i,header=TRUE)
a<-table.element(a,round(mypacf[i],6))
mytstat <- mypacf[i]*sqrtn
a<-table.element(a,round(mytstat,4))
a<-table.element(a,round(1-pt(abs(mytstat),lengthx),6))
a<-table.row.end(a)
}
a<-table.end(a)
table.save(a,file='mytable1.tab')