Free Statistics

of Irreproducible Research!

Author's title

Author*The author of this computation has been verified*
R Software Modulerwasp_correlation.wasp
Title produced by softwarePearson Correlation
Date of computationFri, 18 Dec 2015 12:35:41 +0000
Cite this page as followsStatistical Computations at FreeStatistics.org, Office for Research Development and Education, URL https://freestatistics.org/blog/index.php?v=date/2015/Dec/18/t14504421885045q31v30km3nz.htm/, Retrieved Sat, 18 May 2024 14:49:27 +0000
Statistical Computations at FreeStatistics.org, Office for Research Development and Education, URL https://freestatistics.org/blog/index.php?pk=286885, Retrieved Sat, 18 May 2024 14:49:27 +0000
QR Codes:

Original text written by user:
IsPrivate?No (this computation is public)
User-defined keywords
Estimated Impact115
Family? (F = Feedback message, R = changed R code, M = changed R Module, P = changed Parameters, D = changed Data)
-       [Pearson Correlation] [Pearson correlati...] [2015-12-18 12:35:41] [3fd5ab1060e3487adfc241d011cb6ba1] [Current]
Feedback Forum

Post a new message
Dataseries X:
119920
112454
109415
109843
106365
102304
97968
92462
92286
120092
126656
124144
114045
108120
105698
111203
110030
104009
99772
96301
97680
121563
134210
133111
124527
117589
115699
117830
115874
111267
107985
102185
102101
128932
135782
136971
126292
119260
117359
119818
116059
110046
104100
97981
97527
123700
129678
130790
120961
114232
110518
110959
108443
103977
97126
90860
91959
113735
119713
121905
112442
Dataseries Y:
563668
548604
551174
555654
547970
540324
530577
520579
518654
572273
581302
563280
547612
538712
540735
561649
558685
545732
536352
527676
530455
581744
598714
583775
571477
563278
564872
577537
572399
565430
560619
551227
553397
610893
621668
613148
598778
590623
595902
612186
603453
593362
581940
568075
567467
619423
627325
617144
602280
590816
589812
600615
595729
586958
567705
551407
554324
595557
602467
587774
572107


Summary of computational transaction
Raw Inputview raw input (R code)
Raw Outputview raw output of R engine
Computing time3 seconds
R Server'Sir Ronald Aylmer Fisher' @ fisher.wessa.net

\begin{tabular}{lllllllll}
\hline
Summary of computational transaction \tabularnewline
Raw Input & view raw input (R code)  \tabularnewline
Raw Output & view raw output of R engine  \tabularnewline
Computing time & 3 seconds \tabularnewline
R Server & 'Sir Ronald Aylmer Fisher' @ fisher.wessa.net \tabularnewline
\hline
\end{tabular}
%Source: https://freestatistics.org/blog/index.php?pk=286885&T=0

[TABLE]
[ROW][C]Summary of computational transaction[/C][/ROW]
[ROW][C]Raw Input[/C][C]view raw input (R code) [/C][/ROW]
[ROW][C]Raw Output[/C][C]view raw output of R engine [/C][/ROW]
[ROW][C]Computing time[/C][C]3 seconds[/C][/ROW]
[ROW][C]R Server[/C][C]'Sir Ronald Aylmer Fisher' @ fisher.wessa.net[/C][/ROW]
[/TABLE]
Source: https://freestatistics.org/blog/index.php?pk=286885&T=0

Globally Unique Identifier (entire table): ba.freestatistics.org/blog/index.php?pk=286885&T=0

As an alternative you can also use a QR Code:  

The GUIDs for individual cells are displayed in the table below:

Summary of computational transaction
Raw Inputview raw input (R code)
Raw Outputview raw output of R engine
Computing time3 seconds
R Server'Sir Ronald Aylmer Fisher' @ fisher.wessa.net


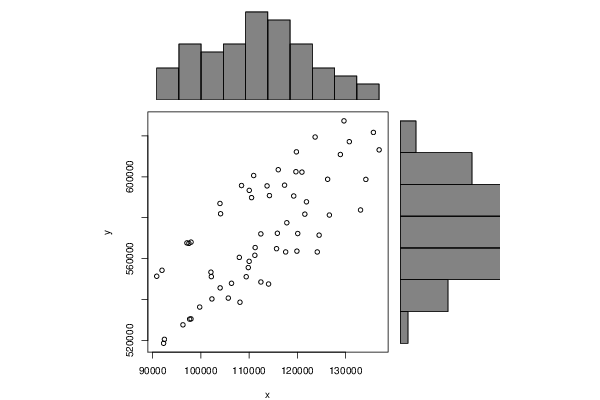
Pearson Product Moment Correlation - Ungrouped Data
StatisticVariable XVariable Y
Mean112718.573770492572870.06557377
Biased Variance135969431.883902728265646.684225
Biased Standard Deviation11660.593118872726986.3974380469
Covariance238920351.778415
Correlation0.746808078683118
Determination0.557722306386371
T-Test8.62556386434114
p-value (2 sided)4.83035833553913e-12
p-value (1 sided)2.41517916776957e-12
95% CI of Correlation[0.609636689934766, 0.840552948845386]
Degrees of Freedom59
Number of Observations61

\begin{tabular}{lllllllll}
\hline
Pearson Product Moment Correlation - Ungrouped Data \tabularnewline
Statistic & Variable X & Variable Y \tabularnewline
Mean & 112718.573770492 & 572870.06557377 \tabularnewline
Biased Variance & 135969431.883902 & 728265646.684225 \tabularnewline
Biased Standard Deviation & 11660.5931188727 & 26986.3974380469 \tabularnewline
Covariance & 238920351.778415 \tabularnewline
Correlation & 0.746808078683118 \tabularnewline
Determination & 0.557722306386371 \tabularnewline
T-Test & 8.62556386434114 \tabularnewline
p-value (2 sided) & 4.83035833553913e-12 \tabularnewline
p-value (1 sided) & 2.41517916776957e-12 \tabularnewline
95% CI of Correlation & [0.609636689934766, 0.840552948845386] \tabularnewline
Degrees of Freedom & 59 \tabularnewline
Number of Observations & 61 \tabularnewline
\hline
\end{tabular}
%Source: https://freestatistics.org/blog/index.php?pk=286885&T=1

[TABLE]
[ROW][C]Pearson Product Moment Correlation - Ungrouped Data[/C][/ROW]
[ROW][C]Statistic[/C][C]Variable X[/C][C]Variable Y[/C][/ROW]
[ROW][C]Mean[/C][C]112718.573770492[/C][C]572870.06557377[/C][/ROW]
[ROW][C]Biased Variance[/C][C]135969431.883902[/C][C]728265646.684225[/C][/ROW]
[ROW][C]Biased Standard Deviation[/C][C]11660.5931188727[/C][C]26986.3974380469[/C][/ROW]
[ROW][C]Covariance[/C][C]238920351.778415[/C][/ROW]
[ROW][C]Correlation[/C][C]0.746808078683118[/C][/ROW]
[ROW][C]Determination[/C][C]0.557722306386371[/C][/ROW]
[ROW][C]T-Test[/C][C]8.62556386434114[/C][/ROW]
[ROW][C]p-value (2 sided)[/C][C]4.83035833553913e-12[/C][/ROW]
[ROW][C]p-value (1 sided)[/C][C]2.41517916776957e-12[/C][/ROW]
[ROW][C]95% CI of Correlation[/C][C][0.609636689934766, 0.840552948845386][/C][/ROW]
[ROW][C]Degrees of Freedom[/C][C]59[/C][/ROW]
[ROW][C]Number of Observations[/C][C]61[/C][/ROW]
[/TABLE]
Source: https://freestatistics.org/blog/index.php?pk=286885&T=1

Globally Unique Identifier (entire table): ba.freestatistics.org/blog/index.php?pk=286885&T=1

As an alternative you can also use a QR Code:  

The GUIDs for individual cells are displayed in the table below:

Pearson Product Moment Correlation - Ungrouped Data
StatisticVariable XVariable Y
Mean112718.573770492572870.06557377
Biased Variance135969431.883902728265646.684225
Biased Standard Deviation11660.593118872726986.3974380469
Covariance238920351.778415
Correlation0.746808078683118
Determination0.557722306386371
T-Test8.62556386434114
p-value (2 sided)4.83035833553913e-12
p-value (1 sided)2.41517916776957e-12
95% CI of Correlation[0.609636689934766, 0.840552948845386]
Degrees of Freedom59
Number of Observations61


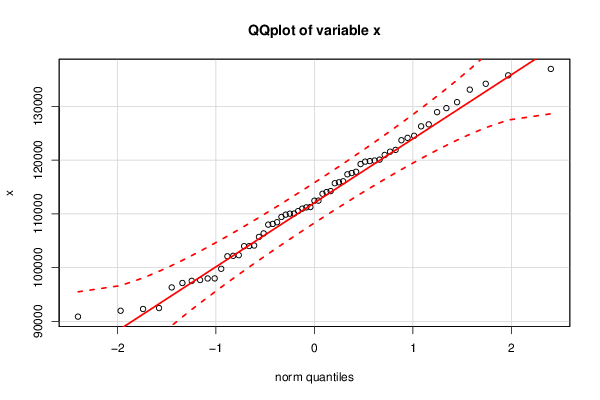
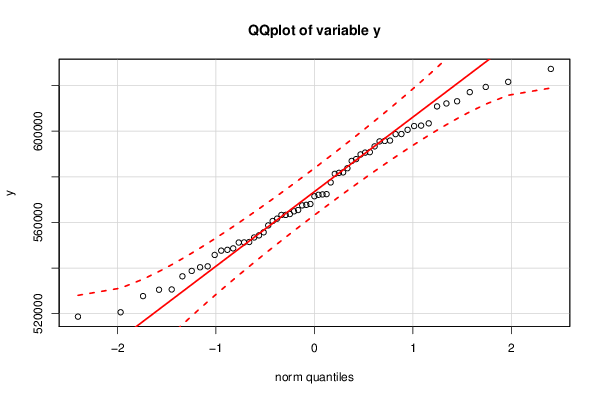
Normality Tests
> jarque.x
	Jarque-Bera Normality Test
data:  x
JB = 1.2753, p-value = 0.5285
alternative hypothesis: greater
> jarque.y
	Jarque-Bera Normality Test
data:  y
JB = 1.7502, p-value = 0.4168
alternative hypothesis: greater
> ad.x
	Anderson-Darling normality test
data:  x
A = 0.19412, p-value = 0.8891
> ad.y
	Anderson-Darling normality test
data:  y
A = 0.29327, p-value = 0.5911

\begin{tabular}{lllllllll}
\hline
Normality Tests \tabularnewline
> jarque.x
	Jarque-Bera Normality Test
data:  x
JB = 1.2753, p-value = 0.5285
alternative hypothesis: greater
\tabularnewline
> jarque.y
	Jarque-Bera Normality Test
data:  y
JB = 1.7502, p-value = 0.4168
alternative hypothesis: greater
\tabularnewline
> ad.x
	Anderson-Darling normality test
data:  x
A = 0.19412, p-value = 0.8891
\tabularnewline
> ad.y
	Anderson-Darling normality test
data:  y
A = 0.29327, p-value = 0.5911
\tabularnewline \hline \end{tabular} %Source: https://freestatistics.org/blog/index.php?pk=286885&T=2

[TABLE]
[ROW][C]Normality Tests[/C][/ROW]
[ROW][C]
> jarque.x
	Jarque-Bera Normality Test
data:  x
JB = 1.2753, p-value = 0.5285
alternative hypothesis: greater
[/C][/ROW] [ROW][C]
> jarque.y
	Jarque-Bera Normality Test
data:  y
JB = 1.7502, p-value = 0.4168
alternative hypothesis: greater
[/C][/ROW] [ROW][C]
> ad.x
	Anderson-Darling normality test
data:  x
A = 0.19412, p-value = 0.8891
[/C][/ROW] [ROW][C]
> ad.y
	Anderson-Darling normality test
data:  y
A = 0.29327, p-value = 0.5911
[/C][/ROW] [/TABLE] Source: https://freestatistics.org/blog/index.php?pk=286885&T=2

Globally Unique Identifier (entire table): ba.freestatistics.org/blog/index.php?pk=286885&T=2

As an alternative you can also use a QR Code:  

The GUIDs for individual cells are displayed in the table below:

Normality Tests
> jarque.x
	Jarque-Bera Normality Test
data:  x
JB = 1.2753, p-value = 0.5285
alternative hypothesis: greater
> jarque.y
	Jarque-Bera Normality Test
data:  y
JB = 1.7502, p-value = 0.4168
alternative hypothesis: greater
> ad.x
	Anderson-Darling normality test
data:  x
A = 0.19412, p-value = 0.8891
> ad.y
	Anderson-Darling normality test
data:  y
A = 0.29327, p-value = 0.5911


Parameters (Session):
Parameters (R input):
R code (references can be found in the software module):
library(psychometric)
x <- x[!is.na(y)]
y <- y[!is.na(y)]
y <- y[!is.na(x)]
x <- x[!is.na(x)]
bitmap(file='test1.png')
histx <- hist(x, plot=FALSE)
histy <- hist(y, plot=FALSE)
maxcounts <- max(c(histx$counts, histx$counts))
xrange <- c(min(x),max(x))
yrange <- c(min(y),max(y))
nf <- layout(matrix(c(2,0,1,3),2,2,byrow=TRUE), c(3,1), c(1,3), TRUE)
par(mar=c(4,4,1,1))
plot(x, y, xlim=xrange, ylim=yrange, xlab=xlab, ylab=ylab, sub=main)
par(mar=c(0,4,1,1))
barplot(histx$counts, axes=FALSE, ylim=c(0, maxcounts), space=0)
par(mar=c(4,0,1,1))
barplot(histy$counts, axes=FALSE, xlim=c(0, maxcounts), space=0, horiz=TRUE)
dev.off()
lx = length(x)
makebiased = (lx-1)/lx
varx = var(x)*makebiased
vary = var(y)*makebiased
corxy <- cor.test(x,y,method='pearson', na.rm = T)
cxy <- as.matrix(corxy$estimate)[1,1]
load(file='createtable')
a<-table.start()
a<-table.row.start(a)
a<-table.element(a,'Pearson Product Moment Correlation - Ungrouped Data',3,TRUE)
a<-table.row.end(a)
a<-table.row.start(a)
a<-table.element(a,'Statistic',1,TRUE)
a<-table.element(a,'Variable X',1,TRUE)
a<-table.element(a,'Variable Y',1,TRUE)
a<-table.row.end(a)
a<-table.row.start(a)
a<-table.element(a,hyperlink('arithmetic_mean.htm','Mean',''),header=TRUE)
a<-table.element(a,mean(x))
a<-table.element(a,mean(y))
a<-table.row.end(a)
a<-table.row.start(a)
a<-table.element(a,hyperlink('biased.htm','Biased Variance',''),header=TRUE)
a<-table.element(a,varx)
a<-table.element(a,vary)
a<-table.row.end(a)
a<-table.row.start(a)
a<-table.element(a,hyperlink('biased1.htm','Biased Standard Deviation',''),header=TRUE)
a<-table.element(a,sqrt(varx))
a<-table.element(a,sqrt(vary))
a<-table.row.end(a)
a<-table.row.start(a)
a<-table.element(a,hyperlink('covariance.htm','Covariance',''),header=TRUE)
a<-table.element(a,cov(x,y),2)
a<-table.row.end(a)
a<-table.row.start(a)
a<-table.element(a,hyperlink('pearson_correlation.htm','Correlation',''),header=TRUE)
a<-table.element(a,cxy,2)
a<-table.row.end(a)
a<-table.row.start(a)
a<-table.element(a,hyperlink('coeff_of_determination.htm','Determination',''),header=TRUE)
a<-table.element(a,cxy*cxy,2)
a<-table.row.end(a)
a<-table.row.start(a)
a<-table.element(a,hyperlink('ttest_statistic.htm','T-Test',''),header=TRUE)
a<-table.element(a,as.matrix(corxy$statistic)[1,1],2)
a<-table.row.end(a)
a<-table.row.start(a)
a<-table.element(a,'p-value (2 sided)',header=TRUE)
a<-table.element(a,(p2 <- as.matrix(corxy$p.value)[1,1]),2)
a<-table.row.end(a)
a<-table.row.start(a)
a<-table.element(a,'p-value (1 sided)',header=TRUE)
a<-table.element(a,p2/2,2)
a<-table.row.end(a)
a<-table.row.start(a)
a<-table.element(a,'95% CI of Correlation',header=TRUE)
a<-table.element(a,paste('[',CIr(r=cxy, n = lx, level = .95)[1],', ', CIr(r=cxy, n = lx, level = .95)[2],']',sep=''),2)
a<-table.row.end(a)
a<-table.row.start(a)
a<-table.element(a,'Degrees of Freedom',header=TRUE)
a<-table.element(a,lx-2,2)
a<-table.row.end(a)
a<-table.row.start(a)
a<-table.element(a,'Number of Observations',header=TRUE)
a<-table.element(a,lx,2)
a<-table.row.end(a)
a<-table.end(a)
table.save(a,file='mytable.tab')
library(moments)
library(nortest)
jarque.x <- jarque.test(x)
jarque.y <- jarque.test(y)
if(lx>7) {
ad.x <- ad.test(x)
ad.y <- ad.test(y)
}
a<-table.start()
a<-table.row.start(a)
a<-table.element(a,'Normality Tests',1,TRUE)
a<-table.row.end(a)
a<-table.row.start(a)
a<-table.element(a,paste('
',RC.texteval('jarque.x'),'
',sep=''))
a<-table.row.end(a)
a<-table.row.start(a)
a<-table.element(a,paste('
',RC.texteval('jarque.y'),'
',sep=''))
a<-table.row.end(a)
if(lx>7) {
a<-table.row.start(a)
a<-table.element(a,paste('
',RC.texteval('ad.x'),'
',sep=''))
a<-table.row.end(a)
a<-table.row.start(a)
a<-table.element(a,paste('
',RC.texteval('ad.y'),'
',sep=''))
a<-table.row.end(a)
}
a<-table.end(a)
table.save(a,file='mytable1.tab')
library(car)
bitmap(file='test2.png')
qq.plot(x,main='QQplot of variable x')
dev.off()
bitmap(file='test3.png')
qq.plot(y,main='QQplot of variable y')
dev.off()