Free Statistics
of Irreproducible Research!
Description of Statistical Computation | |||||||||||||||||||||||||||||||||||||||
|---|---|---|---|---|---|---|---|---|---|---|---|---|---|---|---|---|---|---|---|---|---|---|---|---|---|---|---|---|---|---|---|---|---|---|---|---|---|---|---|
| Author's title | |||||||||||||||||||||||||||||||||||||||
| Author | *The author of this computation has been verified* | ||||||||||||||||||||||||||||||||||||||
| R Software Module | rwasp_fitdistrnorm.wasp | ||||||||||||||||||||||||||||||||||||||
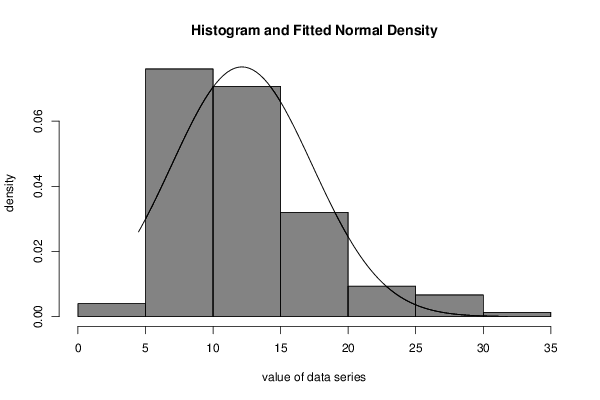
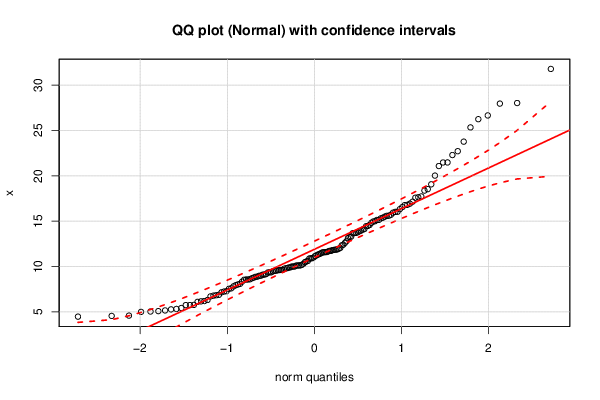
| Title produced by software | ML Fitting and QQ Plot- Normal Distribution | ||||||||||||||||||||||||||||||||||||||
| Date of computation | Tue, 15 Dec 2015 19:23:18 +0000 | ||||||||||||||||||||||||||||||||||||||
| Cite this page as follows | Statistical Computations at FreeStatistics.org, Office for Research Development and Education, URL https://freestatistics.org/blog/index.php?v=date/2015/Dec/15/t14502074694z4s551mp7020bx.htm/, Retrieved Sat, 18 May 2024 15:19:17 +0000 | ||||||||||||||||||||||||||||||||||||||
| Statistical Computations at FreeStatistics.org, Office for Research Development and Education, URL https://freestatistics.org/blog/index.php?pk=286574, Retrieved Sat, 18 May 2024 15:19:17 +0000 | |||||||||||||||||||||||||||||||||||||||
| QR Codes: | |||||||||||||||||||||||||||||||||||||||
|
| |||||||||||||||||||||||||||||||||||||||
| Original text written by user: | |||||||||||||||||||||||||||||||||||||||
| IsPrivate? | No (this computation is public) | ||||||||||||||||||||||||||||||||||||||
| User-defined keywords | |||||||||||||||||||||||||||||||||||||||
| Estimated Impact | 75 | ||||||||||||||||||||||||||||||||||||||
Tree of Dependent Computations | |||||||||||||||||||||||||||||||||||||||
| Family? (F = Feedback message, R = changed R code, M = changed R Module, P = changed Parameters, D = changed Data) | |||||||||||||||||||||||||||||||||||||||
| - [ML Fitting and QQ Plot- Normal Distribution] [Ch3-Task 4] [2015-12-15 19:23:18] [c7d580dabf700704a3d6c2773d62a8e4] [Current] | |||||||||||||||||||||||||||||||||||||||
| Feedback Forum | |||||||||||||||||||||||||||||||||||||||
Post a new message | |||||||||||||||||||||||||||||||||||||||
Dataset | |||||||||||||||||||||||||||||||||||||||
| Dataseries X: | |||||||||||||||||||||||||||||||||||||||
10.61611368 5.773520964 5.435468012 5.004518301 11.16772912 16.77314471 22.29310685 10.00832407 12.05655816 11.8424823 6.169754177 7.547282607 14.07685145 5.28382663 14.96433025 9.806885599 11.8906803 10.49426639 10.10284765 13.96319894 8.89191318 26.2442125 17.14985534 15.13469758 5.166794544 20.02708327 12.41173885 11.57815459 9.177076706 27.9603107 16.02501493 8.784850908 16.93166942 9.347431333 10.12121408 10.12692262 11.8654581 16.80107549 10.5620948 8.571286351 10.90863991 11.9618082 18.37478511 16.04334642 4.482123468 9.52997116 8.604336723 13.29770689 11.73478967 10.29672477 18.5331357 28.02550185 15.60088434 12.60550767 5.090117237 16.33190188 22.71702971 9.995660779 4.598520695 9.88902864 10.14286822 21.08280773 7.824131584 25.33718073 17.64001004 7.247846121 12.34126855 13.89037932 11.00075534 6.113769662 9.614310077 13.28011599 15.59235291 15.7114576 13.14177796 8.027229026 15.49577684 11.47622212 9.542594866 9.477120902 13.69043773 8.33817871 17.72886044 13.71072553 15.37478977 11.24223497 11.56521439 8.873751581 8.08847997 6.844212534 8.982303719 31.78050585 11.38850367 9.369709723 11.82421173 9.117101366 5.332529081 8.579745331 9.001707792 9.62461563 13.78259713 8.717333655 9.90615726 15.94263146 7.286104985 8.545388091 15.30910573 9.367374467 4.563804189 19.06948435 14.44752663 6.717587033 9.604492487 11.32798844 5.760717547 10.0036697 10.9252562 7.604866672 9.106437854 23.76867397 10.88838227 6.793605049 11.73813002 11.60512197 5.757851231 6.201616162 16.55338963 26.65573451 7.166237678 21.47319876 10.2032619 11.59229594 14.1339905 9.818400203 9.745122775 17.59019602 14.47728425 13.68280254 5.047200916 15.00059576 21.47726673 14.82000472 6.890420996 15.14415264 7.947405154 12.7864518 6.322144045 11.67799358 14.57893948 9.62530019 | |||||||||||||||||||||||||||||||||||||||
Tables (Output of Computation) | |||||||||||||||||||||||||||||||||||||||
| |||||||||||||||||||||||||||||||||||||||
Figures (Output of Computation) | |||||||||||||||||||||||||||||||||||||||
Input Parameters & R Code | |||||||||||||||||||||||||||||||||||||||
| Parameters (Session): | |||||||||||||||||||||||||||||||||||||||
| par1 = 8 ; par2 = 0 ; | |||||||||||||||||||||||||||||||||||||||
| Parameters (R input): | |||||||||||||||||||||||||||||||||||||||
| par1 = 8 ; par2 = 0 ; | |||||||||||||||||||||||||||||||||||||||
| R code (references can be found in the software module): | |||||||||||||||||||||||||||||||||||||||
library(MASS) | |||||||||||||||||||||||||||||||||||||||