Free Statistics
of Irreproducible Research!
Description of Statistical Computation | |||||||||||||||||||||||||||||||||||||||
|---|---|---|---|---|---|---|---|---|---|---|---|---|---|---|---|---|---|---|---|---|---|---|---|---|---|---|---|---|---|---|---|---|---|---|---|---|---|---|---|
| Author's title | |||||||||||||||||||||||||||||||||||||||
| Author | *The author of this computation has been verified* | ||||||||||||||||||||||||||||||||||||||
| R Software Module | rwasp_fitdistrnorm.wasp | ||||||||||||||||||||||||||||||||||||||
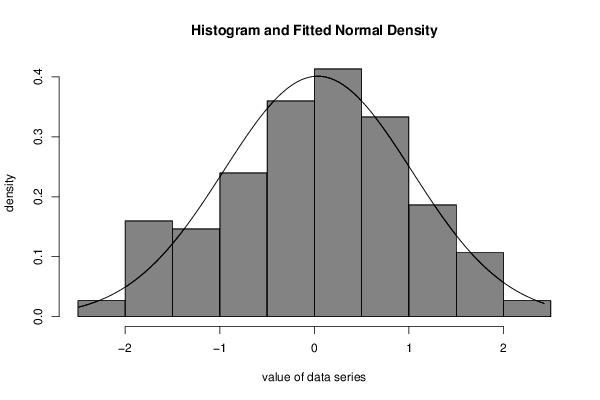
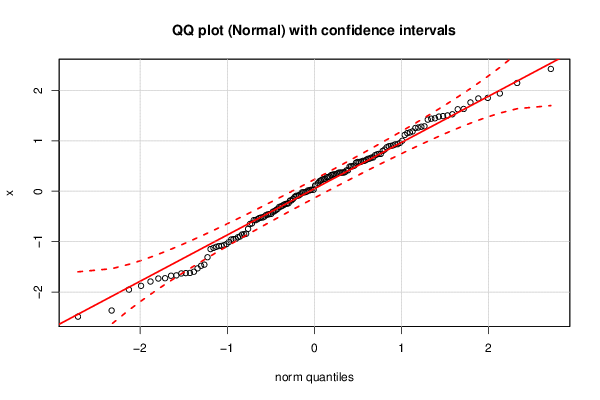
| Title produced by software | ML Fitting and QQ Plot- Normal Distribution | ||||||||||||||||||||||||||||||||||||||
| Date of computation | Tue, 15 Dec 2015 17:35:11 +0000 | ||||||||||||||||||||||||||||||||||||||
| Cite this page as follows | Statistical Computations at FreeStatistics.org, Office for Research Development and Education, URL https://freestatistics.org/blog/index.php?v=date/2015/Dec/15/t1450201152exmqn9n4ib0ulyd.htm/, Retrieved Sat, 18 May 2024 13:56:02 +0000 | ||||||||||||||||||||||||||||||||||||||
| Statistical Computations at FreeStatistics.org, Office for Research Development and Education, URL https://freestatistics.org/blog/index.php?pk=286542, Retrieved Sat, 18 May 2024 13:56:02 +0000 | |||||||||||||||||||||||||||||||||||||||
| QR Codes: | |||||||||||||||||||||||||||||||||||||||
|
| |||||||||||||||||||||||||||||||||||||||
| Original text written by user: | |||||||||||||||||||||||||||||||||||||||
| IsPrivate? | No (this computation is public) | ||||||||||||||||||||||||||||||||||||||
| User-defined keywords | |||||||||||||||||||||||||||||||||||||||
| Estimated Impact | 68 | ||||||||||||||||||||||||||||||||||||||
Tree of Dependent Computations | |||||||||||||||||||||||||||||||||||||||
| Family? (F = Feedback message, R = changed R code, M = changed R Module, P = changed Parameters, D = changed Data) | |||||||||||||||||||||||||||||||||||||||
| - [ML Fitting and QQ Plot- Normal Distribution] [] [2015-12-15 17:35:11] [c7d580dabf700704a3d6c2773d62a8e4] [Current] | |||||||||||||||||||||||||||||||||||||||
| Feedback Forum | |||||||||||||||||||||||||||||||||||||||
Post a new message | |||||||||||||||||||||||||||||||||||||||
Dataset | |||||||||||||||||||||||||||||||||||||||
| Dataseries X: | |||||||||||||||||||||||||||||||||||||||
-0.02207903491 0.9338453915 0.5822269203 -1.792315997 -1.531110518 -1.677321411 -0.5741242056 0.1326369374 -0.08004965672 0.4137800203 1.153181834 -0.1804353961 0.8731125448 -1.621769498 1.264714563 -0.6388028035 -0.747741897 -0.6495645788 -0.4607824421 0.3329378035 0.7143385027 -0.3495851945 -0.2480070727 -2.367660293 0.2349459015 0.7404683233 1.627659589 -0.9470411817 -1.07174054 -1.083784783 0.02728727764 -0.4074185597 -0.8986333786 -0.2679905406 0.3699052207 0.4958269422 -1.45704054 0.1607298022 1.288386046 0.03112461488 -1.95359413 0.4879447723 -1.480295423 1.002067092 1.167195903 1.940452738 0.02957141541 -1.00686266 0.2147630463 -0.9508032589 0.3714420044 0.3498111895 -0.5213194983 -0.2534449747 1.279900168 0.8930353056 -0.3107674283 0.1980055581 -0.501582881 -1.631920933 -0.2876391824 0.3681663982 1.841485129 -0.3722371911 -0.5210146403 0.3212104397 1.491126347 -0.4499401518 2.14870126 1.255655976 1.527776578 -1.309925792 0.5078497637 -1.726469077 -0.3044560094 0.6663932266 0.6019645493 -0.1160862572 -1.598156917 0.281814923 0.6025930761 0.2408478478 -1.048596654 0.3784507128 -0.09150713479 0.115631928 0.01465313711 2.427202837 1.48120267 -0.3965150768 -1.669521664 -1.148383058 0.4149890108 0.5645861292 0.64335629 -0.9138903854 0.741167274 0.7994899917 -1.125135559 0.3685708164 -0.5332020657 0.9589164824 -0.4704357241 -1.732658313 -0.152241914 1.187915894 0.3352600865 -0.05743321476 -1.103812405 1.504409011 1.117632444 -0.8580781196 -1.877689685 -1.08789792 -0.09075233701 0.9307161346 -2.489369442 0.2477769121 0.292940873 -0.8436297766 0.7305042339 -0.237044189 -0.02042472418 0.6472682363 0.5810851151 1.43994176 0.6201756807 -0.8540143799 0.6706463217 -0.9577667478 1.85243742 -0.02310836812 0.3302763748 0.8993146715 0.581610169 1.448126896 1.761950747 -0.5741790701 0.4957566844 -0.01204437749 1.420977856 -1.624922254 -0.1846135238 0.01549381693 1.632820585 0.8270166856 0.2774647262 -0.454188766 -0.5557075713 0.9104650997 | |||||||||||||||||||||||||||||||||||||||
Tables (Output of Computation) | |||||||||||||||||||||||||||||||||||||||
| |||||||||||||||||||||||||||||||||||||||
Figures (Output of Computation) | |||||||||||||||||||||||||||||||||||||||
Input Parameters & R Code | |||||||||||||||||||||||||||||||||||||||
| Parameters (Session): | |||||||||||||||||||||||||||||||||||||||
| par1 = 8 ; par2 = 0 ; | |||||||||||||||||||||||||||||||||||||||
| Parameters (R input): | |||||||||||||||||||||||||||||||||||||||
| par1 = 8 ; par2 = 0 ; | |||||||||||||||||||||||||||||||||||||||
| R code (references can be found in the software module): | |||||||||||||||||||||||||||||||||||||||
par2 <- '0' | |||||||||||||||||||||||||||||||||||||||