Free Statistics

of Irreproducible Research!

Author's title

Author*The author of this computation has been verified*
R Software Modulerwasp_multipleregression.wasp
Title produced by softwareMultiple Regression
Date of computationTue, 15 Dec 2015 14:34:04 +0000
Cite this page as followsStatistical Computations at FreeStatistics.org, Office for Research Development and Education, URL https://freestatistics.org/blog/index.php?v=date/2015/Dec/15/t1450191206y0ey8xazvhhmgow.htm/, Retrieved Sat, 18 May 2024 13:53:17 +0000
Statistical Computations at FreeStatistics.org, Office for Research Development and Education, URL https://freestatistics.org/blog/index.php?pk=286519, Retrieved Sat, 18 May 2024 13:53:17 +0000
QR Codes:

Original text written by user:
IsPrivate?No (this computation is public)
User-defined keywords
Estimated Impact74
Family? (F = Feedback message, R = changed R code, M = changed R Module, P = changed Parameters, D = changed Data)
-       [Multiple Regression] [Multiple Regressi...] [2015-12-15 14:34:04] [66f7685cd41c835f5668549161ef3bd9] [Current]
Feedback Forum

Post a new message
Dataseries X:
2011 1 26 50 4 0 13 12 21 12.9
2011 1 57 62 4 1 8 8 22 12.2
2011 1 37 54 5 0 14 11 22 12.8
2011 1 67 71 4 1 16 13 18 7.4
2011 1 43 54 4 1 14 11 23 6.7
2011 1 52 65 9 1 13 10 12 12.6
2011 1 52 73 8 0 15 7 20 14.8
2011 1 43 52 11 1 13 10 22 13.3
2011 1 84 84 4 1 20 15 21 11.1
2011 1 67 42 4 1 17 12 19 8.2
2011 1 49 66 6 1 15 12 22 11.4
2011 1 70 65 4 1 16 10 15 6.4
2011 1 52 78 8 1 12 10 20 10.6
2011 1 58 73 4 0 17 14 19 12
2011 1 68 75 4 0 11 6 18 6.3
2011 0 62 72 11 0 16 12 15 11.3
2011 1 43 66 4 1 16 14 20 11.9
2011 1 56 70 4 0 15 11 21 9.3
2011 0 56 61 6 1 13 8 21 9.6
2011 1 74 81 6 0 14 12 15 10
2011 1 65 71 4 1 19 15 16 6.4
2011 1 63 69 8 1 16 13 23 13.8
2011 1 58 71 5 0 17 11 21 10.8
2011 1 57 72 4 1 10 12 18 13.8
2011 1 63 68 9 1 15 7 25 11.7
2011 1 53 70 4 1 14 11 9 10.9
2011 0 57 68 7 1 14 7 30 16.1
2011 0 51 61 10 0 16 12 20 13.4
2011 1 64 67 4 1 15 12 23 9.9
2011 1 53 76 4 0 17 13 16 11.5
2011 1 29 70 7 0 14 9 16 8.3
2011 1 54 60 12 0 16 11 19 11.7
2011 1 58 72 7 1 15 12 25 9
2011 1 43 69 5 1 16 15 18 9.7
2011 1 51 71 8 1 16 12 23 10.8
2011 1 53 62 5 1 10 6 21 10.3
2011 1 54 70 4 0 8 5 10 10.4
2011 0 56 64 9 1 17 13 14 12.7
2011 1 61 58 7 1 14 11 22 9.3
2011 1 47 76 4 0 10 6 26 11.8
2011 1 39 52 4 1 14 12 23 5.9
2011 1 48 59 4 1 12 10 23 11.4
2011 1 50 68 4 1 16 6 24 13
2011 1 35 76 4 1 16 12 24 10.8
2011 0 30 65 7 1 16 11 18 12.3
2011 1 68 67 4 0 8 6 23 11.3
2011 1 49 59 7 1 16 12 15 11.8
2011 0 61 69 4 1 15 12 19 7.9
2011 1 67 76 4 0 8 8 16 12.7
2011 0 47 63 4 1 13 10 25 12.3
2011 0 56 75 4 1 14 11 23 11.6
2011 0 50 63 8 1 13 7 17 6.7
2011 1 43 60 4 1 16 12 19 10.9
2011 0 67 73 4 1 19 13 21 12.1
2011 1 62 63 4 1 19 14 18 13.3
2011 1 57 70 4 1 14 12 27 10.1
2011 0 41 75 7 0 15 6 21 5.7
2011 1 54 66 12 1 13 14 13 14.3
2011 0 45 63 4 0 10 10 8 8
2011 0 48 63 4 1 16 12 29 13.3
2011 1 61 64 4 1 15 11 28 9.3
2011 1 56 70 5 0 11 10 23 12.5
2011 1 41 75 15 0 9 7 21 7.6
2011 1 43 61 5 1 16 12 19 15.9
2011 1 53 60 10 0 12 7 19 9.2
2011 0 44 62 9 1 12 12 20 9.1
2011 1 66 73 8 0 14 12 18 11.1
2011 1 58 61 4 1 14 10 19 13
2011 1 46 66 5 1 13 10 17 14.5
2011 0 37 64 4 0 15 12 19 12.2
2011 1 51 59 9 0 17 12 25 12.3
2011 1 51 64 4 0 14 12 19 11.4
2011 0 56 60 10 0 11 8 22 8.8
2011 0 66 56 4 1 9 10 23 14.6
2011 1 37 78 4 0 7 5 14 12.6
2011 1 42 67 7 0 15 10 16 13
2011 0 38 59 5 1 12 12 24 12.6
2011 1 66 66 4 0 15 11 20 13.2
2011 0 34 68 4 0 14 9 12 9.9
2011 1 53 71 4 1 16 12 24 7.7
2011 0 49 66 4 0 14 11 22 10.5
2011 0 55 73 4 0 13 10 12 13.4
2011 0 49 72 4 0 16 12 22 10.9
2011 0 59 71 6 1 13 10 20 4.3
2011 0 40 59 10 0 16 9 10 10.3
2011 0 58 64 7 1 16 11 23 11.8
2011 0 60 66 4 1 16 12 17 11.2
2011 0 63 78 4 0 10 7 22 11.4
2011 0 56 68 7 0 12 11 24 8.6
2011 0 54 73 4 0 12 12 18 13.2
2011 0 52 62 8 1 12 6 21 12.6
2011 0 34 65 11 1 12 9 20 5.6
2011 0 69 68 6 1 19 15 20 9.9
2011 0 32 65 14 0 14 10 22 8.8
2011 0 48 60 5 1 13 11 19 7.7
2011 0 67 71 4 0 16 12 20 9
2011 0 58 65 8 1 15 12 26 7.3
2011 0 57 68 9 1 12 12 23 11.4
2011 0 42 64 4 1 8 11 24 13.6
2011 0 64 74 4 1 10 9 21 7.9
2011 0 58 69 5 1 16 11 21 10.7
2011 0 66 76 4 0 16 12 19 10.3
2011 0 26 68 5 1 10 12 8 8.3
2011 0 61 72 4 1 18 14 17 9.6
2011 0 52 67 4 1 12 8 20 14.2
2011 0 51 63 7 0 16 10 11 8.5
2011 0 55 59 10 0 10 9 8 13.5
2011 0 50 73 4 0 14 10 15 4.9
2011 0 60 66 5 0 12 9 18 6.4
2011 0 56 62 4 0 11 10 18 9.6
2011 0 63 69 4 0 15 12 19 11.6
2011 0 61 66 4 1 7 11 19 11.1
2012 1 52 51 6 1 16 9 23 4.35
2012 1 16 56 4 1 16 11 22 12.7
2012 1 46 67 8 1 16 12 21 18.1
2012 1 56 69 5 1 16 12 25 17.85
2012 0 52 57 4 0 12 7 30 16.6
2012 0 55 56 17 1 15 12 17 12.6
2012 1 50 55 4 1 14 12 27 17.1
2012 1 59 63 4 0 15 12 23 19.1
2012 1 60 67 8 1 16 10 23 16.1
2012 1 52 65 4 0 13 15 18 13.35
2012 1 44 47 7 0 10 10 18 18.4
2012 1 67 76 4 1 17 15 23 14.7
2012 1 52 64 4 1 15 10 19 10.6
2012 1 55 68 5 1 18 15 15 12.6
2012 1 37 64 7 1 16 9 20 16.2
2012 1 54 65 4 1 20 15 16 13.6
2012 0 72 71 4 1 16 12 24 18.9
2012 1 51 63 7 1 17 13 25 14.1
2012 1 48 60 11 1 16 12 25 14.5
2012 1 60 68 7 0 15 12 19 16.15
2012 1 50 72 4 1 13 8 19 14.75
2012 1 63 70 4 1 16 9 16 14.8
2012 1 33 61 4 1 16 15 19 12.45
2012 1 67 61 4 1 16 12 19 12.65
2012 1 46 62 4 1 17 12 23 17.35
2012 1 54 71 4 1 20 15 21 8.6
2012 1 59 71 6 0 14 11 22 18.4
2012 1 61 51 8 1 17 12 19 16.1
2012 0 33 56 23 1 6 6 20 11.6
2012 1 47 70 4 1 16 14 20 17.75
2012 1 69 73 8 1 15 12 3 15.25
2012 1 52 76 6 1 16 12 23 17.65
2012 1 55 68 4 0 16 12 23 16.35
2012 1 41 48 7 0 14 11 20 17.65
2012 1 73 52 4 1 16 12 15 13.6
2012 1 52 60 4 0 16 12 16 14.35
2012 1 50 59 4 0 16 12 7 14.75
2012 1 51 57 10 1 14 12 24 18.25
2012 1 60 79 6 0 14 8 17 9.9
2012 1 56 60 5 1 16 8 24 16
2012 1 56 60 5 1 16 12 24 18.25
2012 1 29 59 4 0 15 12 19 16.85
2012 0 66 62 4 1 16 11 25 14.6
2012 0 66 59 5 1 16 10 20 13.85
2012 1 73 61 5 1 18 11 28 18.95
2012 1 55 71 5 0 15 12 23 15.6
2012 0 64 57 5 0 16 13 27 14.85
2012 0 40 66 4 0 16 12 18 11.75
2012 0 46 63 6 0 16 12 28 18.45
2012 0 58 69 4 1 17 10 21 15.9
2012 1 43 58 4 0 14 10 19 17.1
2012 1 61 59 4 1 18 11 23 16.1
2012 0 51 48 9 0 9 8 27 19.9
2012 0 50 66 18 1 15 12 22 10.95
2012 0 52 73 6 0 14 9 28 18.45
2012 0 54 67 5 1 15 12 25 15.1
2012 0 66 61 4 0 13 9 21 15
2012 0 61 68 11 0 16 11 22 11.35
2012 0 80 75 4 1 20 15 28 15.95
2012 0 51 62 10 0 14 8 20 18.1
2012 0 56 69 6 1 12 8 29 14.6
2012 1 56 58 8 1 15 11 25 15.4
2012 1 56 60 8 1 15 11 25 15.4
2012 0 53 74 6 1 15 11 20 17.6
2012 1 47 55 8 1 16 13 20 13.35
2012 1 25 62 4 0 11 7 16 19.1
2012 0 47 63 4 1 16 12 20 15.35
2012 1 46 69 9 0 7 8 20 7.6
2012 0 50 58 9 0 11 8 23 13.4
2012 0 39 58 5 0 9 4 18 13.9
2012 1 51 68 4 1 15 11 25 19.1
2012 0 58 72 4 0 16 10 18 15.25
2012 0 35 62 15 1 14 7 19 12.9
2012 0 58 62 10 0 15 12 25 16.1
2012 0 60 65 9 0 13 11 25 17.35
2012 0 62 69 7 0 13 9 25 13.15
2012 0 63 66 9 0 12 10 24 12.15
2012 0 53 72 6 1 16 8 19 12.6
2012 0 46 62 4 1 14 8 26 10.35
2012 0 67 75 7 1 16 11 10 15.4
2012 0 59 58 4 1 14 12 17 9.6
2012 0 64 66 7 0 15 10 13 18.2
2012 0 38 55 4 0 10 10 17 13.6
2012 0 50 47 15 1 16 12 30 14.85
2012 1 48 72 4 0 14 8 25 14.75
2012 0 48 62 9 0 16 11 4 14.1
2012 0 47 64 4 0 12 8 16 14.9
2012 0 66 64 4 0 16 10 21 16.25
2012 1 47 19 28 1 16 14 23 19.25
2012 0 63 50 4 1 15 9 22 13.6
2012 1 58 68 4 0 14 9 17 13.6
2012 0 44 70 4 0 16 10 20 15.65
2012 1 51 79 5 1 11 13 20 12.75
2012 0 43 69 4 0 15 12 22 14.6
2012 1 55 71 4 1 18 13 16 9.85
2012 0 38 48 12 1 13 8 23 12.65
2012 0 45 73 4 0 7 3 0 19.2
2012 0 50 74 6 1 7 8 18 16.6
2012 0 54 66 6 1 17 12 25 11.2
2012 1 57 71 5 1 18 11 23 15.25
2012 1 60 74 4 0 15 9 12 11.9
2012 0 55 78 4 0 8 12 18 13.2
2012 1 56 75 4 0 13 12 24 16.35
2012 1 49 53 10 1 13 12 11 12.4
2012 0 37 60 7 1 15 10 18 15.85
2012 1 59 70 4 1 18 13 23 18.15
2012 0 46 69 7 1 16 9 24 11.15
2012 0 51 65 4 0 14 12 29 15.65
2012 1 58 78 4 0 15 11 18 17.75
2012 0 64 78 12 0 19 14 15 7.65
2012 1 53 59 5 1 16 11 29 12.35
2012 1 48 72 8 1 12 9 16 15.6
2012 1 51 70 6 0 16 12 19 19.3
2012 0 47 63 17 0 11 8 22 15.2
2012 1 59 63 4 0 16 15 16 17.1
2012 0 62 71 5 1 15 12 23 15.6
2012 1 62 74 4 1 19 14 23 18.4
2012 1 51 67 5 0 15 12 19 19.05
2012 1 64 66 5 0 14 9 4 18.55
2012 1 52 62 6 0 14 9 20 19.1
2012 0 67 80 4 1 17 13 24 13.1
2012 1 50 73 4 1 16 13 20 12.85
2012 1 54 67 4 1 20 15 4 9.5
2012 1 58 61 6 1 16 11 24 4.5
2012 0 56 73 8 0 9 7 22 11.85
2012 1 63 74 10 1 13 10 16 13.6
2012 1 31 32 4 1 15 11 3 11.7
2012 0 65 69 5 1 19 14 15 12.4
2012 1 71 69 4 0 16 14 24 13.35
2012 0 50 84 4 0 17 13 17 11.4
2012 0 57 64 4 1 16 12 20 14.9
2012 0 47 58 16 0 9 8 27 19.9
2012 0 47 59 7 1 11 13 26 11.2
2012 0 57 78 4 1 14 9 23 14.6
2012 1 43 57 4 0 19 12 17 17.6
2012 1 41 60 14 1 13 13 20 14.05
2012 1 63 68 5 0 14 11 22 16.1
2012 1 63 68 5 1 15 11 19 13.35
2012 1 56 73 5 1 15 13 24 11.85
2012 1 51 69 5 0 14 12 19 11.95
2012 0 50 67 7 1 16 12 23 14.75
2012 0 22 60 19 0 17 10 15 15.15
2012 1 41 65 16 1 12 9 27 13.2
2012 0 59 66 4 0 15 10 26 16.85
2012 0 56 74 4 1 17 13 22 7.85
2012 1 66 81 7 0 15 13 22 7.7
2012 0 53 72 9 0 10 9 18 12.6
2012 0 42 55 5 1 16 11 15 7.85
2012 0 52 49 14 1 15 12 22 10.95
2012 0 54 74 4 0 11 8 27 12.35
2012 0 44 53 16 1 16 12 10 9.95
2012 0 62 64 10 1 16 12 20 14.9
2012 0 53 65 5 0 16 12 17 16.65
2012 0 50 57 6 1 14 9 23 13.4
2012 0 36 51 4 0 14 12 19 13.95
2012 0 76 80 4 0 16 12 13 15.7
2012 0 66 67 4 1 16 11 27 16.85
2012 0 62 70 5 1 18 12 23 10.95
2012 0 59 74 4 0 14 6 16 15.35
2012 0 47 75 4 1 20 7 25 12.2
2012 0 55 70 5 0 15 10 2 15.1
2012 0 58 69 4 0 16 12 26 17.75
2012 0 60 65 4 1 16 10 20 15.2
2012 1 44 55 5 0 16 12 23 14.6
2012 0 57 71 8 0 12 9 22 16.65
2012 0 45 65 15 1 8 3 24 8.1


Summary of computational transaction
Raw Inputview raw input (R code)
Raw Outputview raw output of R engine
Computing time8 seconds
R Server'Herman Ole Andreas Wold' @ wold.wessa.net
R Framework error message
Warning: there are blank lines in the 'Data X' field.
Please, use NA for missing data - blank lines are simply
 deleted and are NOT treated as missing values.

\begin{tabular}{lllllllll}
\hline
Summary of computational transaction \tabularnewline
Raw Input & view raw input (R code)  \tabularnewline
Raw Output & view raw output of R engine  \tabularnewline
Computing time & 8 seconds \tabularnewline
R Server & 'Herman Ole Andreas Wold' @ wold.wessa.net \tabularnewline
R Framework error message & 
Warning: there are blank lines in the 'Data X' field.
Please, use NA for missing data - blank lines are simply
 deleted and are NOT treated as missing values.
\tabularnewline \hline \end{tabular} %Source: https://freestatistics.org/blog/index.php?pk=286519&T=0

[TABLE]
[ROW][C]Summary of computational transaction[/C][/ROW]
[ROW][C]Raw Input[/C][C]view raw input (R code) [/C][/ROW]
[ROW][C]Raw Output[/C][C]view raw output of R engine [/C][/ROW]
[ROW][C]Computing time[/C][C]8 seconds[/C][/ROW]
[ROW][C]R Server[/C][C]'Herman Ole Andreas Wold' @ wold.wessa.net[/C][/ROW]
[ROW][C]R Framework error message[/C][C]
Warning: there are blank lines in the 'Data X' field.
Please, use NA for missing data - blank lines are simply
 deleted and are NOT treated as missing values.
[/C][/ROW] [/TABLE] Source: https://freestatistics.org/blog/index.php?pk=286519&T=0

Globally Unique Identifier (entire table): ba.freestatistics.org/blog/index.php?pk=286519&T=0

As an alternative you can also use a QR Code:  

The GUIDs for individual cells are displayed in the table below:

Summary of computational transaction
Raw Inputview raw input (R code)
Raw Outputview raw output of R engine
Computing time8 seconds
R Server'Herman Ole Andreas Wold' @ wold.wessa.net
R Framework error message
Warning: there are blank lines in the 'Data X' field.
Please, use NA for missing data - blank lines are simply
 deleted and are NOT treated as missing values.


Multiple Linear Regression - Estimated Regression Equation
TOT[t] = -7594.91 + 3.78278year[t] + 0.683239group[t] + 0.0128827AMS.I[t] -0.0404216AMS.E[t] -0.0601216AMS.A[t] -1.07238gender[t] -0.0456854CONFSTATTOT[t] + 0.0255157CONFSOFTTOT[t] + 0.0718987NUMERACYTOT[t] + e[t]

\begin{tabular}{lllllllll}
\hline
Multiple Linear Regression - Estimated Regression Equation \tabularnewline
TOT[t] =  -7594.91 +  3.78278year[t] +  0.683239group[t] +  0.0128827AMS.I[t] -0.0404216AMS.E[t] -0.0601216AMS.A[t] -1.07238gender[t] -0.0456854CONFSTATTOT[t] +  0.0255157CONFSOFTTOT[t] +  0.0718987NUMERACYTOT[t]  + e[t] \tabularnewline
 \tabularnewline
\hline
\end{tabular}
%Source: https://freestatistics.org/blog/index.php?pk=286519&T=1

[TABLE]
[ROW][C]Multiple Linear Regression - Estimated Regression Equation[/C][/ROW]
[ROW][C]TOT[t] =  -7594.91 +  3.78278year[t] +  0.683239group[t] +  0.0128827AMS.I[t] -0.0404216AMS.E[t] -0.0601216AMS.A[t] -1.07238gender[t] -0.0456854CONFSTATTOT[t] +  0.0255157CONFSOFTTOT[t] +  0.0718987NUMERACYTOT[t]  + e[t][/C][/ROW]
[ROW][C][/C][/ROW]
[/TABLE]
Source: https://freestatistics.org/blog/index.php?pk=286519&T=1

Globally Unique Identifier (entire table): ba.freestatistics.org/blog/index.php?pk=286519&T=1

As an alternative you can also use a QR Code:  

The GUIDs for individual cells are displayed in the table below:

Multiple Linear Regression - Estimated Regression Equation
TOT[t] = -7594.91 + 3.78278year[t] + 0.683239group[t] + 0.0128827AMS.I[t] -0.0404216AMS.E[t] -0.0601216AMS.A[t] -1.07238gender[t] -0.0456854CONFSTATTOT[t] + 0.0255157CONFSOFTTOT[t] + 0.0718987NUMERACYTOT[t] + e[t]


Multiple Linear Regression - Ordinary Least Squares
VariableParameterS.D.T-STATH0: parameter = 02-tail p-value1-tail p-value
(Intercept)-7595 707.8-1.0730e+01 1.399e-22 6.996e-23
year+3.783 0.3519+1.0750e+01 1.21e-22 6.052e-23
group+0.6832 0.3438+1.9880e+00 0.04788 0.02394
AMS.I+0.01288 0.01803+7.1450e-01 0.4755 0.2378
AMS.E-0.04042 0.02326-1.7380e+00 0.08336 0.04168
AMS.A-0.06012 0.05255-1.1440e+00 0.2536 0.1268
gender-1.072 0.3597-2.9810e+00 0.003133 0.001566
CONFSTATTOT-0.04569 0.08142-5.6110e-01 0.5752 0.2876
CONFSOFTTOT+0.02552 0.09528+2.6780e-01 0.7891 0.3945
NUMERACYTOT+0.0719 0.03338+2.1540e+00 0.03213 0.01607

\begin{tabular}{lllllllll}
\hline
Multiple Linear Regression - Ordinary Least Squares \tabularnewline
Variable & Parameter & S.D. & T-STATH0: parameter = 0 & 2-tail p-value & 1-tail p-value \tabularnewline
(Intercept) & -7595 &  707.8 & -1.0730e+01 &  1.399e-22 &  6.996e-23 \tabularnewline
year & +3.783 &  0.3519 & +1.0750e+01 &  1.21e-22 &  6.052e-23 \tabularnewline
group & +0.6832 &  0.3438 & +1.9880e+00 &  0.04788 &  0.02394 \tabularnewline
AMS.I & +0.01288 &  0.01803 & +7.1450e-01 &  0.4755 &  0.2378 \tabularnewline
AMS.E & -0.04042 &  0.02326 & -1.7380e+00 &  0.08336 &  0.04168 \tabularnewline
AMS.A & -0.06012 &  0.05255 & -1.1440e+00 &  0.2536 &  0.1268 \tabularnewline
gender & -1.072 &  0.3597 & -2.9810e+00 &  0.003133 &  0.001566 \tabularnewline
CONFSTATTOT & -0.04569 &  0.08142 & -5.6110e-01 &  0.5752 &  0.2876 \tabularnewline
CONFSOFTTOT & +0.02552 &  0.09528 & +2.6780e-01 &  0.7891 &  0.3945 \tabularnewline
NUMERACYTOT & +0.0719 &  0.03338 & +2.1540e+00 &  0.03213 &  0.01607 \tabularnewline
\hline
\end{tabular}
%Source: https://freestatistics.org/blog/index.php?pk=286519&T=2

[TABLE]
[ROW][C]Multiple Linear Regression - Ordinary Least Squares[/C][/ROW]
[ROW][C]Variable[/C][C]Parameter[/C][C]S.D.[/C][C]T-STATH0: parameter = 0[/C][C]2-tail p-value[/C][C]1-tail p-value[/C][/ROW]
[ROW][C](Intercept)[/C][C]-7595[/C][C] 707.8[/C][C]-1.0730e+01[/C][C] 1.399e-22[/C][C] 6.996e-23[/C][/ROW]
[ROW][C]year[/C][C]+3.783[/C][C] 0.3519[/C][C]+1.0750e+01[/C][C] 1.21e-22[/C][C] 6.052e-23[/C][/ROW]
[ROW][C]group[/C][C]+0.6832[/C][C] 0.3438[/C][C]+1.9880e+00[/C][C] 0.04788[/C][C] 0.02394[/C][/ROW]
[ROW][C]AMS.I[/C][C]+0.01288[/C][C] 0.01803[/C][C]+7.1450e-01[/C][C] 0.4755[/C][C] 0.2378[/C][/ROW]
[ROW][C]AMS.E[/C][C]-0.04042[/C][C] 0.02326[/C][C]-1.7380e+00[/C][C] 0.08336[/C][C] 0.04168[/C][/ROW]
[ROW][C]AMS.A[/C][C]-0.06012[/C][C] 0.05255[/C][C]-1.1440e+00[/C][C] 0.2536[/C][C] 0.1268[/C][/ROW]
[ROW][C]gender[/C][C]-1.072[/C][C] 0.3597[/C][C]-2.9810e+00[/C][C] 0.003133[/C][C] 0.001566[/C][/ROW]
[ROW][C]CONFSTATTOT[/C][C]-0.04569[/C][C] 0.08142[/C][C]-5.6110e-01[/C][C] 0.5752[/C][C] 0.2876[/C][/ROW]
[ROW][C]CONFSOFTTOT[/C][C]+0.02552[/C][C] 0.09528[/C][C]+2.6780e-01[/C][C] 0.7891[/C][C] 0.3945[/C][/ROW]
[ROW][C]NUMERACYTOT[/C][C]+0.0719[/C][C] 0.03338[/C][C]+2.1540e+00[/C][C] 0.03213[/C][C] 0.01607[/C][/ROW]
[/TABLE]
Source: https://freestatistics.org/blog/index.php?pk=286519&T=2

Globally Unique Identifier (entire table): ba.freestatistics.org/blog/index.php?pk=286519&T=2

As an alternative you can also use a QR Code:  

The GUIDs for individual cells are displayed in the table below:

Multiple Linear Regression - Ordinary Least Squares
VariableParameterS.D.T-STATH0: parameter = 02-tail p-value1-tail p-value
(Intercept)-7595 707.8-1.0730e+01 1.399e-22 6.996e-23
year+3.783 0.3519+1.0750e+01 1.21e-22 6.052e-23
group+0.6832 0.3438+1.9880e+00 0.04788 0.02394
AMS.I+0.01288 0.01803+7.1450e-01 0.4755 0.2378
AMS.E-0.04042 0.02326-1.7380e+00 0.08336 0.04168
AMS.A-0.06012 0.05255-1.1440e+00 0.2536 0.1268
gender-1.072 0.3597-2.9810e+00 0.003133 0.001566
CONFSTATTOT-0.04569 0.08142-5.6110e-01 0.5752 0.2876
CONFSOFTTOT+0.02552 0.09528+2.6780e-01 0.7891 0.3945
NUMERACYTOT+0.0719 0.03338+2.1540e+00 0.03213 0.01607


Multiple Linear Regression - Regression Statistics
Multiple R 0.5949
R-squared 0.354
Adjusted R-squared 0.3323
F-TEST (value) 16.32
F-TEST (DF numerator)9
F-TEST (DF denominator)268
p-value 0
Multiple Linear Regression - Residual Statistics
Residual Standard Deviation 2.774
Sum Squared Residuals 2062

\begin{tabular}{lllllllll}
\hline
Multiple Linear Regression - Regression Statistics \tabularnewline
Multiple R &  0.5949 \tabularnewline
R-squared &  0.354 \tabularnewline
Adjusted R-squared &  0.3323 \tabularnewline
F-TEST (value) &  16.32 \tabularnewline
F-TEST (DF numerator) & 9 \tabularnewline
F-TEST (DF denominator) & 268 \tabularnewline
p-value &  0 \tabularnewline
Multiple Linear Regression - Residual Statistics \tabularnewline
Residual Standard Deviation &  2.774 \tabularnewline
Sum Squared Residuals &  2062 \tabularnewline
\hline
\end{tabular}
%Source: https://freestatistics.org/blog/index.php?pk=286519&T=3

[TABLE]
[ROW][C]Multiple Linear Regression - Regression Statistics[/C][/ROW]
[ROW][C]Multiple R[/C][C] 0.5949[/C][/ROW]
[ROW][C]R-squared[/C][C] 0.354[/C][/ROW]
[ROW][C]Adjusted R-squared[/C][C] 0.3323[/C][/ROW]
[ROW][C]F-TEST (value)[/C][C] 16.32[/C][/ROW]
[ROW][C]F-TEST (DF numerator)[/C][C]9[/C][/ROW]
[ROW][C]F-TEST (DF denominator)[/C][C]268[/C][/ROW]
[ROW][C]p-value[/C][C] 0[/C][/ROW]
[ROW][C]Multiple Linear Regression - Residual Statistics[/C][/ROW]
[ROW][C]Residual Standard Deviation[/C][C] 2.774[/C][/ROW]
[ROW][C]Sum Squared Residuals[/C][C] 2062[/C][/ROW]
[/TABLE]
Source: https://freestatistics.org/blog/index.php?pk=286519&T=3

Globally Unique Identifier (entire table): ba.freestatistics.org/blog/index.php?pk=286519&T=3

As an alternative you can also use a QR Code:  

The GUIDs for individual cells are displayed in the table below:

Multiple Linear Regression - Regression Statistics
Multiple R 0.5949
R-squared 0.354
Adjusted R-squared 0.3323
F-TEST (value) 16.32
F-TEST (DF numerator)9
F-TEST (DF denominator)268
p-value 0
Multiple Linear Regression - Residual Statistics
Residual Standard Deviation 2.774
Sum Squared Residuals 2062


Parameters (Session):
par1 = 10 ; par2 = Do not include Seasonal Dummies ; par3 = No Linear Trend ;
Parameters (R input):
par1 = 10 ; par2 = Do not include Seasonal Dummies ; par3 = No Linear Trend ; par4 = ; par5 = ;
R code (references can be found in the software module):
par5 <- ''
par4 <- ''
par3 <- 'No Linear Trend'
par2 <- 'Do not include Seasonal Dummies'
par1 <- ''
library(lattice)
library(lmtest)
n25 <- 25 #minimum number of obs. for Goldfeld-Quandt test
mywarning <- ''
par1 <- as.numeric(par1)
if(is.na(par1)) {
par1 <- 1
mywarning = 'Warning: you did not specify the column number of the endogenous series! The first column was selected by default.'
}
if (par4=='') par4 <- 0
par4 <- as.numeric(par4)
if (par5=='') par5 <- 0
par5 <- as.numeric(par5)
x <- na.omit(t(y))
k <- length(x[1,])
n <- length(x[,1])
x1 <- cbind(x[,par1], x[,1:k!=par1])
mycolnames <- c(colnames(x)[par1], colnames(x)[1:k!=par1])
colnames(x1) <- mycolnames #colnames(x)[par1]
x <- x1
if (par3 == 'First Differences'){
(n <- n -1)
x2 <- array(0, dim=c(n,k), dimnames=list(1:n, paste('(1-B)',colnames(x),sep='')))
for (i in 1:n) {
for (j in 1:k) {
x2[i,j] <- x[i+1,j] - x[i,j]
}
}
x <- x2
}
if (par3 == 'Seasonal Differences (s=12)'){
(n <- n - 12)
x2 <- array(0, dim=c(n,k), dimnames=list(1:n, paste('(1-B12)',colnames(x),sep='')))
for (i in 1:n) {
for (j in 1:k) {
x2[i,j] <- x[i+12,j] - x[i,j]
}
}
x <- x2
}
if (par3 == 'First and Seasonal Differences (s=12)'){
(n <- n -1)
x2 <- array(0, dim=c(n,k), dimnames=list(1:n, paste('(1-B)',colnames(x),sep='')))
for (i in 1:n) {
for (j in 1:k) {
x2[i,j] <- x[i+1,j] - x[i,j]
}
}
x <- x2
(n <- n - 12)
x2 <- array(0, dim=c(n,k), dimnames=list(1:n, paste('(1-B12)',colnames(x),sep='')))
for (i in 1:n) {
for (j in 1:k) {
x2[i,j] <- x[i+12,j] - x[i,j]
}
}
x <- x2
}
if(par4 > 0) {
x2 <- array(0, dim=c(n-par4,par4), dimnames=list(1:(n-par4), paste(colnames(x)[par1],'(t-',1:par4,')',sep='')))
for (i in 1:(n-par4)) {
for (j in 1:par4) {
x2[i,j] <- x[i+par4-j,par1]
}
}
x <- cbind(x[(par4+1):n,], x2)
n <- n - par4
}
if(par5 > 0) {
x2 <- array(0, dim=c(n-par5*12,par5), dimnames=list(1:(n-par5*12), paste(colnames(x)[par1],'(t-',1:par5,'s)',sep='')))
for (i in 1:(n-par5*12)) {
for (j in 1:par5) {
x2[i,j] <- x[i+par5*12-j*12,par1]
}
}
x <- cbind(x[(par5*12+1):n,], x2)
n <- n - par5*12
}
if (par2 == 'Include Monthly Dummies'){
x2 <- array(0, dim=c(n,11), dimnames=list(1:n, paste('M', seq(1:11), sep ='')))
for (i in 1:11){
x2[seq(i,n,12),i] <- 1
}
x <- cbind(x, x2)
}
if (par2 == 'Include Quarterly Dummies'){
x2 <- array(0, dim=c(n,3), dimnames=list(1:n, paste('Q', seq(1:3), sep ='')))
for (i in 1:3){
x2[seq(i,n,4),i] <- 1
}
x <- cbind(x, x2)
}
(k <- length(x[n,]))
if (par3 == 'Linear Trend'){
x <- cbind(x, c(1:n))
colnames(x)[k+1] <- 't'
}
x
(k <- length(x[n,]))
head(x)
df <- as.data.frame(x)
(mylm <- lm(df))
(mysum <- summary(mylm))
if (n > n25) {
kp3 <- k + 3
nmkm3 <- n - k - 3
gqarr <- array(NA, dim=c(nmkm3-kp3+1,3))
numgqtests <- 0
numsignificant1 <- 0
numsignificant5 <- 0
numsignificant10 <- 0
for (mypoint in kp3:nmkm3) {
j <- 0
numgqtests <- numgqtests + 1
for (myalt in c('greater', 'two.sided', 'less')) {
j <- j + 1
gqarr[mypoint-kp3+1,j] <- gqtest(mylm, point=mypoint, alternative=myalt)$p.value
}
if (gqarr[mypoint-kp3+1,2] < 0.01) numsignificant1 <- numsignificant1 + 1
if (gqarr[mypoint-kp3+1,2] < 0.05) numsignificant5 <- numsignificant5 + 1
if (gqarr[mypoint-kp3+1,2] < 0.10) numsignificant10 <- numsignificant10 + 1
}
gqarr
}
bitmap(file='test0.png')
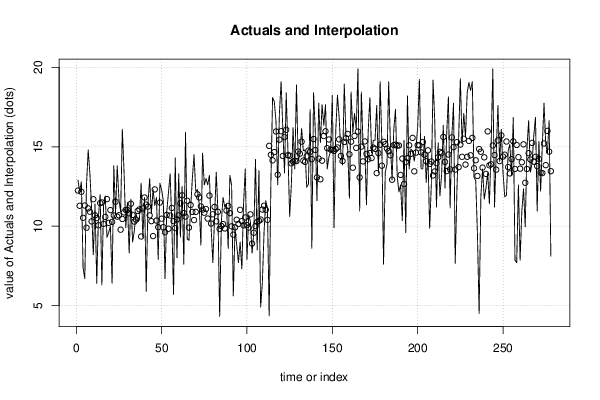
plot(x[,1], type='l', main='Actuals and Interpolation', ylab='value of Actuals and Interpolation (dots)', xlab='time or index')
points(x[,1]-mysum$resid)
grid()
dev.off()
bitmap(file='test1.png')
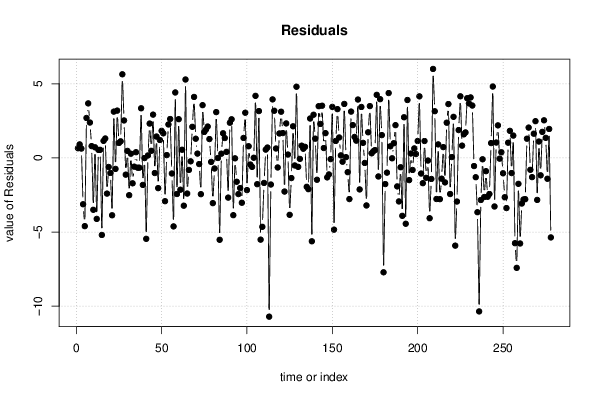
plot(mysum$resid, type='b', pch=19, main='Residuals', ylab='value of Residuals', xlab='time or index')
grid()
dev.off()
bitmap(file='test2.png')
hist(mysum$resid, main='Residual Histogram', xlab='values of Residuals')
grid()
dev.off()
bitmap(file='test3.png')
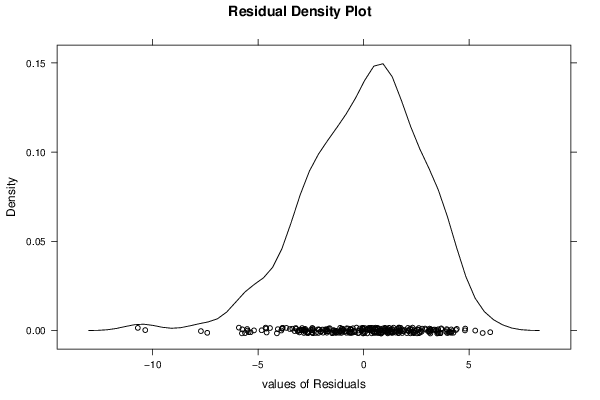
densityplot(~mysum$resid,col='black',main='Residual Density Plot', xlab='values of Residuals')
dev.off()
bitmap(file='test4.png')
qqnorm(mysum$resid, main='Residual Normal Q-Q Plot')
qqline(mysum$resid)
grid()
dev.off()
(myerror <- as.ts(mysum$resid))
bitmap(file='test5.png')
dum <- cbind(lag(myerror,k=1),myerror)
dum
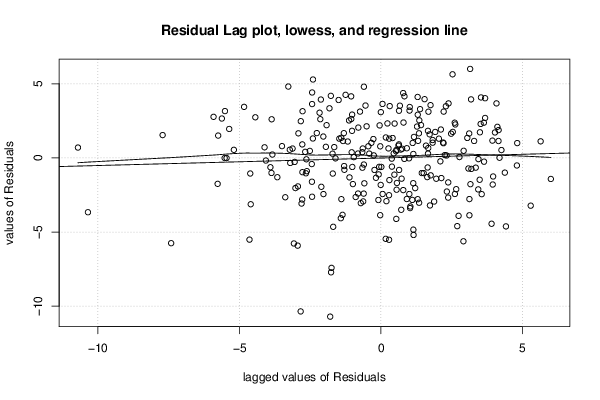
dum1 <- dum[2:length(myerror),]
dum1
z <- as.data.frame(dum1)
z
plot(z,main=paste('Residual Lag plot, lowess, and regression line'), ylab='values of Residuals', xlab='lagged values of Residuals')
lines(lowess(z))
abline(lm(z))
grid()
dev.off()
bitmap(file='test6.png')
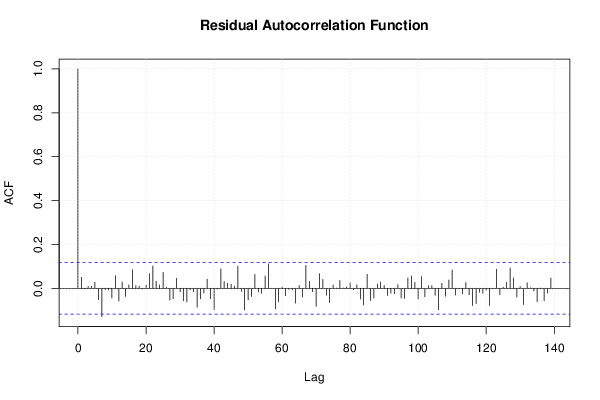
acf(mysum$resid, lag.max=length(mysum$resid)/2, main='Residual Autocorrelation Function')
grid()
dev.off()
bitmap(file='test7.png')
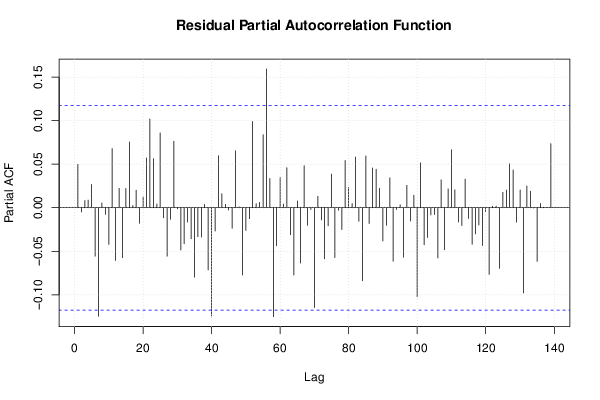
pacf(mysum$resid, lag.max=length(mysum$resid)/2, main='Residual Partial Autocorrelation Function')
grid()
dev.off()
bitmap(file='test8.png')
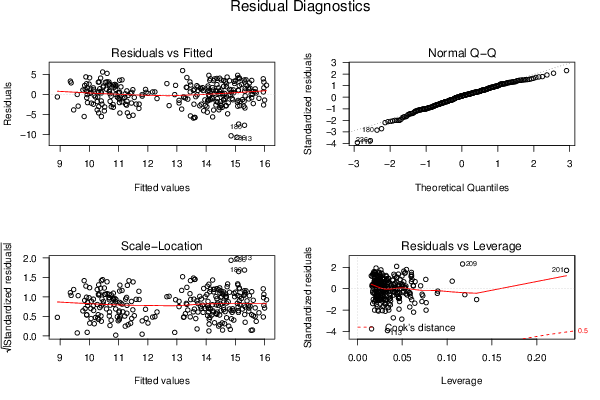
opar <- par(mfrow = c(2,2), oma = c(0, 0, 1.1, 0))
plot(mylm, las = 1, sub='Residual Diagnostics')
par(opar)
dev.off()
if (n > n25) {
bitmap(file='test9.png')
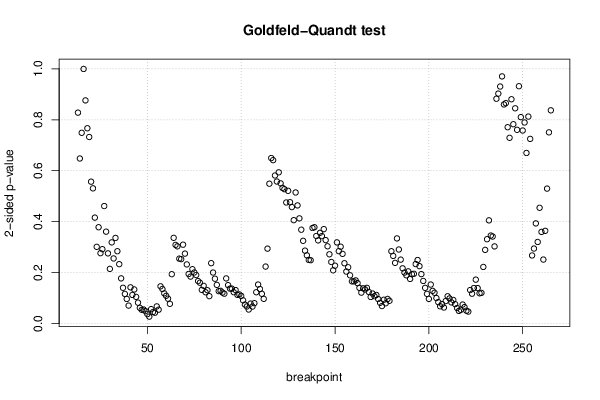
plot(kp3:nmkm3,gqarr[,2], main='Goldfeld-Quandt test',ylab='2-sided p-value',xlab='breakpoint')
grid()
dev.off()
}
load(file='createtable')
a<-table.start()
a<-table.row.start(a)
a<-table.element(a, 'Multiple Linear Regression - Estimated Regression Equation', 1, TRUE)
a<-table.row.end(a)
myeq <- colnames(x)[1]
myeq <- paste(myeq, '[t] = ', sep='')
for (i in 1:k){
if (mysum$coefficients[i,1] > 0) myeq <- paste(myeq, '+', '')
myeq <- paste(myeq, signif(mysum$coefficients[i,1],6), sep=' ')
if (rownames(mysum$coefficients)[i] != '(Intercept)') {
myeq <- paste(myeq, rownames(mysum$coefficients)[i], sep='')
if (rownames(mysum$coefficients)[i] != 't') myeq <- paste(myeq, '[t]', sep='')
}
}
myeq <- paste(myeq, ' + e[t]')
a<-table.row.start(a)
a<-table.element(a, myeq)
a<-table.row.end(a)
a<-table.row.start(a)
a<-table.element(a, mywarning)
a<-table.row.end(a)
a<-table.end(a)
table.save(a,file='mytable1.tab')
a<-table.start()
a<-table.row.start(a)
a<-table.element(a,hyperlink('ols1.htm','Multiple Linear Regression - Ordinary Least Squares',''), 6, TRUE)
a<-table.row.end(a)
a<-table.row.start(a)
a<-table.element(a,'Variable',header=TRUE)
a<-table.element(a,'Parameter',header=TRUE)
a<-table.element(a,'S.D.',header=TRUE)
a<-table.element(a,'T-STAT
H0: parameter = 0',header=TRUE)
a<-table.element(a,'2-tail p-value',header=TRUE)
a<-table.element(a,'1-tail p-value',header=TRUE)
a<-table.row.end(a)
for (i in 1:k){
a<-table.row.start(a)
a<-table.element(a,rownames(mysum$coefficients)[i],header=TRUE)
a<-table.element(a,formatC(signif(mysum$coefficients[i,1],5),format='g',flag='+'))
a<-table.element(a,formatC(signif(mysum$coefficients[i,2],5),format='g',flag=' '))
a<-table.element(a,formatC(signif(mysum$coefficients[i,3],4),format='e',flag='+'))
a<-table.element(a,formatC(signif(mysum$coefficients[i,4],4),format='g',flag=' '))
a<-table.element(a,formatC(signif(mysum$coefficients[i,4]/2,4),format='g',flag=' '))
a<-table.row.end(a)
}
a<-table.end(a)
table.save(a,file='mytable2.tab')
a<-table.start()
a<-table.row.start(a)
a<-table.element(a, 'Multiple Linear Regression - Regression Statistics', 2, TRUE)
a<-table.row.end(a)
a<-table.row.start(a)
a<-table.element(a, 'Multiple R',1,TRUE)
a<-table.element(a,formatC(signif(sqrt(mysum$r.squared),6),format='g',flag=' '))
a<-table.row.end(a)
a<-table.row.start(a)
a<-table.element(a, 'R-squared',1,TRUE)
a<-table.element(a,formatC(signif(mysum$r.squared,6),format='g',flag=' '))
a<-table.row.end(a)
a<-table.row.start(a)
a<-table.element(a, 'Adjusted R-squared',1,TRUE)
a<-table.element(a,formatC(signif(mysum$adj.r.squared,6),format='g',flag=' '))
a<-table.row.end(a)
a<-table.row.start(a)
a<-table.element(a, 'F-TEST (value)',1,TRUE)
a<-table.element(a,formatC(signif(mysum$fstatistic[1],6),format='g',flag=' '))
a<-table.row.end(a)
a<-table.row.start(a)
a<-table.element(a, 'F-TEST (DF numerator)',1,TRUE)
a<-table.element(a, signif(mysum$fstatistic[2],6))
a<-table.row.end(a)
a<-table.row.start(a)
a<-table.element(a, 'F-TEST (DF denominator)',1,TRUE)
a<-table.element(a, signif(mysum$fstatistic[3],6))
a<-table.row.end(a)
a<-table.row.start(a)
a<-table.element(a, 'p-value',1,TRUE)
a<-table.element(a,formatC(signif(1-pf(mysum$fstatistic[1],mysum$fstatistic[2],mysum$fstatistic[3]),6),format='g',flag=' '))
a<-table.row.end(a)
a<-table.row.start(a)
a<-table.element(a, 'Multiple Linear Regression - Residual Statistics', 2, TRUE)
a<-table.row.end(a)
a<-table.row.start(a)
a<-table.element(a, 'Residual Standard Deviation',1,TRUE)
a<-table.element(a,formatC(signif(mysum$sigma,6),format='g',flag=' '))
a<-table.row.end(a)
a<-table.row.start(a)
a<-table.element(a, 'Sum Squared Residuals',1,TRUE)
a<-table.element(a,formatC(signif(sum(myerror*myerror),6),format='g',flag=' '))
a<-table.row.end(a)
a<-table.end(a)
table.save(a,file='mytable3.tab')
if(n < 200) {
a<-table.start()
a<-table.row.start(a)
a<-table.element(a, 'Multiple Linear Regression - Actuals, Interpolation, and Residuals', 4, TRUE)
a<-table.row.end(a)
a<-table.row.start(a)
a<-table.element(a, 'Time or Index', 1, TRUE)
a<-table.element(a, 'Actuals', 1, TRUE)
a<-table.element(a, 'Interpolation
Forecast', 1, TRUE)
a<-table.element(a, 'Residuals
Prediction Error', 1, TRUE)
a<-table.row.end(a)
for (i in 1:n) {
a<-table.row.start(a)
a<-table.element(a,i, 1, TRUE)
a<-table.element(a,formatC(signif(x[i],6),format='g',flag=' '))
a<-table.element(a,formatC(signif(x[i]-mysum$resid[i],6),format='g',flag=' '))
a<-table.element(a,formatC(signif(mysum$resid[i],6),format='g',flag=' '))
a<-table.row.end(a)
}
a<-table.end(a)
table.save(a,file='mytable4.tab')
if (n > n25) {
a<-table.start()
a<-table.row.start(a)
a<-table.element(a,'Goldfeld-Quandt test for Heteroskedasticity',4,TRUE)
a<-table.row.end(a)
a<-table.row.start(a)
a<-table.element(a,'p-values',header=TRUE)
a<-table.element(a,'Alternative Hypothesis',3,header=TRUE)
a<-table.row.end(a)
a<-table.row.start(a)
a<-table.element(a,'breakpoint index',header=TRUE)
a<-table.element(a,'greater',header=TRUE)
a<-table.element(a,'2-sided',header=TRUE)
a<-table.element(a,'less',header=TRUE)
a<-table.row.end(a)
for (mypoint in kp3:nmkm3) {
a<-table.row.start(a)
a<-table.element(a,mypoint,header=TRUE)
a<-table.element(a,formatC(signif(gqarr[mypoint-kp3+1,1],6),format='g',flag=' '))
a<-table.element(a,formatC(signif(gqarr[mypoint-kp3+1,2],6),format='g',flag=' '))
a<-table.element(a,formatC(signif(gqarr[mypoint-kp3+1,3],6),format='g',flag=' '))
a<-table.row.end(a)
}
a<-table.end(a)
table.save(a,file='mytable5.tab')
a<-table.start()
a<-table.row.start(a)
a<-table.element(a,'Meta Analysis of Goldfeld-Quandt test for Heteroskedasticity',4,TRUE)
a<-table.row.end(a)
a<-table.row.start(a)
a<-table.element(a,'Description',header=TRUE)
a<-table.element(a,'# significant tests',header=TRUE)
a<-table.element(a,'% significant tests',header=TRUE)
a<-table.element(a,'OK/NOK',header=TRUE)
a<-table.row.end(a)
a<-table.row.start(a)
a<-table.element(a,'1% type I error level',header=TRUE)
a<-table.element(a,signif(numsignificant1,6))
a<-table.element(a,formatC(signif(numsignificant1/numgqtests,6),format='g',flag=' '))
if (numsignificant1/numgqtests < 0.01) dum <- 'OK' else dum <- 'NOK'
a<-table.element(a,dum)
a<-table.row.end(a)
a<-table.row.start(a)
a<-table.element(a,'5% type I error level',header=TRUE)
a<-table.element(a,signif(numsignificant5,6))
a<-table.element(a,signif(numsignificant5/numgqtests,6))
if (numsignificant5/numgqtests < 0.05) dum <- 'OK' else dum <- 'NOK'
a<-table.element(a,dum)
a<-table.row.end(a)
a<-table.row.start(a)
a<-table.element(a,'10% type I error level',header=TRUE)
a<-table.element(a,signif(numsignificant10,6))
a<-table.element(a,signif(numsignificant10/numgqtests,6))
if (numsignificant10/numgqtests < 0.1) dum <- 'OK' else dum <- 'NOK'
a<-table.element(a,dum)
a<-table.row.end(a)
a<-table.end(a)
table.save(a,file='mytable6.tab')
}
}