Free Statistics

of Irreproducible Research!

Author's title

Author*The author of this computation has been verified*
R Software Modulerwasp_multipleregression.wasp
Title produced by softwareMultiple Regression
Date of computationTue, 15 Dec 2015 12:08:38 +0000
Cite this page as followsStatistical Computations at FreeStatistics.org, Office for Research Development and Education, URL https://freestatistics.org/blog/index.php?v=date/2015/Dec/15/t1450182023qh890ad7anyzad6.htm/, Retrieved Sat, 18 May 2024 16:52:00 +0000
Statistical Computations at FreeStatistics.org, Office for Research Development and Education, URL https://freestatistics.org/blog/index.php?pk=286473, Retrieved Sat, 18 May 2024 16:52:00 +0000
QR Codes:

Original text written by user:
IsPrivate?No (this computation is public)
User-defined keywords
Estimated Impact92
Family? (F = Feedback message, R = changed R code, M = changed R Module, P = changed Parameters, D = changed Data)
-       [Multiple Regression] [V_A Computation 5] [2015-12-15 12:08:38] [e73b7cd66085b2a8dc50e64bc3434afa] [Current]
Feedback Forum

Post a new message
Dataseries X:
-5 -25 50 17 -6 19
-1 -19 53 20 -2 20
-2 -20 50 19 -4 21
-5 -21 50 21 -5 20
-4 -19 51 17 -2 21
-6 -17 53 15 -4 19
-2 -16 49 18 -4 22
-2 -10 54 19 -5 20
-2 -16 57 16 -7 18
-2 -10 58 21 -5 16
2 -8 56 26 -6 17
1 -7 60 23 -4 18
-8 -15 55 24 -2 19
-1 -7 54 23 -3 18
1 -6 52 19 0 20
-1 -6 55 25 -4 21
2 2 56 21 -3 18
2 -4 54 19 -3 19
1 -4 53 20 -3 19
-1 -8 59 20 -4 19
-2 -10 62 17 -5 21
-2 -16 63 25 -5 19
-1 -14 64 19 -6 19
-8 -30 75 13 -10 17
-4 -33 77 15 -11 16
-6 -40 79 15 -13 16
-3 -38 77 13 -12 17
-3 -39 82 11 -13 16
-7 -46 83 9 -12 15
-9 -50 81 2 -15 16
-11 -55 78 -2 -14 16
-13 -66 79 -4 -16 16
-11 -63 79 -2 -16 18
-9 -56 73 1 -12 19
-17 -66 72 -13 -16 16
-22 -63 67 -11 -15 16
-25 -69 67 -14 -17 16
-20 -69 50 -4 -15 18
-24 -72 45 -9 -14 16
-24 -69 39 -5 -15 15
-22 -67 39 -4 -14 15
-19 -64 37 -8 -16 16
-18 -61 30 -1 -11 18
-17 -58 24 -2 -14 16
-11 -47 27 -1 -12 19
-11 -44 19 8 -11 19
-12 -42 19 8 -13 18
-10 -34 25 6 -12 17
-15 -38 16 7 -12 19
-15 -41 20 2 -10 22
-15 -38 25 3 -12 19
-13 -37 34 0 -11 19
-8 -22 39 5 -10 16
-13 -37 40 -1 -12 18
-9 -36 38 3 -12 20
-7 -25 42 4 -11 17
-4 -15 46 8 -12 17
-4 -17 48 10 -9 17
-2 -19 51 14 -6 20
0 -12 55 15 -7 21
-2 -17 52 9 -7 19
-3 -21 55 8 -10 18
1 -10 58 10 -8 20
-2 -19 72 5 -11 17
-1 -14 70 4 -12 15
1 -8 70 8 -11 17
-3 -16 63 8 -11 18
-4 -14 66 10 -9 20
-9 -30 65 8 -9 19
-9 -33 55 10 -12 20
-7 -37 57 -8 -10 22
-14 -47 60 -6 -10 20
-12 -48 63 -10 -13 21
-16 -50 65 -15 -13 19
-20 -56 61 -21 -12 22
-12 -47 65 -24 -14 19
-12 -37 63 -15 -9 21
-10 -35 59 -12 -12 19
-10 -29 56 -11 -10 21
-13 -28 54 -11 -13 18
-16 -29 56 -13 -11 18
-14 -33 54 -10 -11 20
-17 -41 58 -9 -11 19
-24 -52 59 -11 -12 19
-25 -49 60 -17 -13 17
-23 -47 57 -14 -10 18
-17 -37 54 -15 -11 17
-24 -49 52 -17 -10 18
-20 -44 50 -14 -12 19
-19 -39 51 -14 -10 17
-18 -38 47 -16 -10 19
-16 -35 51 -15 -11 19
-12 -24 46 -14 -12 17
-7 -11 44 -15 -8 19
-6 -10 39 -7 -6 21
-6 -10 43 -7 -6 20
-5 -9 46 -1 -4 19
-4 -3 43 -5 -6 21
-4 -3 34 -3 -6 20
-8 -5 36 1 -6 18
-9 -8 34 -4 -8 18
-6 -6 38 -7 -7 16
-7 -9 32 -4 -8 18
-10 -13 38 -4 -7 19
-11 -20 30 -7 -8 18
-11 -22 17 3 -7 18
-12 -25 14 0 -9 17
-14 -28 18 -3 -10 18
-12 -28 18 -3 -10 19
-9 -23 13 -3 -9 18
-5 -20 9 1 -8 19
-6 -20 12 2 -8 19
-6 -20 19 -1 -7 20
-3 -14 20 4 -7 21
-2 -7 25 2 -11 17
-6 -10 26 1 -9 20
-6 -14 29 1 -11 21
-10 -11 28 0 -10 18
-8 -15 30 3 -13 19
-4 -10 38 1 -13 20


Summary of computational transaction
Raw Inputview raw input (R code)
Raw Outputview raw output of R engine
Computing time5 seconds
R Server'Gwilym Jenkins' @ jenkins.wessa.net
R Framework error message
Warning: there are blank lines in the 'Data X' field.
Please, use NA for missing data - blank lines are simply
 deleted and are NOT treated as missing values.

\begin{tabular}{lllllllll}
\hline
Summary of computational transaction \tabularnewline
Raw Input & view raw input (R code)  \tabularnewline
Raw Output & view raw output of R engine  \tabularnewline
Computing time & 5 seconds \tabularnewline
R Server & 'Gwilym Jenkins' @ jenkins.wessa.net \tabularnewline
R Framework error message & 
Warning: there are blank lines in the 'Data X' field.
Please, use NA for missing data - blank lines are simply
 deleted and are NOT treated as missing values.
\tabularnewline \hline \end{tabular} %Source: https://freestatistics.org/blog/index.php?pk=286473&T=0

[TABLE]
[ROW][C]Summary of computational transaction[/C][/ROW]
[ROW][C]Raw Input[/C][C]view raw input (R code) [/C][/ROW]
[ROW][C]Raw Output[/C][C]view raw output of R engine [/C][/ROW]
[ROW][C]Computing time[/C][C]5 seconds[/C][/ROW]
[ROW][C]R Server[/C][C]'Gwilym Jenkins' @ jenkins.wessa.net[/C][/ROW]
[ROW][C]R Framework error message[/C][C]
Warning: there are blank lines in the 'Data X' field.
Please, use NA for missing data - blank lines are simply
 deleted and are NOT treated as missing values.
[/C][/ROW] [/TABLE] Source: https://freestatistics.org/blog/index.php?pk=286473&T=0

Globally Unique Identifier (entire table): ba.freestatistics.org/blog/index.php?pk=286473&T=0

As an alternative you can also use a QR Code:  

The GUIDs for individual cells are displayed in the table below:

Summary of computational transaction
Raw Inputview raw input (R code)
Raw Outputview raw output of R engine
Computing time5 seconds
R Server'Gwilym Jenkins' @ jenkins.wessa.net
R Framework error message
Warning: there are blank lines in the 'Data X' field.
Please, use NA for missing data - blank lines are simply
 deleted and are NOT treated as missing values.


Multiple Linear Regression - Estimated Regression Equation
consumentenvertrouwen[t] = -12.4935 + 0.202386econ_situatie_12m[t] + 0.041836cons_prijzen_12m[t] + 0.193909gunstig_bel_aankopen[t] -0.389802verloop_fin_12m[t] + 0.329937fin_sit_gezinnen[t] + 0.328031`consumentenvertrouwen(t-1)`[t] + e[t]

\begin{tabular}{lllllllll}
\hline
Multiple Linear Regression - Estimated Regression Equation \tabularnewline
consumentenvertrouwen[t] =  -12.4935 +  0.202386econ_situatie_12m[t] +  0.041836cons_prijzen_12m[t] +  0.193909gunstig_bel_aankopen[t] -0.389802verloop_fin_12m[t] +  0.329937fin_sit_gezinnen[t] +  0.328031`consumentenvertrouwen(t-1)`[t]  + e[t] \tabularnewline
 \tabularnewline
\hline
\end{tabular}
%Source: https://freestatistics.org/blog/index.php?pk=286473&T=1

[TABLE]
[ROW][C]Multiple Linear Regression - Estimated Regression Equation[/C][/ROW]
[ROW][C]consumentenvertrouwen[t] =  -12.4935 +  0.202386econ_situatie_12m[t] +  0.041836cons_prijzen_12m[t] +  0.193909gunstig_bel_aankopen[t] -0.389802verloop_fin_12m[t] +  0.329937fin_sit_gezinnen[t] +  0.328031`consumentenvertrouwen(t-1)`[t]  + e[t][/C][/ROW]
[ROW][C][/C][/ROW]
[/TABLE]
Source: https://freestatistics.org/blog/index.php?pk=286473&T=1

Globally Unique Identifier (entire table): ba.freestatistics.org/blog/index.php?pk=286473&T=1

As an alternative you can also use a QR Code:  

The GUIDs for individual cells are displayed in the table below:

Multiple Linear Regression - Estimated Regression Equation
consumentenvertrouwen[t] = -12.4935 + 0.202386econ_situatie_12m[t] + 0.041836cons_prijzen_12m[t] + 0.193909gunstig_bel_aankopen[t] -0.389802verloop_fin_12m[t] + 0.329937fin_sit_gezinnen[t] + 0.328031`consumentenvertrouwen(t-1)`[t] + e[t]


Multiple Linear Regression - Ordinary Least Squares
VariableParameterS.D.T-STATH0: parameter = 02-tail p-value1-tail p-value
(Intercept)-12.49 3.704-3.3730e+00 0.001022 0.0005112
econ_situatie_12m+0.2024 0.02612+7.7500e+00 4.536e-12 2.268e-12
cons_prijzen_12m+0.04184 0.01499+2.7900e+00 0.006193 0.003096
gunstig_bel_aankopen+0.1939 0.0322+6.0220e+00 2.238e-08 1.119e-08
verloop_fin_12m-0.3898 0.1183-3.2960e+00 0.001315 0.0006576
fin_sit_gezinnen+0.3299 0.1563+2.1110e+00 0.03695 0.01848
`consumentenvertrouwen(t-1)`+0.328 0.07141+4.5940e+00 1.148e-05 5.738e-06

\begin{tabular}{lllllllll}
\hline
Multiple Linear Regression - Ordinary Least Squares \tabularnewline
Variable & Parameter & S.D. & T-STATH0: parameter = 0 & 2-tail p-value & 1-tail p-value \tabularnewline
(Intercept) & -12.49 &  3.704 & -3.3730e+00 &  0.001022 &  0.0005112 \tabularnewline
econ_situatie_12m & +0.2024 &  0.02612 & +7.7500e+00 &  4.536e-12 &  2.268e-12 \tabularnewline
cons_prijzen_12m & +0.04184 &  0.01499 & +2.7900e+00 &  0.006193 &  0.003096 \tabularnewline
gunstig_bel_aankopen & +0.1939 &  0.0322 & +6.0220e+00 &  2.238e-08 &  1.119e-08 \tabularnewline
verloop_fin_12m & -0.3898 &  0.1183 & -3.2960e+00 &  0.001315 &  0.0006576 \tabularnewline
fin_sit_gezinnen & +0.3299 &  0.1563 & +2.1110e+00 &  0.03695 &  0.01848 \tabularnewline
`consumentenvertrouwen(t-1)` & +0.328 &  0.07141 & +4.5940e+00 &  1.148e-05 &  5.738e-06 \tabularnewline
\hline
\end{tabular}
%Source: https://freestatistics.org/blog/index.php?pk=286473&T=2

[TABLE]
[ROW][C]Multiple Linear Regression - Ordinary Least Squares[/C][/ROW]
[ROW][C]Variable[/C][C]Parameter[/C][C]S.D.[/C][C]T-STATH0: parameter = 0[/C][C]2-tail p-value[/C][C]1-tail p-value[/C][/ROW]
[ROW][C](Intercept)[/C][C]-12.49[/C][C] 3.704[/C][C]-3.3730e+00[/C][C] 0.001022[/C][C] 0.0005112[/C][/ROW]
[ROW][C]econ_situatie_12m[/C][C]+0.2024[/C][C] 0.02612[/C][C]+7.7500e+00[/C][C] 4.536e-12[/C][C] 2.268e-12[/C][/ROW]
[ROW][C]cons_prijzen_12m[/C][C]+0.04184[/C][C] 0.01499[/C][C]+2.7900e+00[/C][C] 0.006193[/C][C] 0.003096[/C][/ROW]
[ROW][C]gunstig_bel_aankopen[/C][C]+0.1939[/C][C] 0.0322[/C][C]+6.0220e+00[/C][C] 2.238e-08[/C][C] 1.119e-08[/C][/ROW]
[ROW][C]verloop_fin_12m[/C][C]-0.3898[/C][C] 0.1183[/C][C]-3.2960e+00[/C][C] 0.001315[/C][C] 0.0006576[/C][/ROW]
[ROW][C]fin_sit_gezinnen[/C][C]+0.3299[/C][C] 0.1563[/C][C]+2.1110e+00[/C][C] 0.03695[/C][C] 0.01848[/C][/ROW]
[ROW][C]`consumentenvertrouwen(t-1)`[/C][C]+0.328[/C][C] 0.07141[/C][C]+4.5940e+00[/C][C] 1.148e-05[/C][C] 5.738e-06[/C][/ROW]
[/TABLE]
Source: https://freestatistics.org/blog/index.php?pk=286473&T=2

Globally Unique Identifier (entire table): ba.freestatistics.org/blog/index.php?pk=286473&T=2

As an alternative you can also use a QR Code:  

The GUIDs for individual cells are displayed in the table below:

Multiple Linear Regression - Ordinary Least Squares
VariableParameterS.D.T-STATH0: parameter = 02-tail p-value1-tail p-value
(Intercept)-12.49 3.704-3.3730e+00 0.001022 0.0005112
econ_situatie_12m+0.2024 0.02612+7.7500e+00 4.536e-12 2.268e-12
cons_prijzen_12m+0.04184 0.01499+2.7900e+00 0.006193 0.003096
gunstig_bel_aankopen+0.1939 0.0322+6.0220e+00 2.238e-08 1.119e-08
verloop_fin_12m-0.3898 0.1183-3.2960e+00 0.001315 0.0006576
fin_sit_gezinnen+0.3299 0.1563+2.1110e+00 0.03695 0.01848
`consumentenvertrouwen(t-1)`+0.328 0.07141+4.5940e+00 1.148e-05 5.738e-06


Multiple Linear Regression - Regression Statistics
Multiple R 0.9413
R-squared 0.8861
Adjusted R-squared 0.88
F-TEST (value) 145.2
F-TEST (DF numerator)6
F-TEST (DF denominator)112
p-value 0
Multiple Linear Regression - Residual Statistics
Residual Standard Deviation 2.432
Sum Squared Residuals 662.3

\begin{tabular}{lllllllll}
\hline
Multiple Linear Regression - Regression Statistics \tabularnewline
Multiple R &  0.9413 \tabularnewline
R-squared &  0.8861 \tabularnewline
Adjusted R-squared &  0.88 \tabularnewline
F-TEST (value) &  145.2 \tabularnewline
F-TEST (DF numerator) & 6 \tabularnewline
F-TEST (DF denominator) & 112 \tabularnewline
p-value &  0 \tabularnewline
Multiple Linear Regression - Residual Statistics \tabularnewline
Residual Standard Deviation &  2.432 \tabularnewline
Sum Squared Residuals &  662.3 \tabularnewline
\hline
\end{tabular}
%Source: https://freestatistics.org/blog/index.php?pk=286473&T=3

[TABLE]
[ROW][C]Multiple Linear Regression - Regression Statistics[/C][/ROW]
[ROW][C]Multiple R[/C][C] 0.9413[/C][/ROW]
[ROW][C]R-squared[/C][C] 0.8861[/C][/ROW]
[ROW][C]Adjusted R-squared[/C][C] 0.88[/C][/ROW]
[ROW][C]F-TEST (value)[/C][C] 145.2[/C][/ROW]
[ROW][C]F-TEST (DF numerator)[/C][C]6[/C][/ROW]
[ROW][C]F-TEST (DF denominator)[/C][C]112[/C][/ROW]
[ROW][C]p-value[/C][C] 0[/C][/ROW]
[ROW][C]Multiple Linear Regression - Residual Statistics[/C][/ROW]
[ROW][C]Residual Standard Deviation[/C][C] 2.432[/C][/ROW]
[ROW][C]Sum Squared Residuals[/C][C] 662.3[/C][/ROW]
[/TABLE]
Source: https://freestatistics.org/blog/index.php?pk=286473&T=3

Globally Unique Identifier (entire table): ba.freestatistics.org/blog/index.php?pk=286473&T=3

As an alternative you can also use a QR Code:  

The GUIDs for individual cells are displayed in the table below:

Multiple Linear Regression - Regression Statistics
Multiple R 0.9413
R-squared 0.8861
Adjusted R-squared 0.88
F-TEST (value) 145.2
F-TEST (DF numerator)6
F-TEST (DF denominator)112
p-value 0
Multiple Linear Regression - Residual Statistics
Residual Standard Deviation 2.432
Sum Squared Residuals 662.3


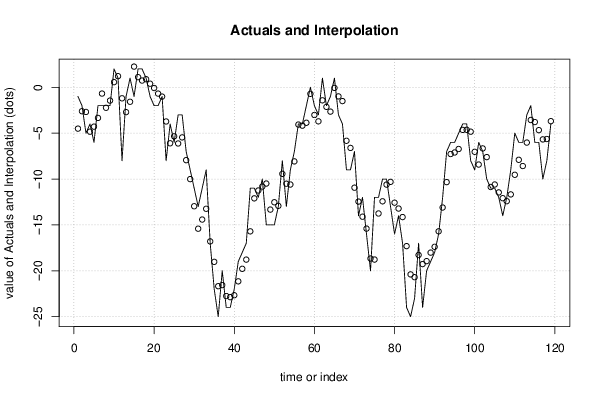
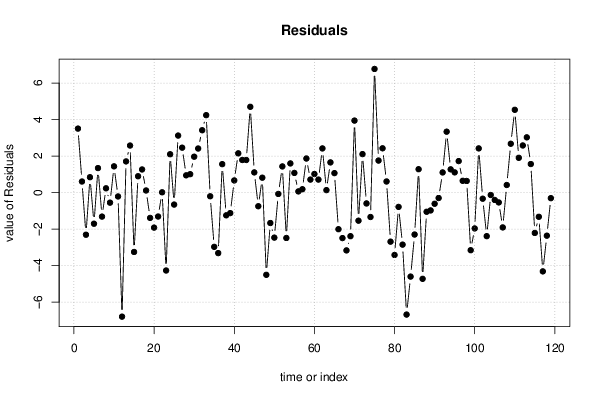
Multiple Linear Regression - Actuals, Interpolation, and Residuals
Time or IndexActualsInterpolationForecastResidualsPrediction Error
1-1-4.505 3.505
2-2-2.605 0.6053
3-5-2.688-2.312
4-4-4.841 0.8406
5-6-4.292-1.708
6-2-3.342 1.342
7-2-0.6823-1.318
8-2-2.233 0.2331
9-2-1.447-0.5531
10 2 0.5635 1.436
11 1 1.214-0.214
12-8-1.198-6.802
13-1-2.707 1.707
14 1-1.577 2.577
15-1 2.257-3.257
16 2 1.106 0.8936
17 2 0.7346 1.265
18 1 0.8867 0.1133
19-1 0.3899-1.39
20-2-0.07743-1.923
21-2-0.6865-1.313
22-1-1.014 0.01358
23-8-3.728-4.272
24-4-6.1 2.1
25-6-5.341-0.659
26-3-6.124 3.124
27-3-5.461 2.461
28-7-7.943 0.9431
29-9-10.01 1.006
30-11-12.97 1.965
31-13-15.41 2.414
32-11-14.42 3.415
33-9-13.24 4.241
34-17-16.8-0.204
35-22-19.02-2.976
36-25-21.68-3.319
37-20-21.56 1.557
38-24-22.75-1.248
39-24-22.87-1.127
40-22-22.66 0.6638
41-19-21.15 2.15
42-18-19.78 1.784
43-17-18.78 1.784
44-11-15.7 4.7
45-11-12.1 1.104
46-12-11.25-0.7504
47-10-10.82 0.8151
48-15-10.49-4.509
49-15-13.33-1.669
50-15-12.53-2.469
51-13-12.92-0.0768
52-8-9.432 1.432
53-13-10.51-2.49
54-9-10.6 1.596
55-7-8.076 1.076
56-4-4.063 0.06324
57-4-4.182 0.1818
58-2-3.865 1.865
59 0-0.7113 0.7113
60-2-3.016 1.016
61-3-3.711 0.7105
62 1-1.419 2.419
63-2-2.132 0.1323
64-1-2.652 1.652
65 1-0.06409 1.064
66-3-0.99-2.01
67-4-1.504-2.496
68-9-5.83-3.17
69-9-6.608-2.392
70-7-10.94 3.944
71-14-12.46-1.542
72-12-14.11 2.108
73-16-15.4-0.5978
74-20-18.66-1.341
75-12-18.77 6.775
76-12-13.75 1.754
77-10-12.43 2.426
78-10-10.61 0.6065
79-13-10.31-2.692
80-16-12.58-3.422
81-14-13.21-0.7859
82-17-14.15-2.854
83-24-17.31-6.688
84-25-20.39-4.607
85-23-20.7-2.3
86-17-18.28 1.279
87-24-19.27-4.729
88-20-18.95-1.052
89-19-18.02-0.9787
90-18-17.39-0.6138
91-16-15.7-0.3001
92-12-13.1 1.103
93-7-10.34 3.337
94-6-7.272 1.272
95-6-7.106 1.106
96-5-6.725 1.725
97-4-4.644 0.6439
98-4-4.635 0.6346
99-8-4.84-3.16
100-9-7.033-1.967
101-6-8.42 2.42
102-7-6.663-0.3372
103-10-7.609-2.391
104-11-10.87-0.1335
105-11-10.59-0.4061
106-12-11.46-0.5414
107-14-12.09-1.912
108-12-12.41 0.4146
109-9-11.68 2.676
110-5-9.536 4.536
111-6-7.904 1.904
112-6-8.581 2.581
113-3-6.025 3.025
114-2-3.564 1.564
115-6-3.785-2.215
116-6-4.671-1.329
117-10-5.68-4.32
118-8-5.637-2.363
119-4-3.692-0.3082

\begin{tabular}{lllllllll}
\hline
Multiple Linear Regression - Actuals, Interpolation, and Residuals \tabularnewline
Time or Index & Actuals & InterpolationForecast & ResidualsPrediction Error \tabularnewline
1 & -1 & -4.505 &  3.505 \tabularnewline
2 & -2 & -2.605 &  0.6053 \tabularnewline
3 & -5 & -2.688 & -2.312 \tabularnewline
4 & -4 & -4.841 &  0.8406 \tabularnewline
5 & -6 & -4.292 & -1.708 \tabularnewline
6 & -2 & -3.342 &  1.342 \tabularnewline
7 & -2 & -0.6823 & -1.318 \tabularnewline
8 & -2 & -2.233 &  0.2331 \tabularnewline
9 & -2 & -1.447 & -0.5531 \tabularnewline
10 &  2 &  0.5635 &  1.436 \tabularnewline
11 &  1 &  1.214 & -0.214 \tabularnewline
12 & -8 & -1.198 & -6.802 \tabularnewline
13 & -1 & -2.707 &  1.707 \tabularnewline
14 &  1 & -1.577 &  2.577 \tabularnewline
15 & -1 &  2.257 & -3.257 \tabularnewline
16 &  2 &  1.106 &  0.8936 \tabularnewline
17 &  2 &  0.7346 &  1.265 \tabularnewline
18 &  1 &  0.8867 &  0.1133 \tabularnewline
19 & -1 &  0.3899 & -1.39 \tabularnewline
20 & -2 & -0.07743 & -1.923 \tabularnewline
21 & -2 & -0.6865 & -1.313 \tabularnewline
22 & -1 & -1.014 &  0.01358 \tabularnewline
23 & -8 & -3.728 & -4.272 \tabularnewline
24 & -4 & -6.1 &  2.1 \tabularnewline
25 & -6 & -5.341 & -0.659 \tabularnewline
26 & -3 & -6.124 &  3.124 \tabularnewline
27 & -3 & -5.461 &  2.461 \tabularnewline
28 & -7 & -7.943 &  0.9431 \tabularnewline
29 & -9 & -10.01 &  1.006 \tabularnewline
30 & -11 & -12.97 &  1.965 \tabularnewline
31 & -13 & -15.41 &  2.414 \tabularnewline
32 & -11 & -14.42 &  3.415 \tabularnewline
33 & -9 & -13.24 &  4.241 \tabularnewline
34 & -17 & -16.8 & -0.204 \tabularnewline
35 & -22 & -19.02 & -2.976 \tabularnewline
36 & -25 & -21.68 & -3.319 \tabularnewline
37 & -20 & -21.56 &  1.557 \tabularnewline
38 & -24 & -22.75 & -1.248 \tabularnewline
39 & -24 & -22.87 & -1.127 \tabularnewline
40 & -22 & -22.66 &  0.6638 \tabularnewline
41 & -19 & -21.15 &  2.15 \tabularnewline
42 & -18 & -19.78 &  1.784 \tabularnewline
43 & -17 & -18.78 &  1.784 \tabularnewline
44 & -11 & -15.7 &  4.7 \tabularnewline
45 & -11 & -12.1 &  1.104 \tabularnewline
46 & -12 & -11.25 & -0.7504 \tabularnewline
47 & -10 & -10.82 &  0.8151 \tabularnewline
48 & -15 & -10.49 & -4.509 \tabularnewline
49 & -15 & -13.33 & -1.669 \tabularnewline
50 & -15 & -12.53 & -2.469 \tabularnewline
51 & -13 & -12.92 & -0.0768 \tabularnewline
52 & -8 & -9.432 &  1.432 \tabularnewline
53 & -13 & -10.51 & -2.49 \tabularnewline
54 & -9 & -10.6 &  1.596 \tabularnewline
55 & -7 & -8.076 &  1.076 \tabularnewline
56 & -4 & -4.063 &  0.06324 \tabularnewline
57 & -4 & -4.182 &  0.1818 \tabularnewline
58 & -2 & -3.865 &  1.865 \tabularnewline
59 &  0 & -0.7113 &  0.7113 \tabularnewline
60 & -2 & -3.016 &  1.016 \tabularnewline
61 & -3 & -3.711 &  0.7105 \tabularnewline
62 &  1 & -1.419 &  2.419 \tabularnewline
63 & -2 & -2.132 &  0.1323 \tabularnewline
64 & -1 & -2.652 &  1.652 \tabularnewline
65 &  1 & -0.06409 &  1.064 \tabularnewline
66 & -3 & -0.99 & -2.01 \tabularnewline
67 & -4 & -1.504 & -2.496 \tabularnewline
68 & -9 & -5.83 & -3.17 \tabularnewline
69 & -9 & -6.608 & -2.392 \tabularnewline
70 & -7 & -10.94 &  3.944 \tabularnewline
71 & -14 & -12.46 & -1.542 \tabularnewline
72 & -12 & -14.11 &  2.108 \tabularnewline
73 & -16 & -15.4 & -0.5978 \tabularnewline
74 & -20 & -18.66 & -1.341 \tabularnewline
75 & -12 & -18.77 &  6.775 \tabularnewline
76 & -12 & -13.75 &  1.754 \tabularnewline
77 & -10 & -12.43 &  2.426 \tabularnewline
78 & -10 & -10.61 &  0.6065 \tabularnewline
79 & -13 & -10.31 & -2.692 \tabularnewline
80 & -16 & -12.58 & -3.422 \tabularnewline
81 & -14 & -13.21 & -0.7859 \tabularnewline
82 & -17 & -14.15 & -2.854 \tabularnewline
83 & -24 & -17.31 & -6.688 \tabularnewline
84 & -25 & -20.39 & -4.607 \tabularnewline
85 & -23 & -20.7 & -2.3 \tabularnewline
86 & -17 & -18.28 &  1.279 \tabularnewline
87 & -24 & -19.27 & -4.729 \tabularnewline
88 & -20 & -18.95 & -1.052 \tabularnewline
89 & -19 & -18.02 & -0.9787 \tabularnewline
90 & -18 & -17.39 & -0.6138 \tabularnewline
91 & -16 & -15.7 & -0.3001 \tabularnewline
92 & -12 & -13.1 &  1.103 \tabularnewline
93 & -7 & -10.34 &  3.337 \tabularnewline
94 & -6 & -7.272 &  1.272 \tabularnewline
95 & -6 & -7.106 &  1.106 \tabularnewline
96 & -5 & -6.725 &  1.725 \tabularnewline
97 & -4 & -4.644 &  0.6439 \tabularnewline
98 & -4 & -4.635 &  0.6346 \tabularnewline
99 & -8 & -4.84 & -3.16 \tabularnewline
100 & -9 & -7.033 & -1.967 \tabularnewline
101 & -6 & -8.42 &  2.42 \tabularnewline
102 & -7 & -6.663 & -0.3372 \tabularnewline
103 & -10 & -7.609 & -2.391 \tabularnewline
104 & -11 & -10.87 & -0.1335 \tabularnewline
105 & -11 & -10.59 & -0.4061 \tabularnewline
106 & -12 & -11.46 & -0.5414 \tabularnewline
107 & -14 & -12.09 & -1.912 \tabularnewline
108 & -12 & -12.41 &  0.4146 \tabularnewline
109 & -9 & -11.68 &  2.676 \tabularnewline
110 & -5 & -9.536 &  4.536 \tabularnewline
111 & -6 & -7.904 &  1.904 \tabularnewline
112 & -6 & -8.581 &  2.581 \tabularnewline
113 & -3 & -6.025 &  3.025 \tabularnewline
114 & -2 & -3.564 &  1.564 \tabularnewline
115 & -6 & -3.785 & -2.215 \tabularnewline
116 & -6 & -4.671 & -1.329 \tabularnewline
117 & -10 & -5.68 & -4.32 \tabularnewline
118 & -8 & -5.637 & -2.363 \tabularnewline
119 & -4 & -3.692 & -0.3082 \tabularnewline
\hline
\end{tabular}
%Source: https://freestatistics.org/blog/index.php?pk=286473&T=4

[TABLE]
[ROW][C]Multiple Linear Regression - Actuals, Interpolation, and Residuals[/C][/ROW]
[ROW][C]Time or Index[/C][C]Actuals[/C][C]InterpolationForecast[/C][C]ResidualsPrediction Error[/C][/ROW]
[ROW][C]1[/C][C]-1[/C][C]-4.505[/C][C] 3.505[/C][/ROW]
[ROW][C]2[/C][C]-2[/C][C]-2.605[/C][C] 0.6053[/C][/ROW]
[ROW][C]3[/C][C]-5[/C][C]-2.688[/C][C]-2.312[/C][/ROW]
[ROW][C]4[/C][C]-4[/C][C]-4.841[/C][C] 0.8406[/C][/ROW]
[ROW][C]5[/C][C]-6[/C][C]-4.292[/C][C]-1.708[/C][/ROW]
[ROW][C]6[/C][C]-2[/C][C]-3.342[/C][C] 1.342[/C][/ROW]
[ROW][C]7[/C][C]-2[/C][C]-0.6823[/C][C]-1.318[/C][/ROW]
[ROW][C]8[/C][C]-2[/C][C]-2.233[/C][C] 0.2331[/C][/ROW]
[ROW][C]9[/C][C]-2[/C][C]-1.447[/C][C]-0.5531[/C][/ROW]
[ROW][C]10[/C][C] 2[/C][C] 0.5635[/C][C] 1.436[/C][/ROW]
[ROW][C]11[/C][C] 1[/C][C] 1.214[/C][C]-0.214[/C][/ROW]
[ROW][C]12[/C][C]-8[/C][C]-1.198[/C][C]-6.802[/C][/ROW]
[ROW][C]13[/C][C]-1[/C][C]-2.707[/C][C] 1.707[/C][/ROW]
[ROW][C]14[/C][C] 1[/C][C]-1.577[/C][C] 2.577[/C][/ROW]
[ROW][C]15[/C][C]-1[/C][C] 2.257[/C][C]-3.257[/C][/ROW]
[ROW][C]16[/C][C] 2[/C][C] 1.106[/C][C] 0.8936[/C][/ROW]
[ROW][C]17[/C][C] 2[/C][C] 0.7346[/C][C] 1.265[/C][/ROW]
[ROW][C]18[/C][C] 1[/C][C] 0.8867[/C][C] 0.1133[/C][/ROW]
[ROW][C]19[/C][C]-1[/C][C] 0.3899[/C][C]-1.39[/C][/ROW]
[ROW][C]20[/C][C]-2[/C][C]-0.07743[/C][C]-1.923[/C][/ROW]
[ROW][C]21[/C][C]-2[/C][C]-0.6865[/C][C]-1.313[/C][/ROW]
[ROW][C]22[/C][C]-1[/C][C]-1.014[/C][C] 0.01358[/C][/ROW]
[ROW][C]23[/C][C]-8[/C][C]-3.728[/C][C]-4.272[/C][/ROW]
[ROW][C]24[/C][C]-4[/C][C]-6.1[/C][C] 2.1[/C][/ROW]
[ROW][C]25[/C][C]-6[/C][C]-5.341[/C][C]-0.659[/C][/ROW]
[ROW][C]26[/C][C]-3[/C][C]-6.124[/C][C] 3.124[/C][/ROW]
[ROW][C]27[/C][C]-3[/C][C]-5.461[/C][C] 2.461[/C][/ROW]
[ROW][C]28[/C][C]-7[/C][C]-7.943[/C][C] 0.9431[/C][/ROW]
[ROW][C]29[/C][C]-9[/C][C]-10.01[/C][C] 1.006[/C][/ROW]
[ROW][C]30[/C][C]-11[/C][C]-12.97[/C][C] 1.965[/C][/ROW]
[ROW][C]31[/C][C]-13[/C][C]-15.41[/C][C] 2.414[/C][/ROW]
[ROW][C]32[/C][C]-11[/C][C]-14.42[/C][C] 3.415[/C][/ROW]
[ROW][C]33[/C][C]-9[/C][C]-13.24[/C][C] 4.241[/C][/ROW]
[ROW][C]34[/C][C]-17[/C][C]-16.8[/C][C]-0.204[/C][/ROW]
[ROW][C]35[/C][C]-22[/C][C]-19.02[/C][C]-2.976[/C][/ROW]
[ROW][C]36[/C][C]-25[/C][C]-21.68[/C][C]-3.319[/C][/ROW]
[ROW][C]37[/C][C]-20[/C][C]-21.56[/C][C] 1.557[/C][/ROW]
[ROW][C]38[/C][C]-24[/C][C]-22.75[/C][C]-1.248[/C][/ROW]
[ROW][C]39[/C][C]-24[/C][C]-22.87[/C][C]-1.127[/C][/ROW]
[ROW][C]40[/C][C]-22[/C][C]-22.66[/C][C] 0.6638[/C][/ROW]
[ROW][C]41[/C][C]-19[/C][C]-21.15[/C][C] 2.15[/C][/ROW]
[ROW][C]42[/C][C]-18[/C][C]-19.78[/C][C] 1.784[/C][/ROW]
[ROW][C]43[/C][C]-17[/C][C]-18.78[/C][C] 1.784[/C][/ROW]
[ROW][C]44[/C][C]-11[/C][C]-15.7[/C][C] 4.7[/C][/ROW]
[ROW][C]45[/C][C]-11[/C][C]-12.1[/C][C] 1.104[/C][/ROW]
[ROW][C]46[/C][C]-12[/C][C]-11.25[/C][C]-0.7504[/C][/ROW]
[ROW][C]47[/C][C]-10[/C][C]-10.82[/C][C] 0.8151[/C][/ROW]
[ROW][C]48[/C][C]-15[/C][C]-10.49[/C][C]-4.509[/C][/ROW]
[ROW][C]49[/C][C]-15[/C][C]-13.33[/C][C]-1.669[/C][/ROW]
[ROW][C]50[/C][C]-15[/C][C]-12.53[/C][C]-2.469[/C][/ROW]
[ROW][C]51[/C][C]-13[/C][C]-12.92[/C][C]-0.0768[/C][/ROW]
[ROW][C]52[/C][C]-8[/C][C]-9.432[/C][C] 1.432[/C][/ROW]
[ROW][C]53[/C][C]-13[/C][C]-10.51[/C][C]-2.49[/C][/ROW]
[ROW][C]54[/C][C]-9[/C][C]-10.6[/C][C] 1.596[/C][/ROW]
[ROW][C]55[/C][C]-7[/C][C]-8.076[/C][C] 1.076[/C][/ROW]
[ROW][C]56[/C][C]-4[/C][C]-4.063[/C][C] 0.06324[/C][/ROW]
[ROW][C]57[/C][C]-4[/C][C]-4.182[/C][C] 0.1818[/C][/ROW]
[ROW][C]58[/C][C]-2[/C][C]-3.865[/C][C] 1.865[/C][/ROW]
[ROW][C]59[/C][C] 0[/C][C]-0.7113[/C][C] 0.7113[/C][/ROW]
[ROW][C]60[/C][C]-2[/C][C]-3.016[/C][C] 1.016[/C][/ROW]
[ROW][C]61[/C][C]-3[/C][C]-3.711[/C][C] 0.7105[/C][/ROW]
[ROW][C]62[/C][C] 1[/C][C]-1.419[/C][C] 2.419[/C][/ROW]
[ROW][C]63[/C][C]-2[/C][C]-2.132[/C][C] 0.1323[/C][/ROW]
[ROW][C]64[/C][C]-1[/C][C]-2.652[/C][C] 1.652[/C][/ROW]
[ROW][C]65[/C][C] 1[/C][C]-0.06409[/C][C] 1.064[/C][/ROW]
[ROW][C]66[/C][C]-3[/C][C]-0.99[/C][C]-2.01[/C][/ROW]
[ROW][C]67[/C][C]-4[/C][C]-1.504[/C][C]-2.496[/C][/ROW]
[ROW][C]68[/C][C]-9[/C][C]-5.83[/C][C]-3.17[/C][/ROW]
[ROW][C]69[/C][C]-9[/C][C]-6.608[/C][C]-2.392[/C][/ROW]
[ROW][C]70[/C][C]-7[/C][C]-10.94[/C][C] 3.944[/C][/ROW]
[ROW][C]71[/C][C]-14[/C][C]-12.46[/C][C]-1.542[/C][/ROW]
[ROW][C]72[/C][C]-12[/C][C]-14.11[/C][C] 2.108[/C][/ROW]
[ROW][C]73[/C][C]-16[/C][C]-15.4[/C][C]-0.5978[/C][/ROW]
[ROW][C]74[/C][C]-20[/C][C]-18.66[/C][C]-1.341[/C][/ROW]
[ROW][C]75[/C][C]-12[/C][C]-18.77[/C][C] 6.775[/C][/ROW]
[ROW][C]76[/C][C]-12[/C][C]-13.75[/C][C] 1.754[/C][/ROW]
[ROW][C]77[/C][C]-10[/C][C]-12.43[/C][C] 2.426[/C][/ROW]
[ROW][C]78[/C][C]-10[/C][C]-10.61[/C][C] 0.6065[/C][/ROW]
[ROW][C]79[/C][C]-13[/C][C]-10.31[/C][C]-2.692[/C][/ROW]
[ROW][C]80[/C][C]-16[/C][C]-12.58[/C][C]-3.422[/C][/ROW]
[ROW][C]81[/C][C]-14[/C][C]-13.21[/C][C]-0.7859[/C][/ROW]
[ROW][C]82[/C][C]-17[/C][C]-14.15[/C][C]-2.854[/C][/ROW]
[ROW][C]83[/C][C]-24[/C][C]-17.31[/C][C]-6.688[/C][/ROW]
[ROW][C]84[/C][C]-25[/C][C]-20.39[/C][C]-4.607[/C][/ROW]
[ROW][C]85[/C][C]-23[/C][C]-20.7[/C][C]-2.3[/C][/ROW]
[ROW][C]86[/C][C]-17[/C][C]-18.28[/C][C] 1.279[/C][/ROW]
[ROW][C]87[/C][C]-24[/C][C]-19.27[/C][C]-4.729[/C][/ROW]
[ROW][C]88[/C][C]-20[/C][C]-18.95[/C][C]-1.052[/C][/ROW]
[ROW][C]89[/C][C]-19[/C][C]-18.02[/C][C]-0.9787[/C][/ROW]
[ROW][C]90[/C][C]-18[/C][C]-17.39[/C][C]-0.6138[/C][/ROW]
[ROW][C]91[/C][C]-16[/C][C]-15.7[/C][C]-0.3001[/C][/ROW]
[ROW][C]92[/C][C]-12[/C][C]-13.1[/C][C] 1.103[/C][/ROW]
[ROW][C]93[/C][C]-7[/C][C]-10.34[/C][C] 3.337[/C][/ROW]
[ROW][C]94[/C][C]-6[/C][C]-7.272[/C][C] 1.272[/C][/ROW]
[ROW][C]95[/C][C]-6[/C][C]-7.106[/C][C] 1.106[/C][/ROW]
[ROW][C]96[/C][C]-5[/C][C]-6.725[/C][C] 1.725[/C][/ROW]
[ROW][C]97[/C][C]-4[/C][C]-4.644[/C][C] 0.6439[/C][/ROW]
[ROW][C]98[/C][C]-4[/C][C]-4.635[/C][C] 0.6346[/C][/ROW]
[ROW][C]99[/C][C]-8[/C][C]-4.84[/C][C]-3.16[/C][/ROW]
[ROW][C]100[/C][C]-9[/C][C]-7.033[/C][C]-1.967[/C][/ROW]
[ROW][C]101[/C][C]-6[/C][C]-8.42[/C][C] 2.42[/C][/ROW]
[ROW][C]102[/C][C]-7[/C][C]-6.663[/C][C]-0.3372[/C][/ROW]
[ROW][C]103[/C][C]-10[/C][C]-7.609[/C][C]-2.391[/C][/ROW]
[ROW][C]104[/C][C]-11[/C][C]-10.87[/C][C]-0.1335[/C][/ROW]
[ROW][C]105[/C][C]-11[/C][C]-10.59[/C][C]-0.4061[/C][/ROW]
[ROW][C]106[/C][C]-12[/C][C]-11.46[/C][C]-0.5414[/C][/ROW]
[ROW][C]107[/C][C]-14[/C][C]-12.09[/C][C]-1.912[/C][/ROW]
[ROW][C]108[/C][C]-12[/C][C]-12.41[/C][C] 0.4146[/C][/ROW]
[ROW][C]109[/C][C]-9[/C][C]-11.68[/C][C] 2.676[/C][/ROW]
[ROW][C]110[/C][C]-5[/C][C]-9.536[/C][C] 4.536[/C][/ROW]
[ROW][C]111[/C][C]-6[/C][C]-7.904[/C][C] 1.904[/C][/ROW]
[ROW][C]112[/C][C]-6[/C][C]-8.581[/C][C] 2.581[/C][/ROW]
[ROW][C]113[/C][C]-3[/C][C]-6.025[/C][C] 3.025[/C][/ROW]
[ROW][C]114[/C][C]-2[/C][C]-3.564[/C][C] 1.564[/C][/ROW]
[ROW][C]115[/C][C]-6[/C][C]-3.785[/C][C]-2.215[/C][/ROW]
[ROW][C]116[/C][C]-6[/C][C]-4.671[/C][C]-1.329[/C][/ROW]
[ROW][C]117[/C][C]-10[/C][C]-5.68[/C][C]-4.32[/C][/ROW]
[ROW][C]118[/C][C]-8[/C][C]-5.637[/C][C]-2.363[/C][/ROW]
[ROW][C]119[/C][C]-4[/C][C]-3.692[/C][C]-0.3082[/C][/ROW]
[/TABLE]
Source: https://freestatistics.org/blog/index.php?pk=286473&T=4

Globally Unique Identifier (entire table): ba.freestatistics.org/blog/index.php?pk=286473&T=4

As an alternative you can also use a QR Code:  

The GUIDs for individual cells are displayed in the table below:

Multiple Linear Regression - Actuals, Interpolation, and Residuals
Time or IndexActualsInterpolationForecastResidualsPrediction Error
1-1-4.505 3.505
2-2-2.605 0.6053
3-5-2.688-2.312
4-4-4.841 0.8406
5-6-4.292-1.708
6-2-3.342 1.342
7-2-0.6823-1.318
8-2-2.233 0.2331
9-2-1.447-0.5531
10 2 0.5635 1.436
11 1 1.214-0.214
12-8-1.198-6.802
13-1-2.707 1.707
14 1-1.577 2.577
15-1 2.257-3.257
16 2 1.106 0.8936
17 2 0.7346 1.265
18 1 0.8867 0.1133
19-1 0.3899-1.39
20-2-0.07743-1.923
21-2-0.6865-1.313
22-1-1.014 0.01358
23-8-3.728-4.272
24-4-6.1 2.1
25-6-5.341-0.659
26-3-6.124 3.124
27-3-5.461 2.461
28-7-7.943 0.9431
29-9-10.01 1.006
30-11-12.97 1.965
31-13-15.41 2.414
32-11-14.42 3.415
33-9-13.24 4.241
34-17-16.8-0.204
35-22-19.02-2.976
36-25-21.68-3.319
37-20-21.56 1.557
38-24-22.75-1.248
39-24-22.87-1.127
40-22-22.66 0.6638
41-19-21.15 2.15
42-18-19.78 1.784
43-17-18.78 1.784
44-11-15.7 4.7
45-11-12.1 1.104
46-12-11.25-0.7504
47-10-10.82 0.8151
48-15-10.49-4.509
49-15-13.33-1.669
50-15-12.53-2.469
51-13-12.92-0.0768
52-8-9.432 1.432
53-13-10.51-2.49
54-9-10.6 1.596
55-7-8.076 1.076
56-4-4.063 0.06324
57-4-4.182 0.1818
58-2-3.865 1.865
59 0-0.7113 0.7113
60-2-3.016 1.016
61-3-3.711 0.7105
62 1-1.419 2.419
63-2-2.132 0.1323
64-1-2.652 1.652
65 1-0.06409 1.064
66-3-0.99-2.01
67-4-1.504-2.496
68-9-5.83-3.17
69-9-6.608-2.392
70-7-10.94 3.944
71-14-12.46-1.542
72-12-14.11 2.108
73-16-15.4-0.5978
74-20-18.66-1.341
75-12-18.77 6.775
76-12-13.75 1.754
77-10-12.43 2.426
78-10-10.61 0.6065
79-13-10.31-2.692
80-16-12.58-3.422
81-14-13.21-0.7859
82-17-14.15-2.854
83-24-17.31-6.688
84-25-20.39-4.607
85-23-20.7-2.3
86-17-18.28 1.279
87-24-19.27-4.729
88-20-18.95-1.052
89-19-18.02-0.9787
90-18-17.39-0.6138
91-16-15.7-0.3001
92-12-13.1 1.103
93-7-10.34 3.337
94-6-7.272 1.272
95-6-7.106 1.106
96-5-6.725 1.725
97-4-4.644 0.6439
98-4-4.635 0.6346
99-8-4.84-3.16
100-9-7.033-1.967
101-6-8.42 2.42
102-7-6.663-0.3372
103-10-7.609-2.391
104-11-10.87-0.1335
105-11-10.59-0.4061
106-12-11.46-0.5414
107-14-12.09-1.912
108-12-12.41 0.4146
109-9-11.68 2.676
110-5-9.536 4.536
111-6-7.904 1.904
112-6-8.581 2.581
113-3-6.025 3.025
114-2-3.564 1.564
115-6-3.785-2.215
116-6-4.671-1.329
117-10-5.68-4.32
118-8-5.637-2.363
119-4-3.692-0.3082


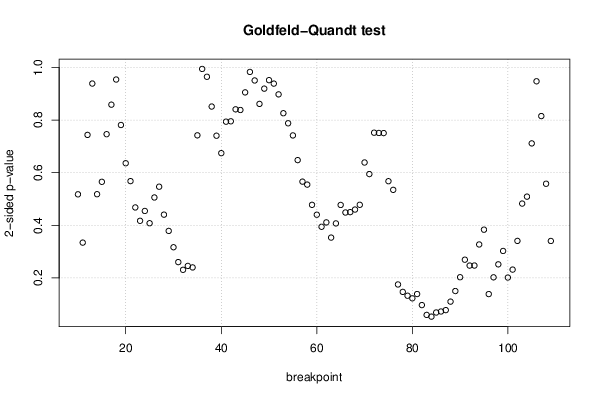
Goldfeld-Quandt test for Heteroskedasticity
p-valuesAlternative Hypothesis
breakpoint indexgreater2-sidedless
10 0.2589 0.5178 0.7411
11 0.1671 0.3342 0.8329
12 0.6282 0.7436 0.3718
13 0.5306 0.9387 0.4694
14 0.7409 0.5182 0.2591
15 0.7173 0.5653 0.2827
16 0.6269 0.7462 0.3731
17 0.5708 0.8584 0.4292
18 0.477 0.954 0.523
19 0.3906 0.7812 0.6094
20 0.318 0.6359 0.682
21 0.2839 0.5679 0.7161
22 0.2339 0.4679 0.7661
23 0.2085 0.4171 0.7915
24 0.2272 0.4545 0.7728
25 0.2039 0.4079 0.7961
26 0.2529 0.5057 0.7471
27 0.2733 0.5466 0.7267
28 0.2202 0.4405 0.7798
29 0.1893 0.3786 0.8107
30 0.1583 0.3166 0.8417
31 0.1301 0.2601 0.8699
32 0.1154 0.2308 0.8846
33 0.1228 0.2456 0.8772
34 0.12 0.2399 0.88
35 0.371 0.742 0.629
36 0.5029 0.9942 0.4971
37 0.4822 0.9645 0.5178
38 0.4257 0.8514 0.5743
39 0.3702 0.7405 0.6298
40 0.3371 0.6742 0.6629
41 0.3969 0.7938 0.6031
42 0.3977 0.7953 0.6023
43 0.4204 0.8407 0.5796
44 0.5809 0.8382 0.4191
45 0.5474 0.9052 0.4526
46 0.5086 0.9828 0.4914
47 0.4752 0.9504 0.5248
48 0.5693 0.8614 0.4307
49 0.5403 0.9194 0.4597
50 0.5242 0.9517 0.4758
51 0.4692 0.9385 0.5308
52 0.4488 0.8977 0.5512
53 0.413 0.826 0.587
54 0.3939 0.7878 0.6061
55 0.3708 0.7416 0.6292
56 0.3239 0.6478 0.6761
57 0.283 0.566 0.717
58 0.2773 0.5547 0.7227
59 0.2389 0.4778 0.7611
60 0.2201 0.4402 0.7799
61 0.1972 0.3944 0.8028
62 0.2055 0.4111 0.7945
63 0.1766 0.3533 0.8234
64 0.2036 0.4072 0.7964
65 0.2387 0.4774 0.7613
66 0.2243 0.4486 0.7757
67 0.225 0.4501 0.775
68 0.2299 0.4599 0.7701
69 0.239 0.478 0.761
70 0.3193 0.6387 0.6807
71 0.2974 0.5947 0.7026
72 0.376 0.752 0.624
73 0.3754 0.7509 0.6246
74 0.3752 0.7505 0.6248
75 0.7162 0.5676 0.2838
76 0.7326 0.5348 0.2674
77 0.9124 0.1752 0.08758
78 0.9265 0.147 0.07348
79 0.9338 0.1323 0.06617
80 0.9387 0.1226 0.06127
81 0.9306 0.1388 0.06941
82 0.9516 0.09681 0.04841
83 0.9702 0.05952 0.02976
84 0.9736 0.05285 0.02643
85 0.9657 0.06864 0.03432
86 0.9638 0.07242 0.03621
87 0.9612 0.07769 0.03885
88 0.945 0.1099 0.05497
89 0.9249 0.1502 0.07509
90 0.8987 0.2027 0.1013
91 0.8653 0.2693 0.1347
92 0.8765 0.247 0.1235
93 0.8764 0.2472 0.1236
94 0.8364 0.3272 0.1636
95 0.8083 0.3834 0.1917
96 0.9307 0.1387 0.06933
97 0.8988 0.2023 0.1012
98 0.8742 0.2517 0.1258
99 0.8488 0.3025 0.1512
100 0.8993 0.2014 0.1007
101 0.8842 0.2317 0.1158
102 0.8296 0.3407 0.1704
103 0.7587 0.4826 0.2413
104 0.7456 0.5089 0.2544
105 0.6443 0.7113 0.3557
106 0.5263 0.9474 0.4737
107 0.4076 0.8151 0.5924
108 0.2789 0.5579 0.7211
109 0.1702 0.3405 0.8298

\begin{tabular}{lllllllll}
\hline
Goldfeld-Quandt test for Heteroskedasticity \tabularnewline
p-values & Alternative Hypothesis \tabularnewline
breakpoint index & greater & 2-sided & less \tabularnewline
10 &  0.2589 &  0.5178 &  0.7411 \tabularnewline
11 &  0.1671 &  0.3342 &  0.8329 \tabularnewline
12 &  0.6282 &  0.7436 &  0.3718 \tabularnewline
13 &  0.5306 &  0.9387 &  0.4694 \tabularnewline
14 &  0.7409 &  0.5182 &  0.2591 \tabularnewline
15 &  0.7173 &  0.5653 &  0.2827 \tabularnewline
16 &  0.6269 &  0.7462 &  0.3731 \tabularnewline
17 &  0.5708 &  0.8584 &  0.4292 \tabularnewline
18 &  0.477 &  0.954 &  0.523 \tabularnewline
19 &  0.3906 &  0.7812 &  0.6094 \tabularnewline
20 &  0.318 &  0.6359 &  0.682 \tabularnewline
21 &  0.2839 &  0.5679 &  0.7161 \tabularnewline
22 &  0.2339 &  0.4679 &  0.7661 \tabularnewline
23 &  0.2085 &  0.4171 &  0.7915 \tabularnewline
24 &  0.2272 &  0.4545 &  0.7728 \tabularnewline
25 &  0.2039 &  0.4079 &  0.7961 \tabularnewline
26 &  0.2529 &  0.5057 &  0.7471 \tabularnewline
27 &  0.2733 &  0.5466 &  0.7267 \tabularnewline
28 &  0.2202 &  0.4405 &  0.7798 \tabularnewline
29 &  0.1893 &  0.3786 &  0.8107 \tabularnewline
30 &  0.1583 &  0.3166 &  0.8417 \tabularnewline
31 &  0.1301 &  0.2601 &  0.8699 \tabularnewline
32 &  0.1154 &  0.2308 &  0.8846 \tabularnewline
33 &  0.1228 &  0.2456 &  0.8772 \tabularnewline
34 &  0.12 &  0.2399 &  0.88 \tabularnewline
35 &  0.371 &  0.742 &  0.629 \tabularnewline
36 &  0.5029 &  0.9942 &  0.4971 \tabularnewline
37 &  0.4822 &  0.9645 &  0.5178 \tabularnewline
38 &  0.4257 &  0.8514 &  0.5743 \tabularnewline
39 &  0.3702 &  0.7405 &  0.6298 \tabularnewline
40 &  0.3371 &  0.6742 &  0.6629 \tabularnewline
41 &  0.3969 &  0.7938 &  0.6031 \tabularnewline
42 &  0.3977 &  0.7953 &  0.6023 \tabularnewline
43 &  0.4204 &  0.8407 &  0.5796 \tabularnewline
44 &  0.5809 &  0.8382 &  0.4191 \tabularnewline
45 &  0.5474 &  0.9052 &  0.4526 \tabularnewline
46 &  0.5086 &  0.9828 &  0.4914 \tabularnewline
47 &  0.4752 &  0.9504 &  0.5248 \tabularnewline
48 &  0.5693 &  0.8614 &  0.4307 \tabularnewline
49 &  0.5403 &  0.9194 &  0.4597 \tabularnewline
50 &  0.5242 &  0.9517 &  0.4758 \tabularnewline
51 &  0.4692 &  0.9385 &  0.5308 \tabularnewline
52 &  0.4488 &  0.8977 &  0.5512 \tabularnewline
53 &  0.413 &  0.826 &  0.587 \tabularnewline
54 &  0.3939 &  0.7878 &  0.6061 \tabularnewline
55 &  0.3708 &  0.7416 &  0.6292 \tabularnewline
56 &  0.3239 &  0.6478 &  0.6761 \tabularnewline
57 &  0.283 &  0.566 &  0.717 \tabularnewline
58 &  0.2773 &  0.5547 &  0.7227 \tabularnewline
59 &  0.2389 &  0.4778 &  0.7611 \tabularnewline
60 &  0.2201 &  0.4402 &  0.7799 \tabularnewline
61 &  0.1972 &  0.3944 &  0.8028 \tabularnewline
62 &  0.2055 &  0.4111 &  0.7945 \tabularnewline
63 &  0.1766 &  0.3533 &  0.8234 \tabularnewline
64 &  0.2036 &  0.4072 &  0.7964 \tabularnewline
65 &  0.2387 &  0.4774 &  0.7613 \tabularnewline
66 &  0.2243 &  0.4486 &  0.7757 \tabularnewline
67 &  0.225 &  0.4501 &  0.775 \tabularnewline
68 &  0.2299 &  0.4599 &  0.7701 \tabularnewline
69 &  0.239 &  0.478 &  0.761 \tabularnewline
70 &  0.3193 &  0.6387 &  0.6807 \tabularnewline
71 &  0.2974 &  0.5947 &  0.7026 \tabularnewline
72 &  0.376 &  0.752 &  0.624 \tabularnewline
73 &  0.3754 &  0.7509 &  0.6246 \tabularnewline
74 &  0.3752 &  0.7505 &  0.6248 \tabularnewline
75 &  0.7162 &  0.5676 &  0.2838 \tabularnewline
76 &  0.7326 &  0.5348 &  0.2674 \tabularnewline
77 &  0.9124 &  0.1752 &  0.08758 \tabularnewline
78 &  0.9265 &  0.147 &  0.07348 \tabularnewline
79 &  0.9338 &  0.1323 &  0.06617 \tabularnewline
80 &  0.9387 &  0.1226 &  0.06127 \tabularnewline
81 &  0.9306 &  0.1388 &  0.06941 \tabularnewline
82 &  0.9516 &  0.09681 &  0.04841 \tabularnewline
83 &  0.9702 &  0.05952 &  0.02976 \tabularnewline
84 &  0.9736 &  0.05285 &  0.02643 \tabularnewline
85 &  0.9657 &  0.06864 &  0.03432 \tabularnewline
86 &  0.9638 &  0.07242 &  0.03621 \tabularnewline
87 &  0.9612 &  0.07769 &  0.03885 \tabularnewline
88 &  0.945 &  0.1099 &  0.05497 \tabularnewline
89 &  0.9249 &  0.1502 &  0.07509 \tabularnewline
90 &  0.8987 &  0.2027 &  0.1013 \tabularnewline
91 &  0.8653 &  0.2693 &  0.1347 \tabularnewline
92 &  0.8765 &  0.247 &  0.1235 \tabularnewline
93 &  0.8764 &  0.2472 &  0.1236 \tabularnewline
94 &  0.8364 &  0.3272 &  0.1636 \tabularnewline
95 &  0.8083 &  0.3834 &  0.1917 \tabularnewline
96 &  0.9307 &  0.1387 &  0.06933 \tabularnewline
97 &  0.8988 &  0.2023 &  0.1012 \tabularnewline
98 &  0.8742 &  0.2517 &  0.1258 \tabularnewline
99 &  0.8488 &  0.3025 &  0.1512 \tabularnewline
100 &  0.8993 &  0.2014 &  0.1007 \tabularnewline
101 &  0.8842 &  0.2317 &  0.1158 \tabularnewline
102 &  0.8296 &  0.3407 &  0.1704 \tabularnewline
103 &  0.7587 &  0.4826 &  0.2413 \tabularnewline
104 &  0.7456 &  0.5089 &  0.2544 \tabularnewline
105 &  0.6443 &  0.7113 &  0.3557 \tabularnewline
106 &  0.5263 &  0.9474 &  0.4737 \tabularnewline
107 &  0.4076 &  0.8151 &  0.5924 \tabularnewline
108 &  0.2789 &  0.5579 &  0.7211 \tabularnewline
109 &  0.1702 &  0.3405 &  0.8298 \tabularnewline
\hline
\end{tabular}
%Source: https://freestatistics.org/blog/index.php?pk=286473&T=5

[TABLE]
[ROW][C]Goldfeld-Quandt test for Heteroskedasticity[/C][/ROW]
[ROW][C]p-values[/C][C]Alternative Hypothesis[/C][/ROW]
[ROW][C]breakpoint index[/C][C]greater[/C][C]2-sided[/C][C]less[/C][/ROW]
[ROW][C]10[/C][C] 0.2589[/C][C] 0.5178[/C][C] 0.7411[/C][/ROW]
[ROW][C]11[/C][C] 0.1671[/C][C] 0.3342[/C][C] 0.8329[/C][/ROW]
[ROW][C]12[/C][C] 0.6282[/C][C] 0.7436[/C][C] 0.3718[/C][/ROW]
[ROW][C]13[/C][C] 0.5306[/C][C] 0.9387[/C][C] 0.4694[/C][/ROW]
[ROW][C]14[/C][C] 0.7409[/C][C] 0.5182[/C][C] 0.2591[/C][/ROW]
[ROW][C]15[/C][C] 0.7173[/C][C] 0.5653[/C][C] 0.2827[/C][/ROW]
[ROW][C]16[/C][C] 0.6269[/C][C] 0.7462[/C][C] 0.3731[/C][/ROW]
[ROW][C]17[/C][C] 0.5708[/C][C] 0.8584[/C][C] 0.4292[/C][/ROW]
[ROW][C]18[/C][C] 0.477[/C][C] 0.954[/C][C] 0.523[/C][/ROW]
[ROW][C]19[/C][C] 0.3906[/C][C] 0.7812[/C][C] 0.6094[/C][/ROW]
[ROW][C]20[/C][C] 0.318[/C][C] 0.6359[/C][C] 0.682[/C][/ROW]
[ROW][C]21[/C][C] 0.2839[/C][C] 0.5679[/C][C] 0.7161[/C][/ROW]
[ROW][C]22[/C][C] 0.2339[/C][C] 0.4679[/C][C] 0.7661[/C][/ROW]
[ROW][C]23[/C][C] 0.2085[/C][C] 0.4171[/C][C] 0.7915[/C][/ROW]
[ROW][C]24[/C][C] 0.2272[/C][C] 0.4545[/C][C] 0.7728[/C][/ROW]
[ROW][C]25[/C][C] 0.2039[/C][C] 0.4079[/C][C] 0.7961[/C][/ROW]
[ROW][C]26[/C][C] 0.2529[/C][C] 0.5057[/C][C] 0.7471[/C][/ROW]
[ROW][C]27[/C][C] 0.2733[/C][C] 0.5466[/C][C] 0.7267[/C][/ROW]
[ROW][C]28[/C][C] 0.2202[/C][C] 0.4405[/C][C] 0.7798[/C][/ROW]
[ROW][C]29[/C][C] 0.1893[/C][C] 0.3786[/C][C] 0.8107[/C][/ROW]
[ROW][C]30[/C][C] 0.1583[/C][C] 0.3166[/C][C] 0.8417[/C][/ROW]
[ROW][C]31[/C][C] 0.1301[/C][C] 0.2601[/C][C] 0.8699[/C][/ROW]
[ROW][C]32[/C][C] 0.1154[/C][C] 0.2308[/C][C] 0.8846[/C][/ROW]
[ROW][C]33[/C][C] 0.1228[/C][C] 0.2456[/C][C] 0.8772[/C][/ROW]
[ROW][C]34[/C][C] 0.12[/C][C] 0.2399[/C][C] 0.88[/C][/ROW]
[ROW][C]35[/C][C] 0.371[/C][C] 0.742[/C][C] 0.629[/C][/ROW]
[ROW][C]36[/C][C] 0.5029[/C][C] 0.9942[/C][C] 0.4971[/C][/ROW]
[ROW][C]37[/C][C] 0.4822[/C][C] 0.9645[/C][C] 0.5178[/C][/ROW]
[ROW][C]38[/C][C] 0.4257[/C][C] 0.8514[/C][C] 0.5743[/C][/ROW]
[ROW][C]39[/C][C] 0.3702[/C][C] 0.7405[/C][C] 0.6298[/C][/ROW]
[ROW][C]40[/C][C] 0.3371[/C][C] 0.6742[/C][C] 0.6629[/C][/ROW]
[ROW][C]41[/C][C] 0.3969[/C][C] 0.7938[/C][C] 0.6031[/C][/ROW]
[ROW][C]42[/C][C] 0.3977[/C][C] 0.7953[/C][C] 0.6023[/C][/ROW]
[ROW][C]43[/C][C] 0.4204[/C][C] 0.8407[/C][C] 0.5796[/C][/ROW]
[ROW][C]44[/C][C] 0.5809[/C][C] 0.8382[/C][C] 0.4191[/C][/ROW]
[ROW][C]45[/C][C] 0.5474[/C][C] 0.9052[/C][C] 0.4526[/C][/ROW]
[ROW][C]46[/C][C] 0.5086[/C][C] 0.9828[/C][C] 0.4914[/C][/ROW]
[ROW][C]47[/C][C] 0.4752[/C][C] 0.9504[/C][C] 0.5248[/C][/ROW]
[ROW][C]48[/C][C] 0.5693[/C][C] 0.8614[/C][C] 0.4307[/C][/ROW]
[ROW][C]49[/C][C] 0.5403[/C][C] 0.9194[/C][C] 0.4597[/C][/ROW]
[ROW][C]50[/C][C] 0.5242[/C][C] 0.9517[/C][C] 0.4758[/C][/ROW]
[ROW][C]51[/C][C] 0.4692[/C][C] 0.9385[/C][C] 0.5308[/C][/ROW]
[ROW][C]52[/C][C] 0.4488[/C][C] 0.8977[/C][C] 0.5512[/C][/ROW]
[ROW][C]53[/C][C] 0.413[/C][C] 0.826[/C][C] 0.587[/C][/ROW]
[ROW][C]54[/C][C] 0.3939[/C][C] 0.7878[/C][C] 0.6061[/C][/ROW]
[ROW][C]55[/C][C] 0.3708[/C][C] 0.7416[/C][C] 0.6292[/C][/ROW]
[ROW][C]56[/C][C] 0.3239[/C][C] 0.6478[/C][C] 0.6761[/C][/ROW]
[ROW][C]57[/C][C] 0.283[/C][C] 0.566[/C][C] 0.717[/C][/ROW]
[ROW][C]58[/C][C] 0.2773[/C][C] 0.5547[/C][C] 0.7227[/C][/ROW]
[ROW][C]59[/C][C] 0.2389[/C][C] 0.4778[/C][C] 0.7611[/C][/ROW]
[ROW][C]60[/C][C] 0.2201[/C][C] 0.4402[/C][C] 0.7799[/C][/ROW]
[ROW][C]61[/C][C] 0.1972[/C][C] 0.3944[/C][C] 0.8028[/C][/ROW]
[ROW][C]62[/C][C] 0.2055[/C][C] 0.4111[/C][C] 0.7945[/C][/ROW]
[ROW][C]63[/C][C] 0.1766[/C][C] 0.3533[/C][C] 0.8234[/C][/ROW]
[ROW][C]64[/C][C] 0.2036[/C][C] 0.4072[/C][C] 0.7964[/C][/ROW]
[ROW][C]65[/C][C] 0.2387[/C][C] 0.4774[/C][C] 0.7613[/C][/ROW]
[ROW][C]66[/C][C] 0.2243[/C][C] 0.4486[/C][C] 0.7757[/C][/ROW]
[ROW][C]67[/C][C] 0.225[/C][C] 0.4501[/C][C] 0.775[/C][/ROW]
[ROW][C]68[/C][C] 0.2299[/C][C] 0.4599[/C][C] 0.7701[/C][/ROW]
[ROW][C]69[/C][C] 0.239[/C][C] 0.478[/C][C] 0.761[/C][/ROW]
[ROW][C]70[/C][C] 0.3193[/C][C] 0.6387[/C][C] 0.6807[/C][/ROW]
[ROW][C]71[/C][C] 0.2974[/C][C] 0.5947[/C][C] 0.7026[/C][/ROW]
[ROW][C]72[/C][C] 0.376[/C][C] 0.752[/C][C] 0.624[/C][/ROW]
[ROW][C]73[/C][C] 0.3754[/C][C] 0.7509[/C][C] 0.6246[/C][/ROW]
[ROW][C]74[/C][C] 0.3752[/C][C] 0.7505[/C][C] 0.6248[/C][/ROW]
[ROW][C]75[/C][C] 0.7162[/C][C] 0.5676[/C][C] 0.2838[/C][/ROW]
[ROW][C]76[/C][C] 0.7326[/C][C] 0.5348[/C][C] 0.2674[/C][/ROW]
[ROW][C]77[/C][C] 0.9124[/C][C] 0.1752[/C][C] 0.08758[/C][/ROW]
[ROW][C]78[/C][C] 0.9265[/C][C] 0.147[/C][C] 0.07348[/C][/ROW]
[ROW][C]79[/C][C] 0.9338[/C][C] 0.1323[/C][C] 0.06617[/C][/ROW]
[ROW][C]80[/C][C] 0.9387[/C][C] 0.1226[/C][C] 0.06127[/C][/ROW]
[ROW][C]81[/C][C] 0.9306[/C][C] 0.1388[/C][C] 0.06941[/C][/ROW]
[ROW][C]82[/C][C] 0.9516[/C][C] 0.09681[/C][C] 0.04841[/C][/ROW]
[ROW][C]83[/C][C] 0.9702[/C][C] 0.05952[/C][C] 0.02976[/C][/ROW]
[ROW][C]84[/C][C] 0.9736[/C][C] 0.05285[/C][C] 0.02643[/C][/ROW]
[ROW][C]85[/C][C] 0.9657[/C][C] 0.06864[/C][C] 0.03432[/C][/ROW]
[ROW][C]86[/C][C] 0.9638[/C][C] 0.07242[/C][C] 0.03621[/C][/ROW]
[ROW][C]87[/C][C] 0.9612[/C][C] 0.07769[/C][C] 0.03885[/C][/ROW]
[ROW][C]88[/C][C] 0.945[/C][C] 0.1099[/C][C] 0.05497[/C][/ROW]
[ROW][C]89[/C][C] 0.9249[/C][C] 0.1502[/C][C] 0.07509[/C][/ROW]
[ROW][C]90[/C][C] 0.8987[/C][C] 0.2027[/C][C] 0.1013[/C][/ROW]
[ROW][C]91[/C][C] 0.8653[/C][C] 0.2693[/C][C] 0.1347[/C][/ROW]
[ROW][C]92[/C][C] 0.8765[/C][C] 0.247[/C][C] 0.1235[/C][/ROW]
[ROW][C]93[/C][C] 0.8764[/C][C] 0.2472[/C][C] 0.1236[/C][/ROW]
[ROW][C]94[/C][C] 0.8364[/C][C] 0.3272[/C][C] 0.1636[/C][/ROW]
[ROW][C]95[/C][C] 0.8083[/C][C] 0.3834[/C][C] 0.1917[/C][/ROW]
[ROW][C]96[/C][C] 0.9307[/C][C] 0.1387[/C][C] 0.06933[/C][/ROW]
[ROW][C]97[/C][C] 0.8988[/C][C] 0.2023[/C][C] 0.1012[/C][/ROW]
[ROW][C]98[/C][C] 0.8742[/C][C] 0.2517[/C][C] 0.1258[/C][/ROW]
[ROW][C]99[/C][C] 0.8488[/C][C] 0.3025[/C][C] 0.1512[/C][/ROW]
[ROW][C]100[/C][C] 0.8993[/C][C] 0.2014[/C][C] 0.1007[/C][/ROW]
[ROW][C]101[/C][C] 0.8842[/C][C] 0.2317[/C][C] 0.1158[/C][/ROW]
[ROW][C]102[/C][C] 0.8296[/C][C] 0.3407[/C][C] 0.1704[/C][/ROW]
[ROW][C]103[/C][C] 0.7587[/C][C] 0.4826[/C][C] 0.2413[/C][/ROW]
[ROW][C]104[/C][C] 0.7456[/C][C] 0.5089[/C][C] 0.2544[/C][/ROW]
[ROW][C]105[/C][C] 0.6443[/C][C] 0.7113[/C][C] 0.3557[/C][/ROW]
[ROW][C]106[/C][C] 0.5263[/C][C] 0.9474[/C][C] 0.4737[/C][/ROW]
[ROW][C]107[/C][C] 0.4076[/C][C] 0.8151[/C][C] 0.5924[/C][/ROW]
[ROW][C]108[/C][C] 0.2789[/C][C] 0.5579[/C][C] 0.7211[/C][/ROW]
[ROW][C]109[/C][C] 0.1702[/C][C] 0.3405[/C][C] 0.8298[/C][/ROW]
[/TABLE]
Source: https://freestatistics.org/blog/index.php?pk=286473&T=5

Globally Unique Identifier (entire table): ba.freestatistics.org/blog/index.php?pk=286473&T=5

As an alternative you can also use a QR Code:  

The GUIDs for individual cells are displayed in the table below:

Goldfeld-Quandt test for Heteroskedasticity
p-valuesAlternative Hypothesis
breakpoint indexgreater2-sidedless
10 0.2589 0.5178 0.7411
11 0.1671 0.3342 0.8329
12 0.6282 0.7436 0.3718
13 0.5306 0.9387 0.4694
14 0.7409 0.5182 0.2591
15 0.7173 0.5653 0.2827
16 0.6269 0.7462 0.3731
17 0.5708 0.8584 0.4292
18 0.477 0.954 0.523
19 0.3906 0.7812 0.6094
20 0.318 0.6359 0.682
21 0.2839 0.5679 0.7161
22 0.2339 0.4679 0.7661
23 0.2085 0.4171 0.7915
24 0.2272 0.4545 0.7728
25 0.2039 0.4079 0.7961
26 0.2529 0.5057 0.7471
27 0.2733 0.5466 0.7267
28 0.2202 0.4405 0.7798
29 0.1893 0.3786 0.8107
30 0.1583 0.3166 0.8417
31 0.1301 0.2601 0.8699
32 0.1154 0.2308 0.8846
33 0.1228 0.2456 0.8772
34 0.12 0.2399 0.88
35 0.371 0.742 0.629
36 0.5029 0.9942 0.4971
37 0.4822 0.9645 0.5178
38 0.4257 0.8514 0.5743
39 0.3702 0.7405 0.6298
40 0.3371 0.6742 0.6629
41 0.3969 0.7938 0.6031
42 0.3977 0.7953 0.6023
43 0.4204 0.8407 0.5796
44 0.5809 0.8382 0.4191
45 0.5474 0.9052 0.4526
46 0.5086 0.9828 0.4914
47 0.4752 0.9504 0.5248
48 0.5693 0.8614 0.4307
49 0.5403 0.9194 0.4597
50 0.5242 0.9517 0.4758
51 0.4692 0.9385 0.5308
52 0.4488 0.8977 0.5512
53 0.413 0.826 0.587
54 0.3939 0.7878 0.6061
55 0.3708 0.7416 0.6292
56 0.3239 0.6478 0.6761
57 0.283 0.566 0.717
58 0.2773 0.5547 0.7227
59 0.2389 0.4778 0.7611
60 0.2201 0.4402 0.7799
61 0.1972 0.3944 0.8028
62 0.2055 0.4111 0.7945
63 0.1766 0.3533 0.8234
64 0.2036 0.4072 0.7964
65 0.2387 0.4774 0.7613
66 0.2243 0.4486 0.7757
67 0.225 0.4501 0.775
68 0.2299 0.4599 0.7701
69 0.239 0.478 0.761
70 0.3193 0.6387 0.6807
71 0.2974 0.5947 0.7026
72 0.376 0.752 0.624
73 0.3754 0.7509 0.6246
74 0.3752 0.7505 0.6248
75 0.7162 0.5676 0.2838
76 0.7326 0.5348 0.2674
77 0.9124 0.1752 0.08758
78 0.9265 0.147 0.07348
79 0.9338 0.1323 0.06617
80 0.9387 0.1226 0.06127
81 0.9306 0.1388 0.06941
82 0.9516 0.09681 0.04841
83 0.9702 0.05952 0.02976
84 0.9736 0.05285 0.02643
85 0.9657 0.06864 0.03432
86 0.9638 0.07242 0.03621
87 0.9612 0.07769 0.03885
88 0.945 0.1099 0.05497
89 0.9249 0.1502 0.07509
90 0.8987 0.2027 0.1013
91 0.8653 0.2693 0.1347
92 0.8765 0.247 0.1235
93 0.8764 0.2472 0.1236
94 0.8364 0.3272 0.1636
95 0.8083 0.3834 0.1917
96 0.9307 0.1387 0.06933
97 0.8988 0.2023 0.1012
98 0.8742 0.2517 0.1258
99 0.8488 0.3025 0.1512
100 0.8993 0.2014 0.1007
101 0.8842 0.2317 0.1158
102 0.8296 0.3407 0.1704
103 0.7587 0.4826 0.2413
104 0.7456 0.5089 0.2544
105 0.6443 0.7113 0.3557
106 0.5263 0.9474 0.4737
107 0.4076 0.8151 0.5924
108 0.2789 0.5579 0.7211
109 0.1702 0.3405 0.8298


Meta Analysis of Goldfeld-Quandt test for Heteroskedasticity
Description# significant tests% significant testsOK/NOK
1% type I error level0 0OK
5% type I error level00OK
10% type I error level60.06OK

\begin{tabular}{lllllllll}
\hline
Meta Analysis of Goldfeld-Quandt test for Heteroskedasticity \tabularnewline
Description & # significant tests & % significant tests & OK/NOK \tabularnewline
1% type I error level & 0 &  0 & OK \tabularnewline
5% type I error level & 0 & 0 & OK \tabularnewline
10% type I error level & 6 & 0.06 & OK \tabularnewline
\hline
\end{tabular}
%Source: https://freestatistics.org/blog/index.php?pk=286473&T=6

[TABLE]
[ROW][C]Meta Analysis of Goldfeld-Quandt test for Heteroskedasticity[/C][/ROW]
[ROW][C]Description[/C][C]# significant tests[/C][C]% significant tests[/C][C]OK/NOK[/C][/ROW]
[ROW][C]1% type I error level[/C][C]0[/C][C] 0[/C][C]OK[/C][/ROW]
[ROW][C]5% type I error level[/C][C]0[/C][C]0[/C][C]OK[/C][/ROW]
[ROW][C]10% type I error level[/C][C]6[/C][C]0.06[/C][C]OK[/C][/ROW]
[/TABLE]
Source: https://freestatistics.org/blog/index.php?pk=286473&T=6

Globally Unique Identifier (entire table): ba.freestatistics.org/blog/index.php?pk=286473&T=6

As an alternative you can also use a QR Code:  

The GUIDs for individual cells are displayed in the table below:

Meta Analysis of Goldfeld-Quandt test for Heteroskedasticity
Description# significant tests% significant testsOK/NOK
1% type I error level0 0OK
5% type I error level00OK
10% type I error level60.06OK


Parameters (Session):
par1 = 1 ; par2 = Do not include Seasonal Dummies ; par3 = No Linear Trend ; par4 = 1 ;
Parameters (R input):
par1 = 1 ; par2 = Do not include Seasonal Dummies ; par3 = No Linear Trend ; par4 = 1 ; par5 = ;
R code (references can be found in the software module):
par5 <- ''
par4 <- '2'
par3 <- 'No Linear Trend'
par2 <- 'Do not include Seasonal Dummies'
par1 <- '1'
library(lattice)
library(lmtest)
n25 <- 25 #minimum number of obs. for Goldfeld-Quandt test
mywarning <- ''
par1 <- as.numeric(par1)
if(is.na(par1)) {
par1 <- 1
mywarning = 'Warning: you did not specify the column number of the endogenous series! The first column was selected by default.'
}
if (par4=='') par4 <- 0
par4 <- as.numeric(par4)
if (par5=='') par5 <- 0
par5 <- as.numeric(par5)
x <- na.omit(t(y))
k <- length(x[1,])
n <- length(x[,1])
x1 <- cbind(x[,par1], x[,1:k!=par1])
mycolnames <- c(colnames(x)[par1], colnames(x)[1:k!=par1])
colnames(x1) <- mycolnames #colnames(x)[par1]
x <- x1
if (par3 == 'First Differences'){
(n <- n -1)
x2 <- array(0, dim=c(n,k), dimnames=list(1:n, paste('(1-B)',colnames(x),sep='')))
for (i in 1:n) {
for (j in 1:k) {
x2[i,j] <- x[i+1,j] - x[i,j]
}
}
x <- x2
}
if (par3 == 'Seasonal Differences (s=12)'){
(n <- n - 12)
x2 <- array(0, dim=c(n,k), dimnames=list(1:n, paste('(1-B12)',colnames(x),sep='')))
for (i in 1:n) {
for (j in 1:k) {
x2[i,j] <- x[i+12,j] - x[i,j]
}
}
x <- x2
}
if (par3 == 'First and Seasonal Differences (s=12)'){
(n <- n -1)
x2 <- array(0, dim=c(n,k), dimnames=list(1:n, paste('(1-B)',colnames(x),sep='')))
for (i in 1:n) {
for (j in 1:k) {
x2[i,j] <- x[i+1,j] - x[i,j]
}
}
x <- x2
(n <- n - 12)
x2 <- array(0, dim=c(n,k), dimnames=list(1:n, paste('(1-B12)',colnames(x),sep='')))
for (i in 1:n) {
for (j in 1:k) {
x2[i,j] <- x[i+12,j] - x[i,j]
}
}
x <- x2
}
if(par4 > 0) {
x2 <- array(0, dim=c(n-par4,par4), dimnames=list(1:(n-par4), paste(colnames(x)[par1],'(t-',1:par4,')',sep='')))
for (i in 1:(n-par4)) {
for (j in 1:par4) {
x2[i,j] <- x[i+par4-j,par1]
}
}
x <- cbind(x[(par4+1):n,], x2)
n <- n - par4
}
if(par5 > 0) {
x2 <- array(0, dim=c(n-par5*12,par5), dimnames=list(1:(n-par5*12), paste(colnames(x)[par1],'(t-',1:par5,'s)',sep='')))
for (i in 1:(n-par5*12)) {
for (j in 1:par5) {
x2[i,j] <- x[i+par5*12-j*12,par1]
}
}
x <- cbind(x[(par5*12+1):n,], x2)
n <- n - par5*12
}
if (par2 == 'Include Monthly Dummies'){
x2 <- array(0, dim=c(n,11), dimnames=list(1:n, paste('M', seq(1:11), sep ='')))
for (i in 1:11){
x2[seq(i,n,12),i] <- 1
}
x <- cbind(x, x2)
}
if (par2 == 'Include Quarterly Dummies'){
x2 <- array(0, dim=c(n,3), dimnames=list(1:n, paste('Q', seq(1:3), sep ='')))
for (i in 1:3){
x2[seq(i,n,4),i] <- 1
}
x <- cbind(x, x2)
}
(k <- length(x[n,]))
if (par3 == 'Linear Trend'){
x <- cbind(x, c(1:n))
colnames(x)[k+1] <- 't'
}
x
(k <- length(x[n,]))
head(x)
df <- as.data.frame(x)
(mylm <- lm(df))
(mysum <- summary(mylm))
if (n > n25) {
kp3 <- k + 3
nmkm3 <- n - k - 3
gqarr <- array(NA, dim=c(nmkm3-kp3+1,3))
numgqtests <- 0
numsignificant1 <- 0
numsignificant5 <- 0
numsignificant10 <- 0
for (mypoint in kp3:nmkm3) {
j <- 0
numgqtests <- numgqtests + 1
for (myalt in c('greater', 'two.sided', 'less')) {
j <- j + 1
gqarr[mypoint-kp3+1,j] <- gqtest(mylm, point=mypoint, alternative=myalt)$p.value
}
if (gqarr[mypoint-kp3+1,2] < 0.01) numsignificant1 <- numsignificant1 + 1
if (gqarr[mypoint-kp3+1,2] < 0.05) numsignificant5 <- numsignificant5 + 1
if (gqarr[mypoint-kp3+1,2] < 0.10) numsignificant10 <- numsignificant10 + 1
}
gqarr
}
bitmap(file='test0.png')
plot(x[,1], type='l', main='Actuals and Interpolation', ylab='value of Actuals and Interpolation (dots)', xlab='time or index')
points(x[,1]-mysum$resid)
grid()
dev.off()
bitmap(file='test1.png')
plot(mysum$resid, type='b', pch=19, main='Residuals', ylab='value of Residuals', xlab='time or index')
grid()
dev.off()
bitmap(file='test2.png')
hist(mysum$resid, main='Residual Histogram', xlab='values of Residuals')
grid()
dev.off()
bitmap(file='test3.png')
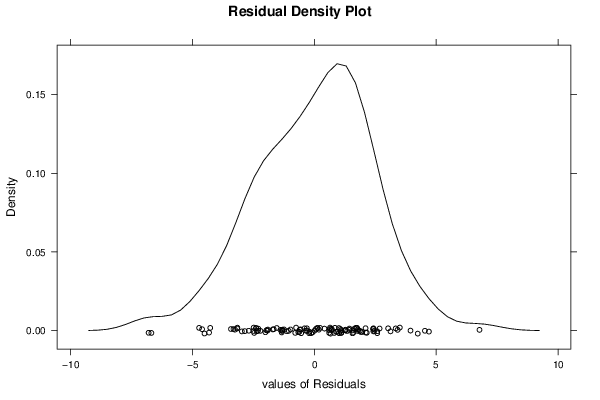
densityplot(~mysum$resid,col='black',main='Residual Density Plot', xlab='values of Residuals')
dev.off()
bitmap(file='test4.png')
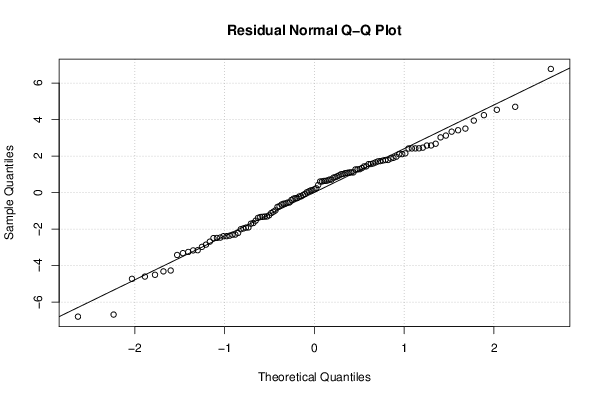
qqnorm(mysum$resid, main='Residual Normal Q-Q Plot')
qqline(mysum$resid)
grid()
dev.off()
(myerror <- as.ts(mysum$resid))
bitmap(file='test5.png')
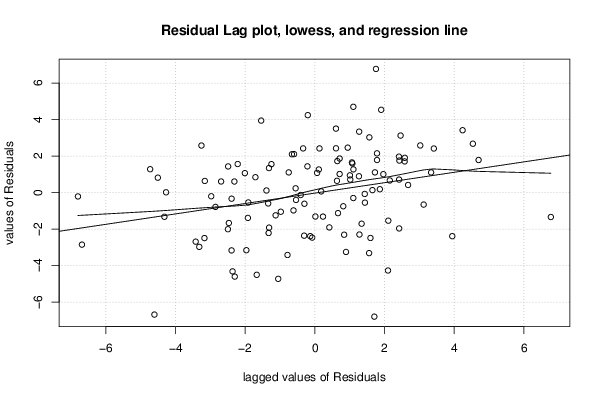
dum <- cbind(lag(myerror,k=1),myerror)
dum
dum1 <- dum[2:length(myerror),]
dum1
z <- as.data.frame(dum1)
z
plot(z,main=paste('Residual Lag plot, lowess, and regression line'), ylab='values of Residuals', xlab='lagged values of Residuals')
lines(lowess(z))
abline(lm(z))
grid()
dev.off()
bitmap(file='test6.png')
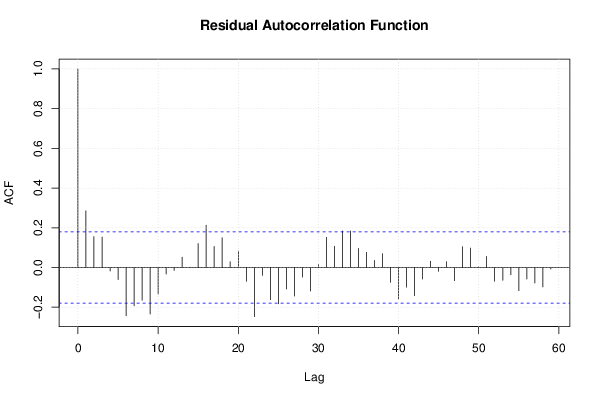
acf(mysum$resid, lag.max=length(mysum$resid)/2, main='Residual Autocorrelation Function')
grid()
dev.off()
bitmap(file='test7.png')
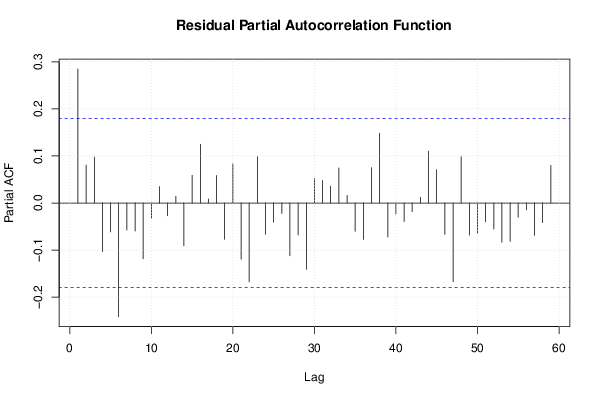
pacf(mysum$resid, lag.max=length(mysum$resid)/2, main='Residual Partial Autocorrelation Function')
grid()
dev.off()
bitmap(file='test8.png')
opar <- par(mfrow = c(2,2), oma = c(0, 0, 1.1, 0))
plot(mylm, las = 1, sub='Residual Diagnostics')
par(opar)
dev.off()
if (n > n25) {
bitmap(file='test9.png')
plot(kp3:nmkm3,gqarr[,2], main='Goldfeld-Quandt test',ylab='2-sided p-value',xlab='breakpoint')
grid()
dev.off()
}
load(file='createtable')
a<-table.start()
a<-table.row.start(a)
a<-table.element(a, 'Multiple Linear Regression - Estimated Regression Equation', 1, TRUE)
a<-table.row.end(a)
myeq <- colnames(x)[1]
myeq <- paste(myeq, '[t] = ', sep='')
for (i in 1:k){
if (mysum$coefficients[i,1] > 0) myeq <- paste(myeq, '+', '')
myeq <- paste(myeq, signif(mysum$coefficients[i,1],6), sep=' ')
if (rownames(mysum$coefficients)[i] != '(Intercept)') {
myeq <- paste(myeq, rownames(mysum$coefficients)[i], sep='')
if (rownames(mysum$coefficients)[i] != 't') myeq <- paste(myeq, '[t]', sep='')
}
}
myeq <- paste(myeq, ' + e[t]')
a<-table.row.start(a)
a<-table.element(a, myeq)
a<-table.row.end(a)
a<-table.row.start(a)
a<-table.element(a, mywarning)
a<-table.row.end(a)
a<-table.end(a)
table.save(a,file='mytable1.tab')
a<-table.start()
a<-table.row.start(a)
a<-table.element(a,hyperlink('ols1.htm','Multiple Linear Regression - Ordinary Least Squares',''), 6, TRUE)
a<-table.row.end(a)
a<-table.row.start(a)
a<-table.element(a,'Variable',header=TRUE)
a<-table.element(a,'Parameter',header=TRUE)
a<-table.element(a,'S.D.',header=TRUE)
a<-table.element(a,'T-STAT
H0: parameter = 0',header=TRUE)
a<-table.element(a,'2-tail p-value',header=TRUE)
a<-table.element(a,'1-tail p-value',header=TRUE)
a<-table.row.end(a)
for (i in 1:k){
a<-table.row.start(a)
a<-table.element(a,rownames(mysum$coefficients)[i],header=TRUE)
a<-table.element(a,formatC(signif(mysum$coefficients[i,1],5),format='g',flag='+'))
a<-table.element(a,formatC(signif(mysum$coefficients[i,2],5),format='g',flag=' '))
a<-table.element(a,formatC(signif(mysum$coefficients[i,3],4),format='e',flag='+'))
a<-table.element(a,formatC(signif(mysum$coefficients[i,4],4),format='g',flag=' '))
a<-table.element(a,formatC(signif(mysum$coefficients[i,4]/2,4),format='g',flag=' '))
a<-table.row.end(a)
}
a<-table.end(a)
table.save(a,file='mytable2.tab')
a<-table.start()
a<-table.row.start(a)
a<-table.element(a, 'Multiple Linear Regression - Regression Statistics', 2, TRUE)
a<-table.row.end(a)
a<-table.row.start(a)
a<-table.element(a, 'Multiple R',1,TRUE)
a<-table.element(a,formatC(signif(sqrt(mysum$r.squared),6),format='g',flag=' '))
a<-table.row.end(a)
a<-table.row.start(a)
a<-table.element(a, 'R-squared',1,TRUE)
a<-table.element(a,formatC(signif(mysum$r.squared,6),format='g',flag=' '))
a<-table.row.end(a)
a<-table.row.start(a)
a<-table.element(a, 'Adjusted R-squared',1,TRUE)
a<-table.element(a,formatC(signif(mysum$adj.r.squared,6),format='g',flag=' '))
a<-table.row.end(a)
a<-table.row.start(a)
a<-table.element(a, 'F-TEST (value)',1,TRUE)
a<-table.element(a,formatC(signif(mysum$fstatistic[1],6),format='g',flag=' '))
a<-table.row.end(a)
a<-table.row.start(a)
a<-table.element(a, 'F-TEST (DF numerator)',1,TRUE)
a<-table.element(a, signif(mysum$fstatistic[2],6))
a<-table.row.end(a)
a<-table.row.start(a)
a<-table.element(a, 'F-TEST (DF denominator)',1,TRUE)
a<-table.element(a, signif(mysum$fstatistic[3],6))
a<-table.row.end(a)
a<-table.row.start(a)
a<-table.element(a, 'p-value',1,TRUE)
a<-table.element(a,formatC(signif(1-pf(mysum$fstatistic[1],mysum$fstatistic[2],mysum$fstatistic[3]),6),format='g',flag=' '))
a<-table.row.end(a)
a<-table.row.start(a)
a<-table.element(a, 'Multiple Linear Regression - Residual Statistics', 2, TRUE)
a<-table.row.end(a)
a<-table.row.start(a)
a<-table.element(a, 'Residual Standard Deviation',1,TRUE)
a<-table.element(a,formatC(signif(mysum$sigma,6),format='g',flag=' '))
a<-table.row.end(a)
a<-table.row.start(a)
a<-table.element(a, 'Sum Squared Residuals',1,TRUE)
a<-table.element(a,formatC(signif(sum(myerror*myerror),6),format='g',flag=' '))
a<-table.row.end(a)
a<-table.end(a)
table.save(a,file='mytable3.tab')
if(n < 200) {
a<-table.start()
a<-table.row.start(a)
a<-table.element(a, 'Multiple Linear Regression - Actuals, Interpolation, and Residuals', 4, TRUE)
a<-table.row.end(a)
a<-table.row.start(a)
a<-table.element(a, 'Time or Index', 1, TRUE)
a<-table.element(a, 'Actuals', 1, TRUE)
a<-table.element(a, 'Interpolation
Forecast', 1, TRUE)
a<-table.element(a, 'Residuals
Prediction Error', 1, TRUE)
a<-table.row.end(a)
for (i in 1:n) {
a<-table.row.start(a)
a<-table.element(a,i, 1, TRUE)
a<-table.element(a,formatC(signif(x[i],6),format='g',flag=' '))
a<-table.element(a,formatC(signif(x[i]-mysum$resid[i],6),format='g',flag=' '))
a<-table.element(a,formatC(signif(mysum$resid[i],6),format='g',flag=' '))
a<-table.row.end(a)
}
a<-table.end(a)
table.save(a,file='mytable4.tab')
if (n > n25) {
a<-table.start()
a<-table.row.start(a)
a<-table.element(a,'Goldfeld-Quandt test for Heteroskedasticity',4,TRUE)
a<-table.row.end(a)
a<-table.row.start(a)
a<-table.element(a,'p-values',header=TRUE)
a<-table.element(a,'Alternative Hypothesis',3,header=TRUE)
a<-table.row.end(a)
a<-table.row.start(a)
a<-table.element(a,'breakpoint index',header=TRUE)
a<-table.element(a,'greater',header=TRUE)
a<-table.element(a,'2-sided',header=TRUE)
a<-table.element(a,'less',header=TRUE)
a<-table.row.end(a)
for (mypoint in kp3:nmkm3) {
a<-table.row.start(a)
a<-table.element(a,mypoint,header=TRUE)
a<-table.element(a,formatC(signif(gqarr[mypoint-kp3+1,1],6),format='g',flag=' '))
a<-table.element(a,formatC(signif(gqarr[mypoint-kp3+1,2],6),format='g',flag=' '))
a<-table.element(a,formatC(signif(gqarr[mypoint-kp3+1,3],6),format='g',flag=' '))
a<-table.row.end(a)
}
a<-table.end(a)
table.save(a,file='mytable5.tab')
a<-table.start()
a<-table.row.start(a)
a<-table.element(a,'Meta Analysis of Goldfeld-Quandt test for Heteroskedasticity',4,TRUE)
a<-table.row.end(a)
a<-table.row.start(a)
a<-table.element(a,'Description',header=TRUE)
a<-table.element(a,'# significant tests',header=TRUE)
a<-table.element(a,'% significant tests',header=TRUE)
a<-table.element(a,'OK/NOK',header=TRUE)
a<-table.row.end(a)
a<-table.row.start(a)
a<-table.element(a,'1% type I error level',header=TRUE)
a<-table.element(a,signif(numsignificant1,6))
a<-table.element(a,formatC(signif(numsignificant1/numgqtests,6),format='g',flag=' '))
if (numsignificant1/numgqtests < 0.01) dum <- 'OK' else dum <- 'NOK'
a<-table.element(a,dum)
a<-table.row.end(a)
a<-table.row.start(a)
a<-table.element(a,'5% type I error level',header=TRUE)
a<-table.element(a,signif(numsignificant5,6))
a<-table.element(a,signif(numsignificant5/numgqtests,6))
if (numsignificant5/numgqtests < 0.05) dum <- 'OK' else dum <- 'NOK'
a<-table.element(a,dum)
a<-table.row.end(a)
a<-table.row.start(a)
a<-table.element(a,'10% type I error level',header=TRUE)
a<-table.element(a,signif(numsignificant10,6))
a<-table.element(a,signif(numsignificant10/numgqtests,6))
if (numsignificant10/numgqtests < 0.1) dum <- 'OK' else dum <- 'NOK'
a<-table.element(a,dum)
a<-table.row.end(a)
a<-table.end(a)
table.save(a,file='mytable6.tab')
}
}