Free Statistics

of Irreproducible Research!

Author's title

Author*The author of this computation has been verified*
R Software Modulerwasp_exponentialsmoothing.wasp
Title produced by softwareExponential Smoothing
Date of computationTue, 15 Dec 2015 11:09:41 +0000
Cite this page as followsStatistical Computations at FreeStatistics.org, Office for Research Development and Education, URL https://freestatistics.org/blog/index.php?v=date/2015/Dec/15/t1450178283vk6qmpcmr2k3vhr.htm/, Retrieved Sat, 18 May 2024 15:20:04 +0000
Statistical Computations at FreeStatistics.org, Office for Research Development and Education, URL https://freestatistics.org/blog/index.php?pk=286466, Retrieved Sat, 18 May 2024 15:20:04 +0000
QR Codes:

Original text written by user:
IsPrivate?No (this computation is public)
User-defined keywords
Estimated Impact105
Family? (F = Feedback message, R = changed R code, M = changed R Module, P = changed Parameters, D = changed Data)
-       [Exponential Smoothing] [Double exponentia...] [2015-12-15 11:09:41] [6c9172abf40f1c7e1d0d83ef980264f4] [Current]
Feedback Forum

Post a new message
Dataseries X:
20.7
20.7
20.7
18
18
18
16.9
16.9
16.9
24.4
24.4
24.4
15.5
15.5
15.5
18.4
18.4
18.4
16.2
16.2
16.2
20.6
20.6
20.6
19.8
19.8
19.8
21.6
21.6
21.6
22.3
22.3
22.3
23.7
23.7
23.7
22.1
22.1
22.1
26.6
26.6
26.6
23.5
23.5
23.5
19.6
19.6
19.6
20
20
20
20.1
20.1
20.1
16
16
16
18.9
18.9
18.9


Summary of computational transaction
Raw Inputview raw input (R code)
Raw Outputview raw output of R engine
Computing time2 seconds
R Server'Gwilym Jenkins' @ jenkins.wessa.net

\begin{tabular}{lllllllll}
\hline
Summary of computational transaction \tabularnewline
Raw Input & view raw input (R code)  \tabularnewline
Raw Output & view raw output of R engine  \tabularnewline
Computing time & 2 seconds \tabularnewline
R Server & 'Gwilym Jenkins' @ jenkins.wessa.net \tabularnewline
\hline
\end{tabular}
%Source: https://freestatistics.org/blog/index.php?pk=286466&T=0

[TABLE]
[ROW][C]Summary of computational transaction[/C][/ROW]
[ROW][C]Raw Input[/C][C]view raw input (R code) [/C][/ROW]
[ROW][C]Raw Output[/C][C]view raw output of R engine [/C][/ROW]
[ROW][C]Computing time[/C][C]2 seconds[/C][/ROW]
[ROW][C]R Server[/C][C]'Gwilym Jenkins' @ jenkins.wessa.net[/C][/ROW]
[/TABLE]
Source: https://freestatistics.org/blog/index.php?pk=286466&T=0

Globally Unique Identifier (entire table): ba.freestatistics.org/blog/index.php?pk=286466&T=0

As an alternative you can also use a QR Code:  

The GUIDs for individual cells are displayed in the table below:

Summary of computational transaction
Raw Inputview raw input (R code)
Raw Outputview raw output of R engine
Computing time2 seconds
R Server'Gwilym Jenkins' @ jenkins.wessa.net


Estimated Parameters of Exponential Smoothing
ParameterValue
alpha1
beta0
gammaFALSE

\begin{tabular}{lllllllll}
\hline
Estimated Parameters of Exponential Smoothing \tabularnewline
Parameter & Value \tabularnewline
alpha & 1 \tabularnewline
beta & 0 \tabularnewline
gamma & FALSE \tabularnewline
\hline
\end{tabular}
%Source: https://freestatistics.org/blog/index.php?pk=286466&T=1

[TABLE]
[ROW][C]Estimated Parameters of Exponential Smoothing[/C][/ROW]
[ROW][C]Parameter[/C][C]Value[/C][/ROW]
[ROW][C]alpha[/C][C]1[/C][/ROW]
[ROW][C]beta[/C][C]0[/C][/ROW]
[ROW][C]gamma[/C][C]FALSE[/C][/ROW]
[/TABLE]
Source: https://freestatistics.org/blog/index.php?pk=286466&T=1

Globally Unique Identifier (entire table): ba.freestatistics.org/blog/index.php?pk=286466&T=1

As an alternative you can also use a QR Code:  

The GUIDs for individual cells are displayed in the table below:

Estimated Parameters of Exponential Smoothing
ParameterValue
alpha1
beta0
gammaFALSE


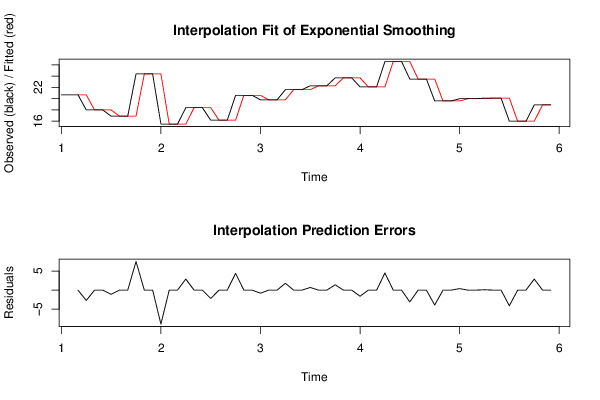
Interpolation Forecasts of Exponential Smoothing
tObservedFittedResiduals
320.720.70
41820.7-2.7
518180
618180
716.918-1.1
816.916.90
916.916.90
1024.416.97.5
1124.424.40
1224.424.40
1315.524.4-8.9
1415.515.50
1515.515.50
1618.415.52.9
1718.418.40
1818.418.40
1916.218.4-2.2
2016.216.20
2116.216.20
2220.616.24.4
2320.620.60
2420.620.60
2519.820.6-0.800000000000001
2619.819.80
2719.819.80
2821.619.81.8
2921.621.60
3021.621.60
3122.321.60.699999999999999
3222.322.30
3322.322.30
3423.722.31.4
3523.723.70
3623.723.70
3722.123.7-1.6
3822.122.10
3922.122.10
4026.622.14.5
4126.626.60
4226.626.60
4323.526.6-3.1
4423.523.50
4523.523.50
4619.623.5-3.9
4719.619.60
4819.619.60
492019.60.399999999999999
5020200
5120200
5220.1200.100000000000001
5320.120.10
5420.120.10
551620.1-4.1
5616160
5716160
5818.9162.9
5918.918.90
6018.918.90

\begin{tabular}{lllllllll}
\hline
Interpolation Forecasts of Exponential Smoothing \tabularnewline
t & Observed & Fitted & Residuals \tabularnewline
3 & 20.7 & 20.7 & 0 \tabularnewline
4 & 18 & 20.7 & -2.7 \tabularnewline
5 & 18 & 18 & 0 \tabularnewline
6 & 18 & 18 & 0 \tabularnewline
7 & 16.9 & 18 & -1.1 \tabularnewline
8 & 16.9 & 16.9 & 0 \tabularnewline
9 & 16.9 & 16.9 & 0 \tabularnewline
10 & 24.4 & 16.9 & 7.5 \tabularnewline
11 & 24.4 & 24.4 & 0 \tabularnewline
12 & 24.4 & 24.4 & 0 \tabularnewline
13 & 15.5 & 24.4 & -8.9 \tabularnewline
14 & 15.5 & 15.5 & 0 \tabularnewline
15 & 15.5 & 15.5 & 0 \tabularnewline
16 & 18.4 & 15.5 & 2.9 \tabularnewline
17 & 18.4 & 18.4 & 0 \tabularnewline
18 & 18.4 & 18.4 & 0 \tabularnewline
19 & 16.2 & 18.4 & -2.2 \tabularnewline
20 & 16.2 & 16.2 & 0 \tabularnewline
21 & 16.2 & 16.2 & 0 \tabularnewline
22 & 20.6 & 16.2 & 4.4 \tabularnewline
23 & 20.6 & 20.6 & 0 \tabularnewline
24 & 20.6 & 20.6 & 0 \tabularnewline
25 & 19.8 & 20.6 & -0.800000000000001 \tabularnewline
26 & 19.8 & 19.8 & 0 \tabularnewline
27 & 19.8 & 19.8 & 0 \tabularnewline
28 & 21.6 & 19.8 & 1.8 \tabularnewline
29 & 21.6 & 21.6 & 0 \tabularnewline
30 & 21.6 & 21.6 & 0 \tabularnewline
31 & 22.3 & 21.6 & 0.699999999999999 \tabularnewline
32 & 22.3 & 22.3 & 0 \tabularnewline
33 & 22.3 & 22.3 & 0 \tabularnewline
34 & 23.7 & 22.3 & 1.4 \tabularnewline
35 & 23.7 & 23.7 & 0 \tabularnewline
36 & 23.7 & 23.7 & 0 \tabularnewline
37 & 22.1 & 23.7 & -1.6 \tabularnewline
38 & 22.1 & 22.1 & 0 \tabularnewline
39 & 22.1 & 22.1 & 0 \tabularnewline
40 & 26.6 & 22.1 & 4.5 \tabularnewline
41 & 26.6 & 26.6 & 0 \tabularnewline
42 & 26.6 & 26.6 & 0 \tabularnewline
43 & 23.5 & 26.6 & -3.1 \tabularnewline
44 & 23.5 & 23.5 & 0 \tabularnewline
45 & 23.5 & 23.5 & 0 \tabularnewline
46 & 19.6 & 23.5 & -3.9 \tabularnewline
47 & 19.6 & 19.6 & 0 \tabularnewline
48 & 19.6 & 19.6 & 0 \tabularnewline
49 & 20 & 19.6 & 0.399999999999999 \tabularnewline
50 & 20 & 20 & 0 \tabularnewline
51 & 20 & 20 & 0 \tabularnewline
52 & 20.1 & 20 & 0.100000000000001 \tabularnewline
53 & 20.1 & 20.1 & 0 \tabularnewline
54 & 20.1 & 20.1 & 0 \tabularnewline
55 & 16 & 20.1 & -4.1 \tabularnewline
56 & 16 & 16 & 0 \tabularnewline
57 & 16 & 16 & 0 \tabularnewline
58 & 18.9 & 16 & 2.9 \tabularnewline
59 & 18.9 & 18.9 & 0 \tabularnewline
60 & 18.9 & 18.9 & 0 \tabularnewline
\hline
\end{tabular}
%Source: https://freestatistics.org/blog/index.php?pk=286466&T=2

[TABLE]
[ROW][C]Interpolation Forecasts of Exponential Smoothing[/C][/ROW]
[ROW][C]t[/C][C]Observed[/C][C]Fitted[/C][C]Residuals[/C][/ROW]
[ROW][C]3[/C][C]20.7[/C][C]20.7[/C][C]0[/C][/ROW]
[ROW][C]4[/C][C]18[/C][C]20.7[/C][C]-2.7[/C][/ROW]
[ROW][C]5[/C][C]18[/C][C]18[/C][C]0[/C][/ROW]
[ROW][C]6[/C][C]18[/C][C]18[/C][C]0[/C][/ROW]
[ROW][C]7[/C][C]16.9[/C][C]18[/C][C]-1.1[/C][/ROW]
[ROW][C]8[/C][C]16.9[/C][C]16.9[/C][C]0[/C][/ROW]
[ROW][C]9[/C][C]16.9[/C][C]16.9[/C][C]0[/C][/ROW]
[ROW][C]10[/C][C]24.4[/C][C]16.9[/C][C]7.5[/C][/ROW]
[ROW][C]11[/C][C]24.4[/C][C]24.4[/C][C]0[/C][/ROW]
[ROW][C]12[/C][C]24.4[/C][C]24.4[/C][C]0[/C][/ROW]
[ROW][C]13[/C][C]15.5[/C][C]24.4[/C][C]-8.9[/C][/ROW]
[ROW][C]14[/C][C]15.5[/C][C]15.5[/C][C]0[/C][/ROW]
[ROW][C]15[/C][C]15.5[/C][C]15.5[/C][C]0[/C][/ROW]
[ROW][C]16[/C][C]18.4[/C][C]15.5[/C][C]2.9[/C][/ROW]
[ROW][C]17[/C][C]18.4[/C][C]18.4[/C][C]0[/C][/ROW]
[ROW][C]18[/C][C]18.4[/C][C]18.4[/C][C]0[/C][/ROW]
[ROW][C]19[/C][C]16.2[/C][C]18.4[/C][C]-2.2[/C][/ROW]
[ROW][C]20[/C][C]16.2[/C][C]16.2[/C][C]0[/C][/ROW]
[ROW][C]21[/C][C]16.2[/C][C]16.2[/C][C]0[/C][/ROW]
[ROW][C]22[/C][C]20.6[/C][C]16.2[/C][C]4.4[/C][/ROW]
[ROW][C]23[/C][C]20.6[/C][C]20.6[/C][C]0[/C][/ROW]
[ROW][C]24[/C][C]20.6[/C][C]20.6[/C][C]0[/C][/ROW]
[ROW][C]25[/C][C]19.8[/C][C]20.6[/C][C]-0.800000000000001[/C][/ROW]
[ROW][C]26[/C][C]19.8[/C][C]19.8[/C][C]0[/C][/ROW]
[ROW][C]27[/C][C]19.8[/C][C]19.8[/C][C]0[/C][/ROW]
[ROW][C]28[/C][C]21.6[/C][C]19.8[/C][C]1.8[/C][/ROW]
[ROW][C]29[/C][C]21.6[/C][C]21.6[/C][C]0[/C][/ROW]
[ROW][C]30[/C][C]21.6[/C][C]21.6[/C][C]0[/C][/ROW]
[ROW][C]31[/C][C]22.3[/C][C]21.6[/C][C]0.699999999999999[/C][/ROW]
[ROW][C]32[/C][C]22.3[/C][C]22.3[/C][C]0[/C][/ROW]
[ROW][C]33[/C][C]22.3[/C][C]22.3[/C][C]0[/C][/ROW]
[ROW][C]34[/C][C]23.7[/C][C]22.3[/C][C]1.4[/C][/ROW]
[ROW][C]35[/C][C]23.7[/C][C]23.7[/C][C]0[/C][/ROW]
[ROW][C]36[/C][C]23.7[/C][C]23.7[/C][C]0[/C][/ROW]
[ROW][C]37[/C][C]22.1[/C][C]23.7[/C][C]-1.6[/C][/ROW]
[ROW][C]38[/C][C]22.1[/C][C]22.1[/C][C]0[/C][/ROW]
[ROW][C]39[/C][C]22.1[/C][C]22.1[/C][C]0[/C][/ROW]
[ROW][C]40[/C][C]26.6[/C][C]22.1[/C][C]4.5[/C][/ROW]
[ROW][C]41[/C][C]26.6[/C][C]26.6[/C][C]0[/C][/ROW]
[ROW][C]42[/C][C]26.6[/C][C]26.6[/C][C]0[/C][/ROW]
[ROW][C]43[/C][C]23.5[/C][C]26.6[/C][C]-3.1[/C][/ROW]
[ROW][C]44[/C][C]23.5[/C][C]23.5[/C][C]0[/C][/ROW]
[ROW][C]45[/C][C]23.5[/C][C]23.5[/C][C]0[/C][/ROW]
[ROW][C]46[/C][C]19.6[/C][C]23.5[/C][C]-3.9[/C][/ROW]
[ROW][C]47[/C][C]19.6[/C][C]19.6[/C][C]0[/C][/ROW]
[ROW][C]48[/C][C]19.6[/C][C]19.6[/C][C]0[/C][/ROW]
[ROW][C]49[/C][C]20[/C][C]19.6[/C][C]0.399999999999999[/C][/ROW]
[ROW][C]50[/C][C]20[/C][C]20[/C][C]0[/C][/ROW]
[ROW][C]51[/C][C]20[/C][C]20[/C][C]0[/C][/ROW]
[ROW][C]52[/C][C]20.1[/C][C]20[/C][C]0.100000000000001[/C][/ROW]
[ROW][C]53[/C][C]20.1[/C][C]20.1[/C][C]0[/C][/ROW]
[ROW][C]54[/C][C]20.1[/C][C]20.1[/C][C]0[/C][/ROW]
[ROW][C]55[/C][C]16[/C][C]20.1[/C][C]-4.1[/C][/ROW]
[ROW][C]56[/C][C]16[/C][C]16[/C][C]0[/C][/ROW]
[ROW][C]57[/C][C]16[/C][C]16[/C][C]0[/C][/ROW]
[ROW][C]58[/C][C]18.9[/C][C]16[/C][C]2.9[/C][/ROW]
[ROW][C]59[/C][C]18.9[/C][C]18.9[/C][C]0[/C][/ROW]
[ROW][C]60[/C][C]18.9[/C][C]18.9[/C][C]0[/C][/ROW]
[/TABLE]
Source: https://freestatistics.org/blog/index.php?pk=286466&T=2

Globally Unique Identifier (entire table): ba.freestatistics.org/blog/index.php?pk=286466&T=2

As an alternative you can also use a QR Code:  

The GUIDs for individual cells are displayed in the table below:

Interpolation Forecasts of Exponential Smoothing
tObservedFittedResiduals
320.720.70
41820.7-2.7
518180
618180
716.918-1.1
816.916.90
916.916.90
1024.416.97.5
1124.424.40
1224.424.40
1315.524.4-8.9
1415.515.50
1515.515.50
1618.415.52.9
1718.418.40
1818.418.40
1916.218.4-2.2
2016.216.20
2116.216.20
2220.616.24.4
2320.620.60
2420.620.60
2519.820.6-0.800000000000001
2619.819.80
2719.819.80
2821.619.81.8
2921.621.60
3021.621.60
3122.321.60.699999999999999
3222.322.30
3322.322.30
3423.722.31.4
3523.723.70
3623.723.70
3722.123.7-1.6
3822.122.10
3922.122.10
4026.622.14.5
4126.626.60
4226.626.60
4323.526.6-3.1
4423.523.50
4523.523.50
4619.623.5-3.9
4719.619.60
4819.619.60
492019.60.399999999999999
5020200
5120200
5220.1200.100000000000001
5320.120.10
5420.120.10
551620.1-4.1
5616160
5716160
5818.9162.9
5918.918.90
6018.918.90


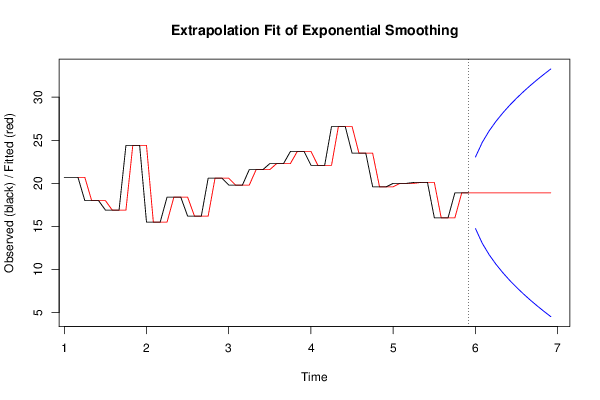
Extrapolation Forecasts of Exponential Smoothing
tForecast95% Lower Bound95% Upper Bound
6118.914.747445196545623.0525548034544
6218.913.027400678457224.7725993215428
6318.911.707564099202726.0924359007973
6418.910.594890393091127.2051096069089
6518.99.6146051791826128.1853948208174
6618.98.7283596025933629.0716403974066
6718.97.9133726844928829.8866273155071
6818.97.154801356914430.6451986430856
6918.96.4423355896367131.3576644103633
7018.95.7684687124111632.0315312875888
7118.95.1275337955536432.6724662044464
7218.94.5151281984054733.2848718015945

\begin{tabular}{lllllllll}
\hline
Extrapolation Forecasts of Exponential Smoothing \tabularnewline
t & Forecast & 95% Lower Bound & 95% Upper Bound \tabularnewline
61 & 18.9 & 14.7474451965456 & 23.0525548034544 \tabularnewline
62 & 18.9 & 13.0274006784572 & 24.7725993215428 \tabularnewline
63 & 18.9 & 11.7075640992027 & 26.0924359007973 \tabularnewline
64 & 18.9 & 10.5948903930911 & 27.2051096069089 \tabularnewline
65 & 18.9 & 9.61460517918261 & 28.1853948208174 \tabularnewline
66 & 18.9 & 8.72835960259336 & 29.0716403974066 \tabularnewline
67 & 18.9 & 7.91337268449288 & 29.8866273155071 \tabularnewline
68 & 18.9 & 7.1548013569144 & 30.6451986430856 \tabularnewline
69 & 18.9 & 6.44233558963671 & 31.3576644103633 \tabularnewline
70 & 18.9 & 5.76846871241116 & 32.0315312875888 \tabularnewline
71 & 18.9 & 5.12753379555364 & 32.6724662044464 \tabularnewline
72 & 18.9 & 4.51512819840547 & 33.2848718015945 \tabularnewline
\hline
\end{tabular}
%Source: https://freestatistics.org/blog/index.php?pk=286466&T=3

[TABLE]
[ROW][C]Extrapolation Forecasts of Exponential Smoothing[/C][/ROW]
[ROW][C]t[/C][C]Forecast[/C][C]95% Lower Bound[/C][C]95% Upper Bound[/C][/ROW]
[ROW][C]61[/C][C]18.9[/C][C]14.7474451965456[/C][C]23.0525548034544[/C][/ROW]
[ROW][C]62[/C][C]18.9[/C][C]13.0274006784572[/C][C]24.7725993215428[/C][/ROW]
[ROW][C]63[/C][C]18.9[/C][C]11.7075640992027[/C][C]26.0924359007973[/C][/ROW]
[ROW][C]64[/C][C]18.9[/C][C]10.5948903930911[/C][C]27.2051096069089[/C][/ROW]
[ROW][C]65[/C][C]18.9[/C][C]9.61460517918261[/C][C]28.1853948208174[/C][/ROW]
[ROW][C]66[/C][C]18.9[/C][C]8.72835960259336[/C][C]29.0716403974066[/C][/ROW]
[ROW][C]67[/C][C]18.9[/C][C]7.91337268449288[/C][C]29.8866273155071[/C][/ROW]
[ROW][C]68[/C][C]18.9[/C][C]7.1548013569144[/C][C]30.6451986430856[/C][/ROW]
[ROW][C]69[/C][C]18.9[/C][C]6.44233558963671[/C][C]31.3576644103633[/C][/ROW]
[ROW][C]70[/C][C]18.9[/C][C]5.76846871241116[/C][C]32.0315312875888[/C][/ROW]
[ROW][C]71[/C][C]18.9[/C][C]5.12753379555364[/C][C]32.6724662044464[/C][/ROW]
[ROW][C]72[/C][C]18.9[/C][C]4.51512819840547[/C][C]33.2848718015945[/C][/ROW]
[/TABLE]
Source: https://freestatistics.org/blog/index.php?pk=286466&T=3

Globally Unique Identifier (entire table): ba.freestatistics.org/blog/index.php?pk=286466&T=3

As an alternative you can also use a QR Code:  

The GUIDs for individual cells are displayed in the table below:

Extrapolation Forecasts of Exponential Smoothing
tForecast95% Lower Bound95% Upper Bound
6118.914.747445196545623.0525548034544
6218.913.027400678457224.7725993215428
6318.911.707564099202726.0924359007973
6418.910.594890393091127.2051096069089
6518.99.6146051791826128.1853948208174
6618.98.7283596025933629.0716403974066
6718.97.9133726844928829.8866273155071
6818.97.154801356914430.6451986430856
6918.96.4423355896367131.3576644103633
7018.95.7684687124111632.0315312875888
7118.95.1275337955536432.6724662044464
7218.94.5151281984054733.2848718015945


Parameters (Session):
par1 = 12 ; par2 = Double ; par3 = additive ;
Parameters (R input):
par1 = 12 ; par2 = Double ; par3 = additive ;
R code (references can be found in the software module):
par1 <- as.numeric(par1)
if (par2 == 'Single') K <- 1
if (par2 == 'Double') K <- 2
if (par2 == 'Triple') K <- par1
nx <- length(x)
nxmK <- nx - K
x <- ts(x, frequency = par1)
if (par2 == 'Single') fit <- HoltWinters(x, gamma=F, beta=F)
if (par2 == 'Double') fit <- HoltWinters(x, gamma=F)
if (par2 == 'Triple') fit <- HoltWinters(x, seasonal=par3)
fit
myresid <- x - fit$fitted[,'xhat']
bitmap(file='test1.png')
op <- par(mfrow=c(2,1))
plot(fit,ylab='Observed (black) / Fitted (red)',main='Interpolation Fit of Exponential Smoothing')
plot(myresid,ylab='Residuals',main='Interpolation Prediction Errors')
par(op)
dev.off()
bitmap(file='test2.png')
p <- predict(fit, par1, prediction.interval=TRUE)
np <- length(p[,1])
plot(fit,p,ylab='Observed (black) / Fitted (red)',main='Extrapolation Fit of Exponential Smoothing')
dev.off()
bitmap(file='test3.png')
op <- par(mfrow = c(2,2))
acf(as.numeric(myresid),lag.max = nx/2,main='Residual ACF')
spectrum(myresid,main='Residals Periodogram')
cpgram(myresid,main='Residal Cumulative Periodogram')
qqnorm(myresid,main='Residual Normal QQ Plot')
qqline(myresid)
par(op)
dev.off()
load(file='createtable')
a<-table.start()
a<-table.row.start(a)
a<-table.element(a,'Estimated Parameters of Exponential Smoothing',2,TRUE)
a<-table.row.end(a)
a<-table.row.start(a)
a<-table.element(a,'Parameter',header=TRUE)
a<-table.element(a,'Value',header=TRUE)
a<-table.row.end(a)
a<-table.row.start(a)
a<-table.element(a,'alpha',header=TRUE)
a<-table.element(a,fit$alpha)
a<-table.row.end(a)
a<-table.row.start(a)
a<-table.element(a,'beta',header=TRUE)
a<-table.element(a,fit$beta)
a<-table.row.end(a)
a<-table.row.start(a)
a<-table.element(a,'gamma',header=TRUE)
a<-table.element(a,fit$gamma)
a<-table.row.end(a)
a<-table.end(a)
table.save(a,file='mytable.tab')
a<-table.start()
a<-table.row.start(a)
a<-table.element(a,'Interpolation Forecasts of Exponential Smoothing',4,TRUE)
a<-table.row.end(a)
a<-table.row.start(a)
a<-table.element(a,'t',header=TRUE)
a<-table.element(a,'Observed',header=TRUE)
a<-table.element(a,'Fitted',header=TRUE)
a<-table.element(a,'Residuals',header=TRUE)
a<-table.row.end(a)
for (i in 1:nxmK) {
a<-table.row.start(a)
a<-table.element(a,i+K,header=TRUE)
a<-table.element(a,x[i+K])
a<-table.element(a,fit$fitted[i,'xhat'])
a<-table.element(a,myresid[i])
a<-table.row.end(a)
}
a<-table.end(a)
table.save(a,file='mytable1.tab')
a<-table.start()
a<-table.row.start(a)
a<-table.element(a,'Extrapolation Forecasts of Exponential Smoothing',4,TRUE)
a<-table.row.end(a)
a<-table.row.start(a)
a<-table.element(a,'t',header=TRUE)
a<-table.element(a,'Forecast',header=TRUE)
a<-table.element(a,'95% Lower Bound',header=TRUE)
a<-table.element(a,'95% Upper Bound',header=TRUE)
a<-table.row.end(a)
for (i in 1:np) {
a<-table.row.start(a)
a<-table.element(a,nx+i,header=TRUE)
a<-table.element(a,p[i,'fit'])
a<-table.element(a,p[i,'lwr'])
a<-table.element(a,p[i,'upr'])
a<-table.row.end(a)
}
a<-table.end(a)
table.save(a,file='mytable2.tab')