Free Statistics

of Irreproducible Research!

Author's title

Author*The author of this computation has been verified*
R Software Modulerwasp_centraltendency.wasp
Title produced by softwareCentral Tendency
Date of computationMon, 14 Dec 2015 18:52:23 +0000
Cite this page as followsStatistical Computations at FreeStatistics.org, Office for Research Development and Education, URL https://freestatistics.org/blog/index.php?v=date/2015/Dec/14/t14501191823k77m6p6igfjnse.htm/, Retrieved Sat, 18 May 2024 17:16:06 +0000
Statistical Computations at FreeStatistics.org, Office for Research Development and Education, URL https://freestatistics.org/blog/index.php?pk=286379, Retrieved Sat, 18 May 2024 17:16:06 +0000
QR Codes:

Original text written by user:
IsPrivate?No (this computation is public)
User-defined keywords
Estimated Impact50
Family? (F = Feedback message, R = changed R code, M = changed R Module, P = changed Parameters, D = changed Data)
-       [Central Tendency] [] [2015-12-14 18:52:23] [8ba356a4616aa2ff32c82bd617b07931] [Current]
Feedback Forum

Post a new message
Dataseries X:
389209
417715.1
404111.1
404640.2
382046.5
342862.4
269440.2
245567.7
245555.8
279248
335025.5
405310.9
389292.3
404187.1
375080.4
383723.7
374991.33152081
308449.53374478
287001.09152751
332070.6175
364306.6432903
380321.15202656
390992.25716633
383199.53159502
353004.90968947
333659.78078553
379586.79498549
405881.34656505
346697.73349159
369273.09717268
416809.32619049
423493.39006554


Summary of computational transaction
Raw Inputview raw input (R code)
Raw Outputview raw output of R engine
Computing time1 seconds
R Server'George Udny Yule' @ yule.wessa.net

\begin{tabular}{lllllllll}
\hline
Summary of computational transaction \tabularnewline
Raw Input & view raw input (R code)  \tabularnewline
Raw Output & view raw output of R engine  \tabularnewline
Computing time & 1 seconds \tabularnewline
R Server & 'George Udny Yule' @ yule.wessa.net \tabularnewline
\hline
\end{tabular}
%Source: https://freestatistics.org/blog/index.php?pk=286379&T=0

[TABLE]
[ROW][C]Summary of computational transaction[/C][/ROW]
[ROW][C]Raw Input[/C][C]view raw input (R code) [/C][/ROW]
[ROW][C]Raw Output[/C][C]view raw output of R engine [/C][/ROW]
[ROW][C]Computing time[/C][C]1 seconds[/C][/ROW]
[ROW][C]R Server[/C][C]'George Udny Yule' @ yule.wessa.net[/C][/ROW]
[/TABLE]
Source: https://freestatistics.org/blog/index.php?pk=286379&T=0

Globally Unique Identifier (entire table): ba.freestatistics.org/blog/index.php?pk=286379&T=0

As an alternative you can also use a QR Code:  

The GUIDs for individual cells are displayed in the table below:

Summary of computational transaction
Raw Inputview raw input (R code)
Raw Outputview raw output of R engine
Computing time1 seconds
R Server'George Udny Yule' @ yule.wessa.net


Central Tendency - Ungrouped Data
MeasureValueS.E.Value/S.E.
Arithmetic Mean360086.0761661618854.1299868116240.6687135497802
Geometric Mean356320.805836583
Harmonic Mean352134.53493563
Quadratic Mean363444.97025171
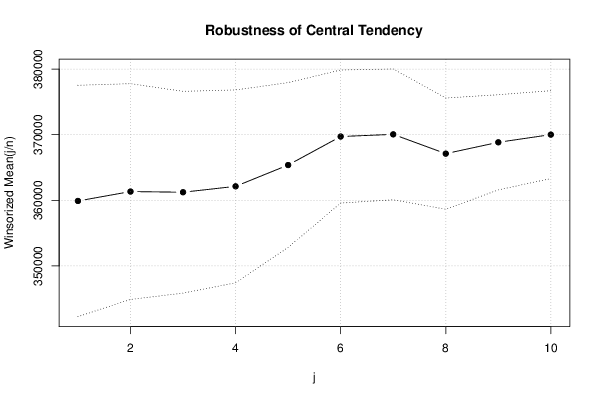
Winsorized Mean ( 1 / 10 )359905.8764766138814.0115400216840.8333793122907
Winsorized Mean ( 2 / 10 )361341.2968635188219.1017058869243.963599647965
Winsorized Mean ( 3 / 10 )361236.2800236337686.8318934260646.9941693836924
Winsorized Mean ( 4 / 10 )362134.1106439417346.6576450114349.2923623424646
Winsorized Mean ( 5 / 10 )365380.6328653896278.346456833758.1969528724699
Winsorized Mean ( 6 / 10 )369724.6298194935069.7409776275772.9277159229758
Winsorized Mean ( 7 / 10 )370055.6342882034983.4871027104674.2563644013313
Winsorized Mean ( 8 / 10 )367117.3533834034236.9757066559486.6460840940606
Winsorized Mean ( 9 / 10 )368843.3685553723624.82087396776101.754922899579
Winsorized Mean ( 10 / 10 )370015.8790214943346.64078299578110.563368767135
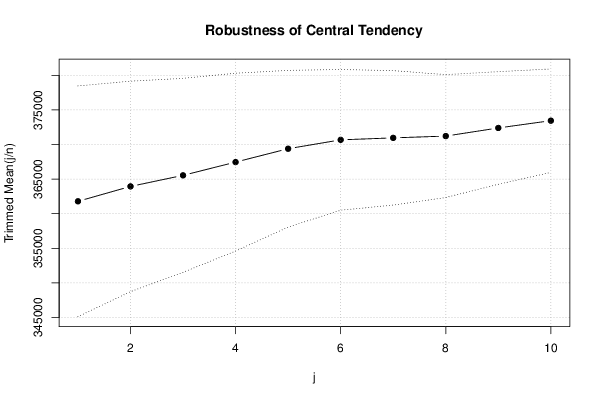
Trimmed Mean ( 1 / 10 )361790.1749083878342.0870821134543.3692637522466
Trimmed Mean ( 2 / 10 )363943.6588304157609.7396487144247.8260329040165
Trimmed Mean ( 3 / 10 )365545.1123485057014.9498010228452.1094409392929
Trimmed Mean ( 4 / 10 )367460.1489373366430.2230656877957.1457856412687
Trimmed Mean ( 5 / 10 )369396.8901349355666.6235873288565.1881820703503
Trimmed Mean ( 6 / 10 )370682.0924611895090.0836848658372.8243611324751
Trimmed Mean ( 7 / 10 )370965.7850957664860.9829599656776.314973360529
Trimmed Mean ( 8 / 10 )371225.8281836414443.6704596390283.540359609339
Trimmed Mean ( 9 / 10 )372399.6781265664072.5719591443391.4409080704885
Trimmed Mean ( 10 / 10 )373453.3994809933741.1389174552199.8234515533636
Median377333.597492745
Midrange334524.59503277
Midmean - Weighted Average at Xnp369016.060689634
Midmean - Weighted Average at X(n+1)p371225.828183641
Midmean - Empirical Distribution Function369016.060689634
Midmean - Empirical Distribution Function - Averaging371225.828183641
Midmean - Empirical Distribution Function - Interpolation371225.828183641
Midmean - Closest Observation369016.060689634
Midmean - True Basic - Statistics Graphics Toolkit371225.828183641
Midmean - MS Excel (old versions)370965.785095765
Number of observations32

\begin{tabular}{lllllllll}
\hline
Central Tendency - Ungrouped Data \tabularnewline
Measure & Value & S.E. & Value/S.E. \tabularnewline
Arithmetic Mean & 360086.076166161 & 8854.12998681162 & 40.6687135497802 \tabularnewline
Geometric Mean & 356320.805836583 &  &  \tabularnewline
Harmonic Mean & 352134.53493563 &  &  \tabularnewline
Quadratic Mean & 363444.97025171 &  &  \tabularnewline
Winsorized Mean ( 1 / 10 ) & 359905.876476613 & 8814.01154002168 & 40.8333793122907 \tabularnewline
Winsorized Mean ( 2 / 10 ) & 361341.296863518 & 8219.10170588692 & 43.963599647965 \tabularnewline
Winsorized Mean ( 3 / 10 ) & 361236.280023633 & 7686.83189342606 & 46.9941693836924 \tabularnewline
Winsorized Mean ( 4 / 10 ) & 362134.110643941 & 7346.65764501143 & 49.2923623424646 \tabularnewline
Winsorized Mean ( 5 / 10 ) & 365380.632865389 & 6278.3464568337 & 58.1969528724699 \tabularnewline
Winsorized Mean ( 6 / 10 ) & 369724.629819493 & 5069.74097762757 & 72.9277159229758 \tabularnewline
Winsorized Mean ( 7 / 10 ) & 370055.634288203 & 4983.48710271046 & 74.2563644013313 \tabularnewline
Winsorized Mean ( 8 / 10 ) & 367117.353383403 & 4236.97570665594 & 86.6460840940606 \tabularnewline
Winsorized Mean ( 9 / 10 ) & 368843.368555372 & 3624.82087396776 & 101.754922899579 \tabularnewline
Winsorized Mean ( 10 / 10 ) & 370015.879021494 & 3346.64078299578 & 110.563368767135 \tabularnewline
Trimmed Mean ( 1 / 10 ) & 361790.174908387 & 8342.08708211345 & 43.3692637522466 \tabularnewline
Trimmed Mean ( 2 / 10 ) & 363943.658830415 & 7609.73964871442 & 47.8260329040165 \tabularnewline
Trimmed Mean ( 3 / 10 ) & 365545.112348505 & 7014.94980102284 & 52.1094409392929 \tabularnewline
Trimmed Mean ( 4 / 10 ) & 367460.148937336 & 6430.22306568779 & 57.1457856412687 \tabularnewline
Trimmed Mean ( 5 / 10 ) & 369396.890134935 & 5666.62358732885 & 65.1881820703503 \tabularnewline
Trimmed Mean ( 6 / 10 ) & 370682.092461189 & 5090.08368486583 & 72.8243611324751 \tabularnewline
Trimmed Mean ( 7 / 10 ) & 370965.785095766 & 4860.98295996567 & 76.314973360529 \tabularnewline
Trimmed Mean ( 8 / 10 ) & 371225.828183641 & 4443.67045963902 & 83.540359609339 \tabularnewline
Trimmed Mean ( 9 / 10 ) & 372399.678126566 & 4072.57195914433 & 91.4409080704885 \tabularnewline
Trimmed Mean ( 10 / 10 ) & 373453.399480993 & 3741.13891745521 & 99.8234515533636 \tabularnewline
Median & 377333.597492745 &  &  \tabularnewline
Midrange & 334524.59503277 &  &  \tabularnewline
Midmean - Weighted Average at Xnp & 369016.060689634 &  &  \tabularnewline
Midmean - Weighted Average at X(n+1)p & 371225.828183641 &  &  \tabularnewline
Midmean - Empirical Distribution Function & 369016.060689634 &  &  \tabularnewline
Midmean - Empirical Distribution Function - Averaging & 371225.828183641 &  &  \tabularnewline
Midmean - Empirical Distribution Function - Interpolation & 371225.828183641 &  &  \tabularnewline
Midmean - Closest Observation & 369016.060689634 &  &  \tabularnewline
Midmean - True Basic - Statistics Graphics Toolkit & 371225.828183641 &  &  \tabularnewline
Midmean - MS Excel (old versions) & 370965.785095765 &  &  \tabularnewline
Number of observations & 32 &  &  \tabularnewline
\hline
\end{tabular}
%Source: https://freestatistics.org/blog/index.php?pk=286379&T=1

[TABLE]
[ROW][C]Central Tendency - Ungrouped Data[/C][/ROW]
[ROW][C]Measure[/C][C]Value[/C][C]S.E.[/C][C]Value/S.E.[/C][/ROW]
[ROW][C]Arithmetic Mean[/C][C]360086.076166161[/C][C]8854.12998681162[/C][C]40.6687135497802[/C][/ROW]
[ROW][C]Geometric Mean[/C][C]356320.805836583[/C][C][/C][C][/C][/ROW]
[ROW][C]Harmonic Mean[/C][C]352134.53493563[/C][C][/C][C][/C][/ROW]
[ROW][C]Quadratic Mean[/C][C]363444.97025171[/C][C][/C][C][/C][/ROW]
[ROW][C]Winsorized Mean ( 1 / 10 )[/C][C]359905.876476613[/C][C]8814.01154002168[/C][C]40.8333793122907[/C][/ROW]
[ROW][C]Winsorized Mean ( 2 / 10 )[/C][C]361341.296863518[/C][C]8219.10170588692[/C][C]43.963599647965[/C][/ROW]
[ROW][C]Winsorized Mean ( 3 / 10 )[/C][C]361236.280023633[/C][C]7686.83189342606[/C][C]46.9941693836924[/C][/ROW]
[ROW][C]Winsorized Mean ( 4 / 10 )[/C][C]362134.110643941[/C][C]7346.65764501143[/C][C]49.2923623424646[/C][/ROW]
[ROW][C]Winsorized Mean ( 5 / 10 )[/C][C]365380.632865389[/C][C]6278.3464568337[/C][C]58.1969528724699[/C][/ROW]
[ROW][C]Winsorized Mean ( 6 / 10 )[/C][C]369724.629819493[/C][C]5069.74097762757[/C][C]72.9277159229758[/C][/ROW]
[ROW][C]Winsorized Mean ( 7 / 10 )[/C][C]370055.634288203[/C][C]4983.48710271046[/C][C]74.2563644013313[/C][/ROW]
[ROW][C]Winsorized Mean ( 8 / 10 )[/C][C]367117.353383403[/C][C]4236.97570665594[/C][C]86.6460840940606[/C][/ROW]
[ROW][C]Winsorized Mean ( 9 / 10 )[/C][C]368843.368555372[/C][C]3624.82087396776[/C][C]101.754922899579[/C][/ROW]
[ROW][C]Winsorized Mean ( 10 / 10 )[/C][C]370015.879021494[/C][C]3346.64078299578[/C][C]110.563368767135[/C][/ROW]
[ROW][C]Trimmed Mean ( 1 / 10 )[/C][C]361790.174908387[/C][C]8342.08708211345[/C][C]43.3692637522466[/C][/ROW]
[ROW][C]Trimmed Mean ( 2 / 10 )[/C][C]363943.658830415[/C][C]7609.73964871442[/C][C]47.8260329040165[/C][/ROW]
[ROW][C]Trimmed Mean ( 3 / 10 )[/C][C]365545.112348505[/C][C]7014.94980102284[/C][C]52.1094409392929[/C][/ROW]
[ROW][C]Trimmed Mean ( 4 / 10 )[/C][C]367460.148937336[/C][C]6430.22306568779[/C][C]57.1457856412687[/C][/ROW]
[ROW][C]Trimmed Mean ( 5 / 10 )[/C][C]369396.890134935[/C][C]5666.62358732885[/C][C]65.1881820703503[/C][/ROW]
[ROW][C]Trimmed Mean ( 6 / 10 )[/C][C]370682.092461189[/C][C]5090.08368486583[/C][C]72.8243611324751[/C][/ROW]
[ROW][C]Trimmed Mean ( 7 / 10 )[/C][C]370965.785095766[/C][C]4860.98295996567[/C][C]76.314973360529[/C][/ROW]
[ROW][C]Trimmed Mean ( 8 / 10 )[/C][C]371225.828183641[/C][C]4443.67045963902[/C][C]83.540359609339[/C][/ROW]
[ROW][C]Trimmed Mean ( 9 / 10 )[/C][C]372399.678126566[/C][C]4072.57195914433[/C][C]91.4409080704885[/C][/ROW]
[ROW][C]Trimmed Mean ( 10 / 10 )[/C][C]373453.399480993[/C][C]3741.13891745521[/C][C]99.8234515533636[/C][/ROW]
[ROW][C]Median[/C][C]377333.597492745[/C][C][/C][C][/C][/ROW]
[ROW][C]Midrange[/C][C]334524.59503277[/C][C][/C][C][/C][/ROW]
[ROW][C]Midmean - Weighted Average at Xnp[/C][C]369016.060689634[/C][C][/C][C][/C][/ROW]
[ROW][C]Midmean - Weighted Average at X(n+1)p[/C][C]371225.828183641[/C][C][/C][C][/C][/ROW]
[ROW][C]Midmean - Empirical Distribution Function[/C][C]369016.060689634[/C][C][/C][C][/C][/ROW]
[ROW][C]Midmean - Empirical Distribution Function - Averaging[/C][C]371225.828183641[/C][C][/C][C][/C][/ROW]
[ROW][C]Midmean - Empirical Distribution Function - Interpolation[/C][C]371225.828183641[/C][C][/C][C][/C][/ROW]
[ROW][C]Midmean - Closest Observation[/C][C]369016.060689634[/C][C][/C][C][/C][/ROW]
[ROW][C]Midmean - True Basic - Statistics Graphics Toolkit[/C][C]371225.828183641[/C][C][/C][C][/C][/ROW]
[ROW][C]Midmean - MS Excel (old versions)[/C][C]370965.785095765[/C][C][/C][C][/C][/ROW]
[ROW][C]Number of observations[/C][C]32[/C][C][/C][C][/C][/ROW]
[/TABLE]
Source: https://freestatistics.org/blog/index.php?pk=286379&T=1

Globally Unique Identifier (entire table): ba.freestatistics.org/blog/index.php?pk=286379&T=1

As an alternative you can also use a QR Code:  

The GUIDs for individual cells are displayed in the table below:

Central Tendency - Ungrouped Data
MeasureValueS.E.Value/S.E.
Arithmetic Mean360086.0761661618854.1299868116240.6687135497802
Geometric Mean356320.805836583
Harmonic Mean352134.53493563
Quadratic Mean363444.97025171
Winsorized Mean ( 1 / 10 )359905.8764766138814.0115400216840.8333793122907
Winsorized Mean ( 2 / 10 )361341.2968635188219.1017058869243.963599647965
Winsorized Mean ( 3 / 10 )361236.2800236337686.8318934260646.9941693836924
Winsorized Mean ( 4 / 10 )362134.1106439417346.6576450114349.2923623424646
Winsorized Mean ( 5 / 10 )365380.6328653896278.346456833758.1969528724699
Winsorized Mean ( 6 / 10 )369724.6298194935069.7409776275772.9277159229758
Winsorized Mean ( 7 / 10 )370055.6342882034983.4871027104674.2563644013313
Winsorized Mean ( 8 / 10 )367117.3533834034236.9757066559486.6460840940606
Winsorized Mean ( 9 / 10 )368843.3685553723624.82087396776101.754922899579
Winsorized Mean ( 10 / 10 )370015.8790214943346.64078299578110.563368767135
Trimmed Mean ( 1 / 10 )361790.1749083878342.0870821134543.3692637522466
Trimmed Mean ( 2 / 10 )363943.6588304157609.7396487144247.8260329040165
Trimmed Mean ( 3 / 10 )365545.1123485057014.9498010228452.1094409392929
Trimmed Mean ( 4 / 10 )367460.1489373366430.2230656877957.1457856412687
Trimmed Mean ( 5 / 10 )369396.8901349355666.6235873288565.1881820703503
Trimmed Mean ( 6 / 10 )370682.0924611895090.0836848658372.8243611324751
Trimmed Mean ( 7 / 10 )370965.7850957664860.9829599656776.314973360529
Trimmed Mean ( 8 / 10 )371225.8281836414443.6704596390283.540359609339
Trimmed Mean ( 9 / 10 )372399.6781265664072.5719591443391.4409080704885
Trimmed Mean ( 10 / 10 )373453.3994809933741.1389174552199.8234515533636
Median377333.597492745
Midrange334524.59503277
Midmean - Weighted Average at Xnp369016.060689634
Midmean - Weighted Average at X(n+1)p371225.828183641
Midmean - Empirical Distribution Function369016.060689634
Midmean - Empirical Distribution Function - Averaging371225.828183641
Midmean - Empirical Distribution Function - Interpolation371225.828183641
Midmean - Closest Observation369016.060689634
Midmean - True Basic - Statistics Graphics Toolkit371225.828183641
Midmean - MS Excel (old versions)370965.785095765
Number of observations32


Parameters (Session):
Parameters (R input):
R code (references can be found in the software module):
geomean <- function(x) {
return(exp(mean(log(x))))
}
harmean <- function(x) {
return(1/mean(1/x))
}
quamean <- function(x) {
return(sqrt(mean(x*x)))
}
winmean <- function(x) {
x <-sort(x[!is.na(x)])
n<-length(x)
denom <- 3
nodenom <- n/denom
if (nodenom>40) denom <- n/40
sqrtn = sqrt(n)
roundnodenom = floor(nodenom)
win <- array(NA,dim=c(roundnodenom,2))
for (j in 1:roundnodenom) {
win[j,1] <- (j*x[j+1]+sum(x[(j+1):(n-j)])+j*x[n-j])/n
win[j,2] <- sd(c(rep(x[j+1],j),x[(j+1):(n-j)],rep(x[n-j],j)))/sqrtn
}
return(win)
}
trimean <- function(x) {
x <-sort(x[!is.na(x)])
n<-length(x)
denom <- 3
nodenom <- n/denom
if (nodenom>40) denom <- n/40
sqrtn = sqrt(n)
roundnodenom = floor(nodenom)
tri <- array(NA,dim=c(roundnodenom,2))
for (j in 1:roundnodenom) {
tri[j,1] <- mean(x,trim=j/n)
tri[j,2] <- sd(x[(j+1):(n-j)]) / sqrt(n-j*2)
}
return(tri)
}
midrange <- function(x) {
return((max(x)+min(x))/2)
}
q1 <- function(data,n,p,i,f) {
np <- n*p;
i <<- floor(np)
f <<- np - i
qvalue <- (1-f)*data[i] + f*data[i+1]
}
q2 <- function(data,n,p,i,f) {
np <- (n+1)*p
i <<- floor(np)
f <<- np - i
qvalue <- (1-f)*data[i] + f*data[i+1]
}
q3 <- function(data,n,p,i,f) {
np <- n*p
i <<- floor(np)
f <<- np - i
if (f==0) {
qvalue <- data[i]
} else {
qvalue <- data[i+1]
}
}
q4 <- function(data,n,p,i,f) {
np <- n*p
i <<- floor(np)
f <<- np - i
if (f==0) {
qvalue <- (data[i]+data[i+1])/2
} else {
qvalue <- data[i+1]
}
}
q5 <- function(data,n,p,i,f) {
np <- (n-1)*p
i <<- floor(np)
f <<- np - i
if (f==0) {
qvalue <- data[i+1]
} else {
qvalue <- data[i+1] + f*(data[i+2]-data[i+1])
}
}
q6 <- function(data,n,p,i,f) {
np <- n*p+0.5
i <<- floor(np)
f <<- np - i
qvalue <- data[i]
}
q7 <- function(data,n,p,i,f) {
np <- (n+1)*p
i <<- floor(np)
f <<- np - i
if (f==0) {
qvalue <- data[i]
} else {
qvalue <- f*data[i] + (1-f)*data[i+1]
}
}
q8 <- function(data,n,p,i,f) {
np <- (n+1)*p
i <<- floor(np)
f <<- np - i
if (f==0) {
qvalue <- data[i]
} else {
if (f == 0.5) {
qvalue <- (data[i]+data[i+1])/2
} else {
if (f < 0.5) {
qvalue <- data[i]
} else {
qvalue <- data[i+1]
}
}
}
}
midmean <- function(x,def) {
x <-sort(x[!is.na(x)])
n<-length(x)
if (def==1) {
qvalue1 <- q1(x,n,0.25,i,f)
qvalue3 <- q1(x,n,0.75,i,f)
}
if (def==2) {
qvalue1 <- q2(x,n,0.25,i,f)
qvalue3 <- q2(x,n,0.75,i,f)
}
if (def==3) {
qvalue1 <- q3(x,n,0.25,i,f)
qvalue3 <- q3(x,n,0.75,i,f)
}
if (def==4) {
qvalue1 <- q4(x,n,0.25,i,f)
qvalue3 <- q4(x,n,0.75,i,f)
}
if (def==5) {
qvalue1 <- q5(x,n,0.25,i,f)
qvalue3 <- q5(x,n,0.75,i,f)
}
if (def==6) {
qvalue1 <- q6(x,n,0.25,i,f)
qvalue3 <- q6(x,n,0.75,i,f)
}
if (def==7) {
qvalue1 <- q7(x,n,0.25,i,f)
qvalue3 <- q7(x,n,0.75,i,f)
}
if (def==8) {
qvalue1 <- q8(x,n,0.25,i,f)
qvalue3 <- q8(x,n,0.75,i,f)
}
midm <- 0
myn <- 0
roundno4 <- round(n/4)
round3no4 <- round(3*n/4)
for (i in 1:n) {
if ((x[i]>=qvalue1) & (x[i]<=qvalue3)){
midm = midm + x[i]
myn = myn + 1
}
}
midm = midm / myn
return(midm)
}
(arm <- mean(x))
sqrtn <- sqrt(length(x))
(armse <- sd(x) / sqrtn)
(armose <- arm / armse)
(geo <- geomean(x))
(har <- harmean(x))
(qua <- quamean(x))
(win <- winmean(x))
(tri <- trimean(x))
(midr <- midrange(x))
midm <- array(NA,dim=8)
for (j in 1:8) midm[j] <- midmean(x,j)
midm
bitmap(file='test1.png')
lb <- win[,1] - 2*win[,2]
ub <- win[,1] + 2*win[,2]
if ((ylimmin == '') | (ylimmax == '')) plot(win[,1],type='b',main=main, xlab='j', pch=19, ylab='Winsorized Mean(j/n)', ylim=c(min(lb),max(ub))) else plot(win[,1],type='l',main=main, xlab='j', pch=19, ylab='Winsorized Mean(j/n)', ylim=c(ylimmin,ylimmax))
lines(ub,lty=3)
lines(lb,lty=3)
grid()
dev.off()
bitmap(file='test2.png')
lb <- tri[,1] - 2*tri[,2]
ub <- tri[,1] + 2*tri[,2]
if ((ylimmin == '') | (ylimmax == '')) plot(tri[,1],type='b',main=main, xlab='j', pch=19, ylab='Trimmed Mean(j/n)', ylim=c(min(lb),max(ub))) else plot(tri[,1],type='l',main=main, xlab='j', pch=19, ylab='Trimmed Mean(j/n)', ylim=c(ylimmin,ylimmax))
lines(ub,lty=3)
lines(lb,lty=3)
grid()
dev.off()
load(file='createtable')
a<-table.start()
a<-table.row.start(a)
a<-table.element(a,'Central Tendency - Ungrouped Data',4,TRUE)
a<-table.row.end(a)
a<-table.row.start(a)
a<-table.element(a,'Measure',header=TRUE)
a<-table.element(a,'Value',header=TRUE)
a<-table.element(a,'S.E.',header=TRUE)
a<-table.element(a,'Value/S.E.',header=TRUE)
a<-table.row.end(a)
a<-table.row.start(a)
a<-table.element(a,hyperlink('arithmetic_mean.htm', 'Arithmetic Mean', 'click to view the definition of the Arithmetic Mean'),header=TRUE)
a<-table.element(a,arm)
a<-table.element(a,hyperlink('arithmetic_mean_standard_error.htm', armse, 'click to view the definition of the Standard Error of the Arithmetic Mean'))
a<-table.element(a,armose)
a<-table.row.end(a)
a<-table.row.start(a)
a<-table.element(a,hyperlink('geometric_mean.htm', 'Geometric Mean', 'click to view the definition of the Geometric Mean'),header=TRUE)
a<-table.element(a,geo)
a<-table.element(a,'')
a<-table.row.end(a)
a<-table.row.start(a)
a<-table.element(a,hyperlink('harmonic_mean.htm', 'Harmonic Mean', 'click to view the definition of the Harmonic Mean'),header=TRUE)
a<-table.element(a,har)
a<-table.element(a,'')
a<-table.row.end(a)
a<-table.row.start(a)
a<-table.element(a,hyperlink('quadratic_mean.htm', 'Quadratic Mean', 'click to view the definition of the Quadratic Mean'),header=TRUE)
a<-table.element(a,qua)
a<-table.element(a,'')
a<-table.row.end(a)
for (j in 1:length(win[,1])) {
a<-table.row.start(a)
mylabel <- paste('Winsorized Mean (',j)
mylabel <- paste(mylabel,'/')
mylabel <- paste(mylabel,length(win[,1]))
mylabel <- paste(mylabel,')')
a<-table.element(a,hyperlink('winsorized_mean.htm', mylabel, 'click to view the definition of the Winsorized Mean'),header=TRUE)
a<-table.element(a,win[j,1])
a<-table.element(a,win[j,2])
a<-table.element(a,win[j,1]/win[j,2])
a<-table.row.end(a)
}
for (j in 1:length(tri[,1])) {
a<-table.row.start(a)
mylabel <- paste('Trimmed Mean (',j)
mylabel <- paste(mylabel,'/')
mylabel <- paste(mylabel,length(tri[,1]))
mylabel <- paste(mylabel,')')
a<-table.element(a,hyperlink('arithmetic_mean.htm', mylabel, 'click to view the definition of the Trimmed Mean'),header=TRUE)
a<-table.element(a,tri[j,1])
a<-table.element(a,tri[j,2])
a<-table.element(a,tri[j,1]/tri[j,2])
a<-table.row.end(a)
}
a<-table.row.start(a)
a<-table.element(a,hyperlink('median_1.htm', 'Median', 'click to view the definition of the Median'),header=TRUE)
a<-table.element(a,median(x))
a<-table.element(a,'')
a<-table.row.end(a)
a<-table.row.start(a)
a<-table.element(a,hyperlink('midrange.htm', 'Midrange', 'click to view the definition of the Midrange'),header=TRUE)
a<-table.element(a,midr)
a<-table.element(a,'')
a<-table.row.end(a)
a<-table.row.start(a)
mymid <- hyperlink('midmean.htm', 'Midmean', 'click to view the definition of the Midmean')
mylabel <- paste(mymid,hyperlink('method_1.htm','Weighted Average at Xnp',''),sep=' - ')
a<-table.element(a,mylabel,header=TRUE)
a<-table.element(a,midm[1])
a<-table.element(a,'')
a<-table.row.end(a)
a<-table.row.start(a)
mymid <- hyperlink('midmean.htm', 'Midmean', 'click to view the definition of the Midmean')
mylabel <- paste(mymid,hyperlink('method_2.htm','Weighted Average at X(n+1)p',''),sep=' - ')
a<-table.element(a,mylabel,header=TRUE)
a<-table.element(a,midm[2])
a<-table.element(a,'')
a<-table.row.end(a)
a<-table.row.start(a)
mymid <- hyperlink('midmean.htm', 'Midmean', 'click to view the definition of the Midmean')
mylabel <- paste(mymid,hyperlink('method_3.htm','Empirical Distribution Function',''),sep=' - ')
a<-table.element(a,mylabel,header=TRUE)
a<-table.element(a,midm[3])
a<-table.element(a,'')
a<-table.row.end(a)
a<-table.row.start(a)
mymid <- hyperlink('midmean.htm', 'Midmean', 'click to view the definition of the Midmean')
mylabel <- paste(mymid,hyperlink('method_4.htm','Empirical Distribution Function - Averaging',''),sep=' - ')
a<-table.element(a,mylabel,header=TRUE)
a<-table.element(a,midm[4])
a<-table.element(a,'')
a<-table.row.end(a)
a<-table.row.start(a)
mymid <- hyperlink('midmean.htm', 'Midmean', 'click to view the definition of the Midmean')
mylabel <- paste(mymid,hyperlink('method_5.htm','Empirical Distribution Function - Interpolation',''),sep=' - ')
a<-table.element(a,mylabel,header=TRUE)
a<-table.element(a,midm[5])
a<-table.element(a,'')
a<-table.row.end(a)
a<-table.row.start(a)
mymid <- hyperlink('midmean.htm', 'Midmean', 'click to view the definition of the Midmean')
mylabel <- paste(mymid,hyperlink('method_6.htm','Closest Observation',''),sep=' - ')
a<-table.element(a,mylabel,header=TRUE)
a<-table.element(a,midm[6])
a<-table.element(a,'')
a<-table.row.end(a)
a<-table.row.start(a)
mymid <- hyperlink('midmean.htm', 'Midmean', 'click to view the definition of the Midmean')
mylabel <- paste(mymid,hyperlink('method_7.htm','True Basic - Statistics Graphics Toolkit',''),sep=' - ')
a<-table.element(a,mylabel,header=TRUE)
a<-table.element(a,midm[7])
a<-table.element(a,'')
a<-table.row.end(a)
a<-table.row.start(a)
mymid <- hyperlink('midmean.htm', 'Midmean', 'click to view the definition of the Midmean')
mylabel <- paste(mymid,hyperlink('method_8.htm','MS Excel (old versions)',''),sep=' - ')
a<-table.element(a,mylabel,header=TRUE)
a<-table.element(a,midm[8])
a<-table.element(a,'')
a<-table.row.end(a)
a<-table.row.start(a)
a<-table.element(a,'Number of observations',header=TRUE)
a<-table.element(a,length(x))
a<-table.element(a,'')
a<-table.row.end(a)
a<-table.end(a)
table.save(a,file='mytable.tab')