Free Statistics

of Irreproducible Research!

Author's title

Author*The author of this computation has been verified*
R Software Modulerwasp_exponentialsmoothing.wasp
Title produced by softwareExponential Smoothing
Date of computationFri, 11 Dec 2015 14:43:24 +0000
Cite this page as followsStatistical Computations at FreeStatistics.org, Office for Research Development and Education, URL https://freestatistics.org/blog/index.php?v=date/2015/Dec/11/t1449845029bes6a0846i2nx6h.htm/, Retrieved Sat, 18 May 2024 16:21:48 +0000
Statistical Computations at FreeStatistics.org, Office for Research Development and Education, URL https://freestatistics.org/blog/index.php?pk=285968, Retrieved Sat, 18 May 2024 16:21:48 +0000
QR Codes:

Original text written by user:
IsPrivate?No (this computation is public)
User-defined keywords
Estimated Impact63
Family? (F = Feedback message, R = changed R code, M = changed R Module, P = changed Parameters, D = changed Data)
-       [Exponential Smoothing] [Exponentional Smo...] [2015-12-11 14:43:24] [c12205d6bf4e176e94a944db40434bc4] [Current]
Feedback Forum

Post a new message
Dataseries X:
21.6
19.4
20.2
19.4
18.4
16.1


Summary of computational transaction
Raw Inputview raw input (R code)
Raw Outputview raw output of R engine
Computing time1 seconds
R Server'Herman Ole Andreas Wold' @ wold.wessa.net

\begin{tabular}{lllllllll}
\hline
Summary of computational transaction \tabularnewline
Raw Input & view raw input (R code)  \tabularnewline
Raw Output & view raw output of R engine  \tabularnewline
Computing time & 1 seconds \tabularnewline
R Server & 'Herman Ole Andreas Wold' @ wold.wessa.net \tabularnewline
\hline
\end{tabular}
%Source: https://freestatistics.org/blog/index.php?pk=285968&T=0

[TABLE]
[ROW][C]Summary of computational transaction[/C][/ROW]
[ROW][C]Raw Input[/C][C]view raw input (R code) [/C][/ROW]
[ROW][C]Raw Output[/C][C]view raw output of R engine [/C][/ROW]
[ROW][C]Computing time[/C][C]1 seconds[/C][/ROW]
[ROW][C]R Server[/C][C]'Herman Ole Andreas Wold' @ wold.wessa.net[/C][/ROW]
[/TABLE]
Source: https://freestatistics.org/blog/index.php?pk=285968&T=0

Globally Unique Identifier (entire table): ba.freestatistics.org/blog/index.php?pk=285968&T=0

As an alternative you can also use a QR Code:  

The GUIDs for individual cells are displayed in the table below:

Summary of computational transaction
Raw Inputview raw input (R code)
Raw Outputview raw output of R engine
Computing time1 seconds
R Server'Herman Ole Andreas Wold' @ wold.wessa.net


Estimated Parameters of Exponential Smoothing
ParameterValue
alpha0.999935225081901
betaFALSE
gammaFALSE

\begin{tabular}{lllllllll}
\hline
Estimated Parameters of Exponential Smoothing \tabularnewline
Parameter & Value \tabularnewline
alpha & 0.999935225081901 \tabularnewline
beta & FALSE \tabularnewline
gamma & FALSE \tabularnewline
\hline
\end{tabular}
%Source: https://freestatistics.org/blog/index.php?pk=285968&T=1

[TABLE]
[ROW][C]Estimated Parameters of Exponential Smoothing[/C][/ROW]
[ROW][C]Parameter[/C][C]Value[/C][/ROW]
[ROW][C]alpha[/C][C]0.999935225081901[/C][/ROW]
[ROW][C]beta[/C][C]FALSE[/C][/ROW]
[ROW][C]gamma[/C][C]FALSE[/C][/ROW]
[/TABLE]
Source: https://freestatistics.org/blog/index.php?pk=285968&T=1

Globally Unique Identifier (entire table): ba.freestatistics.org/blog/index.php?pk=285968&T=1

As an alternative you can also use a QR Code:  

The GUIDs for individual cells are displayed in the table below:

Estimated Parameters of Exponential Smoothing
ParameterValue
alpha0.999935225081901
betaFALSE
gammaFALSE


Interpolation Forecasts of Exponential Smoothing
tObservedFittedResiduals
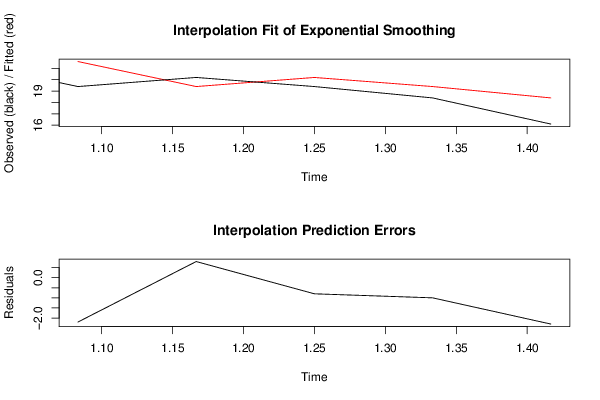
219.421.6-2.2
320.219.40014250481980.799857495180184
419.420.1999481892963-0.799948189296259
518.419.4000518165784-1.00005181657844
616.118.4000647782745-2.30006477827451

\begin{tabular}{lllllllll}
\hline
Interpolation Forecasts of Exponential Smoothing \tabularnewline
t & Observed & Fitted & Residuals \tabularnewline
2 & 19.4 & 21.6 & -2.2 \tabularnewline
3 & 20.2 & 19.4001425048198 & 0.799857495180184 \tabularnewline
4 & 19.4 & 20.1999481892963 & -0.799948189296259 \tabularnewline
5 & 18.4 & 19.4000518165784 & -1.00005181657844 \tabularnewline
6 & 16.1 & 18.4000647782745 & -2.30006477827451 \tabularnewline
\hline
\end{tabular}
%Source: https://freestatistics.org/blog/index.php?pk=285968&T=2

[TABLE]
[ROW][C]Interpolation Forecasts of Exponential Smoothing[/C][/ROW]
[ROW][C]t[/C][C]Observed[/C][C]Fitted[/C][C]Residuals[/C][/ROW]
[ROW][C]2[/C][C]19.4[/C][C]21.6[/C][C]-2.2[/C][/ROW]
[ROW][C]3[/C][C]20.2[/C][C]19.4001425048198[/C][C]0.799857495180184[/C][/ROW]
[ROW][C]4[/C][C]19.4[/C][C]20.1999481892963[/C][C]-0.799948189296259[/C][/ROW]
[ROW][C]5[/C][C]18.4[/C][C]19.4000518165784[/C][C]-1.00005181657844[/C][/ROW]
[ROW][C]6[/C][C]16.1[/C][C]18.4000647782745[/C][C]-2.30006477827451[/C][/ROW]
[/TABLE]
Source: https://freestatistics.org/blog/index.php?pk=285968&T=2

Globally Unique Identifier (entire table): ba.freestatistics.org/blog/index.php?pk=285968&T=2

As an alternative you can also use a QR Code:  

The GUIDs for individual cells are displayed in the table below:

Interpolation Forecasts of Exponential Smoothing
tObservedFittedResiduals
219.421.6-2.2
320.219.40014250481980.799857495180184
419.420.1999481892963-0.799948189296259
518.419.4000518165784-1.00005181657844
616.118.4000647782745-2.30006477827451


Extrapolation Forecasts of Exponential Smoothing
tForecast95% Lower Bound95% Upper Bound
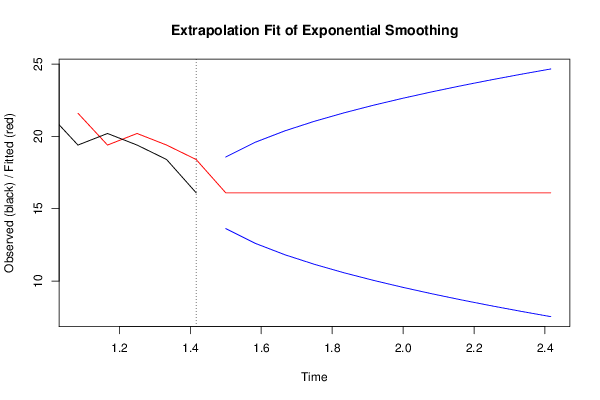
716.100148986507613.628799416364418.5714985566508
816.100148986507612.605246099903319.595051873112
916.100148986507611.819830811915420.3804671610998
1016.100148986507611.157689966475921.0426080065394
1116.100148986507610.574329712079521.6259682609358
1216.100148986507610.046930326770522.1533676462448
1316.10014898650769.5619356501642222.6383623228511
1416.10014898650769.110513007396323.089784965619
1516.10014898650768.686527158451123.5137708145642
1616.10014898650768.2855110487407923.9147869242745
1716.10014898650767.9040923988959124.2962055741194
1816.10014898650767.5396512745587424.6606466984565

\begin{tabular}{lllllllll}
\hline
Extrapolation Forecasts of Exponential Smoothing \tabularnewline
t & Forecast & 95% Lower Bound & 95% Upper Bound \tabularnewline
7 & 16.1001489865076 & 13.6287994163644 & 18.5714985566508 \tabularnewline
8 & 16.1001489865076 & 12.6052460999033 & 19.595051873112 \tabularnewline
9 & 16.1001489865076 & 11.8198308119154 & 20.3804671610998 \tabularnewline
10 & 16.1001489865076 & 11.1576899664759 & 21.0426080065394 \tabularnewline
11 & 16.1001489865076 & 10.5743297120795 & 21.6259682609358 \tabularnewline
12 & 16.1001489865076 & 10.0469303267705 & 22.1533676462448 \tabularnewline
13 & 16.1001489865076 & 9.56193565016422 & 22.6383623228511 \tabularnewline
14 & 16.1001489865076 & 9.1105130073963 & 23.089784965619 \tabularnewline
15 & 16.1001489865076 & 8.6865271584511 & 23.5137708145642 \tabularnewline
16 & 16.1001489865076 & 8.28551104874079 & 23.9147869242745 \tabularnewline
17 & 16.1001489865076 & 7.90409239889591 & 24.2962055741194 \tabularnewline
18 & 16.1001489865076 & 7.53965127455874 & 24.6606466984565 \tabularnewline
\hline
\end{tabular}
%Source: https://freestatistics.org/blog/index.php?pk=285968&T=3

[TABLE]
[ROW][C]Extrapolation Forecasts of Exponential Smoothing[/C][/ROW]
[ROW][C]t[/C][C]Forecast[/C][C]95% Lower Bound[/C][C]95% Upper Bound[/C][/ROW]
[ROW][C]7[/C][C]16.1001489865076[/C][C]13.6287994163644[/C][C]18.5714985566508[/C][/ROW]
[ROW][C]8[/C][C]16.1001489865076[/C][C]12.6052460999033[/C][C]19.595051873112[/C][/ROW]
[ROW][C]9[/C][C]16.1001489865076[/C][C]11.8198308119154[/C][C]20.3804671610998[/C][/ROW]
[ROW][C]10[/C][C]16.1001489865076[/C][C]11.1576899664759[/C][C]21.0426080065394[/C][/ROW]
[ROW][C]11[/C][C]16.1001489865076[/C][C]10.5743297120795[/C][C]21.6259682609358[/C][/ROW]
[ROW][C]12[/C][C]16.1001489865076[/C][C]10.0469303267705[/C][C]22.1533676462448[/C][/ROW]
[ROW][C]13[/C][C]16.1001489865076[/C][C]9.56193565016422[/C][C]22.6383623228511[/C][/ROW]
[ROW][C]14[/C][C]16.1001489865076[/C][C]9.1105130073963[/C][C]23.089784965619[/C][/ROW]
[ROW][C]15[/C][C]16.1001489865076[/C][C]8.6865271584511[/C][C]23.5137708145642[/C][/ROW]
[ROW][C]16[/C][C]16.1001489865076[/C][C]8.28551104874079[/C][C]23.9147869242745[/C][/ROW]
[ROW][C]17[/C][C]16.1001489865076[/C][C]7.90409239889591[/C][C]24.2962055741194[/C][/ROW]
[ROW][C]18[/C][C]16.1001489865076[/C][C]7.53965127455874[/C][C]24.6606466984565[/C][/ROW]
[/TABLE]
Source: https://freestatistics.org/blog/index.php?pk=285968&T=3

Globally Unique Identifier (entire table): ba.freestatistics.org/blog/index.php?pk=285968&T=3

As an alternative you can also use a QR Code:  

The GUIDs for individual cells are displayed in the table below:

Extrapolation Forecasts of Exponential Smoothing
tForecast95% Lower Bound95% Upper Bound
716.100148986507613.628799416364418.5714985566508
816.100148986507612.605246099903319.595051873112
916.100148986507611.819830811915420.3804671610998
1016.100148986507611.157689966475921.0426080065394
1116.100148986507610.574329712079521.6259682609358
1216.100148986507610.046930326770522.1533676462448
1316.10014898650769.5619356501642222.6383623228511
1416.10014898650769.110513007396323.089784965619
1516.10014898650768.686527158451123.5137708145642
1616.10014898650768.2855110487407923.9147869242745
1716.10014898650767.9040923988959124.2962055741194
1816.10014898650767.5396512745587424.6606466984565


Parameters (Session):
par1 = Default ; par2 = 1 ; par3 = 0 ; par4 = 0 ; par5 = 12 ; par6 = White Noise ; par7 = 0.95 ;
Parameters (R input):
par1 = 12 ; par2 = Single ; par3 = additive ;
R code (references can be found in the software module):
par1 <- as.numeric(par1)
if (par2 == 'Single') K <- 1
if (par2 == 'Double') K <- 2
if (par2 == 'Triple') K <- par1
nx <- length(x)
nxmK <- nx - K
x <- ts(x, frequency = par1)
if (par2 == 'Single') fit <- HoltWinters(x, gamma=F, beta=F)
if (par2 == 'Double') fit <- HoltWinters(x, gamma=F)
if (par2 == 'Triple') fit <- HoltWinters(x, seasonal=par3)
fit
myresid <- x - fit$fitted[,'xhat']
bitmap(file='test1.png')
op <- par(mfrow=c(2,1))
plot(fit,ylab='Observed (black) / Fitted (red)',main='Interpolation Fit of Exponential Smoothing')
plot(myresid,ylab='Residuals',main='Interpolation Prediction Errors')
par(op)
dev.off()
bitmap(file='test2.png')
p <- predict(fit, par1, prediction.interval=TRUE)
np <- length(p[,1])
plot(fit,p,ylab='Observed (black) / Fitted (red)',main='Extrapolation Fit of Exponential Smoothing')
dev.off()
bitmap(file='test3.png')
op <- par(mfrow = c(2,2))
acf(as.numeric(myresid),lag.max = nx/2,main='Residual ACF')
spectrum(myresid,main='Residals Periodogram')
cpgram(myresid,main='Residal Cumulative Periodogram')
qqnorm(myresid,main='Residual Normal QQ Plot')
qqline(myresid)
par(op)
dev.off()
load(file='createtable')
a<-table.start()
a<-table.row.start(a)
a<-table.element(a,'Estimated Parameters of Exponential Smoothing',2,TRUE)
a<-table.row.end(a)
a<-table.row.start(a)
a<-table.element(a,'Parameter',header=TRUE)
a<-table.element(a,'Value',header=TRUE)
a<-table.row.end(a)
a<-table.row.start(a)
a<-table.element(a,'alpha',header=TRUE)
a<-table.element(a,fit$alpha)
a<-table.row.end(a)
a<-table.row.start(a)
a<-table.element(a,'beta',header=TRUE)
a<-table.element(a,fit$beta)
a<-table.row.end(a)
a<-table.row.start(a)
a<-table.element(a,'gamma',header=TRUE)
a<-table.element(a,fit$gamma)
a<-table.row.end(a)
a<-table.end(a)
table.save(a,file='mytable.tab')
a<-table.start()
a<-table.row.start(a)
a<-table.element(a,'Interpolation Forecasts of Exponential Smoothing',4,TRUE)
a<-table.row.end(a)
a<-table.row.start(a)
a<-table.element(a,'t',header=TRUE)
a<-table.element(a,'Observed',header=TRUE)
a<-table.element(a,'Fitted',header=TRUE)
a<-table.element(a,'Residuals',header=TRUE)
a<-table.row.end(a)
for (i in 1:nxmK) {
a<-table.row.start(a)
a<-table.element(a,i+K,header=TRUE)
a<-table.element(a,x[i+K])
a<-table.element(a,fit$fitted[i,'xhat'])
a<-table.element(a,myresid[i])
a<-table.row.end(a)
}
a<-table.end(a)
table.save(a,file='mytable1.tab')
a<-table.start()
a<-table.row.start(a)
a<-table.element(a,'Extrapolation Forecasts of Exponential Smoothing',4,TRUE)
a<-table.row.end(a)
a<-table.row.start(a)
a<-table.element(a,'t',header=TRUE)
a<-table.element(a,'Forecast',header=TRUE)
a<-table.element(a,'95% Lower Bound',header=TRUE)
a<-table.element(a,'95% Upper Bound',header=TRUE)
a<-table.row.end(a)
for (i in 1:np) {
a<-table.row.start(a)
a<-table.element(a,nx+i,header=TRUE)
a<-table.element(a,p[i,'fit'])
a<-table.element(a,p[i,'lwr'])
a<-table.element(a,p[i,'upr'])
a<-table.row.end(a)
}
a<-table.end(a)
table.save(a,file='mytable2.tab')