Free Statistics

of Irreproducible Research!

Author's title

Author*The author of this computation has been verified*
R Software Modulerwasp_multipleregression.wasp
Title produced by softwareMultiple Regression
Date of computationWed, 09 Dec 2015 10:43:40 +0000
Cite this page as followsStatistical Computations at FreeStatistics.org, Office for Research Development and Education, URL https://freestatistics.org/blog/index.php?v=date/2015/Dec/09/t14496579398y9pxtjxy23uw4j.htm/, Retrieved Sat, 18 May 2024 10:11:20 +0000
Statistical Computations at FreeStatistics.org, Office for Research Development and Education, URL https://freestatistics.org/blog/index.php?pk=285607, Retrieved Sat, 18 May 2024 10:11:20 +0000
QR Codes:

Original text written by user:
IsPrivate?No (this computation is public)
User-defined keywordspredetermination 5
Estimated Impact102
Family? (F = Feedback message, R = changed R code, M = changed R Module, P = changed Parameters, D = changed Data)
-       [Multiple Regression] [juiste multiple r...] [2015-12-09 10:43:40] [aff7c5b01bb5e691e5ecdf00b98aae53] [Current]
Feedback Forum

Post a new message
Dataseries X:
6.5 2.3 80.8
6.8 1.9 83.7
6.8 0.6 94.2
6.5 0.6 86.2
6.2 -0.4 89
6.2 -1.1 94.7
6.6 -1.7 81.9
6.7 -0.8 80.2
6.5 -1.2 96.5
6.4 -1 95.6
6.5 -0.1 91.9
6.8 0.3 89.9
7.1 0.6 86.5
7.2 0.7 94.6
7.1 1.7 107.1
7 1.8 98.3
6.9 2.3 94.6
6.9 2.5 111.1
7.4 2.6 91.7
7.3 2.3 91.3
7 2.9 110.7
6.8 3 106.4
6.5 2.9 105.1
6.4 3.1 102.6
6.3 3.2 97.5
6 3.4 103.7
5.9 3.5 124.5
5.7 3.4 103.8
5.7 3.4 111.8
5.7 3.7 108.4
6.2 3.8 91.7
6.4 3.6 100.9
6.2 3.6 114.6
6.2 3.6 106.6
6.1 3.9 103.5
6.1 3.5 101.3
6.2 3.7 97.6
6.1 3.7 100.7
6.1 3.4 118.2
6.2 3.2 98.6
6.2 2.8 101.5
6.2 2.3 109.8
6.4 2.3 96.8
6.4 2.9 97.2
6.4 2.8 107
6.7 2.8 111.3
6.9 2.3 104.6
7.1 2.2 98.7
7.3 1.5 97
7.2 1.2 95.5
7.1 1.1 107.7
6.9 1 106.9
6.8 1.2 105.5
6.7 1.6 110
7.2 1.5 103.4
7.2 1 92.8
7.1 0.9 109
7.1 0.6 115.1
7 0.8 105.4
7.1 1 102.3
7.3 1.1 100.4
7.2 1 103.3
7.1 0.9 111.3
7 0.6 109.9
6.9 0.4 106.7
7 0.3 114.3
7.5 0.3 101.5
7.6 0 92.5
7.5 -0.1 119
7.3 0.1 117
7.3 -0.1 105.3
7.4 -0.4 105.5
7.7 -0.7 100.4
7.8 -0.4 98.6
7.7 -0.4 118.5
7.5 0.3 110.1
7.3 0.6 102.8
7.3 0.6 116.5
7.6 0.5 100.5
7.6 0.9 96.8


Summary of computational transaction
Raw Inputview raw input (R code)
Raw Outputview raw output of R engine
Computing time5 seconds
R Server'Gwilym Jenkins' @ jenkins.wessa.net

\begin{tabular}{lllllllll}
\hline
Summary of computational transaction \tabularnewline
Raw Input & view raw input (R code)  \tabularnewline
Raw Output & view raw output of R engine  \tabularnewline
Computing time & 5 seconds \tabularnewline
R Server & 'Gwilym Jenkins' @ jenkins.wessa.net \tabularnewline
\hline
\end{tabular}
%Source: https://freestatistics.org/blog/index.php?pk=285607&T=0

[TABLE]
[ROW][C]Summary of computational transaction[/C][/ROW]
[ROW][C]Raw Input[/C][C]view raw input (R code) [/C][/ROW]
[ROW][C]Raw Output[/C][C]view raw output of R engine [/C][/ROW]
[ROW][C]Computing time[/C][C]5 seconds[/C][/ROW]
[ROW][C]R Server[/C][C]'Gwilym Jenkins' @ jenkins.wessa.net[/C][/ROW]
[/TABLE]
Source: https://freestatistics.org/blog/index.php?pk=285607&T=0

Globally Unique Identifier (entire table): ba.freestatistics.org/blog/index.php?pk=285607&T=0

As an alternative you can also use a QR Code:  

The GUIDs for individual cells are displayed in the table below:

Summary of computational transaction
Raw Inputview raw input (R code)
Raw Outputview raw output of R engine
Computing time5 seconds
R Server'Gwilym Jenkins' @ jenkins.wessa.net


Multiple Linear Regression - Estimated Regression Equation
werkloosheid[t] = + 1.09721 -0.0287449inflatie[t] -0.00457462industrie[t] + 1.12728`werkloosheid(t-1)`[t] -0.371388`werkloosheid(t-2)`[t] + 0.113978`werkloosheid(t-3)`[t] -0.105964`werkloosheid(t-4)`[t] + 0.153319`werkloosheid(t-5)`[t] + e[t]

\begin{tabular}{lllllllll}
\hline
Multiple Linear Regression - Estimated Regression Equation \tabularnewline
werkloosheid[t] =  +  1.09721 -0.0287449inflatie[t] -0.00457462industrie[t] +  1.12728`werkloosheid(t-1)`[t] -0.371388`werkloosheid(t-2)`[t] +  0.113978`werkloosheid(t-3)`[t] -0.105964`werkloosheid(t-4)`[t] +  0.153319`werkloosheid(t-5)`[t]  + e[t] \tabularnewline
 \tabularnewline
\hline
\end{tabular}
%Source: https://freestatistics.org/blog/index.php?pk=285607&T=1

[TABLE]
[ROW][C]Multiple Linear Regression - Estimated Regression Equation[/C][/ROW]
[ROW][C]werkloosheid[t] =  +  1.09721 -0.0287449inflatie[t] -0.00457462industrie[t] +  1.12728`werkloosheid(t-1)`[t] -0.371388`werkloosheid(t-2)`[t] +  0.113978`werkloosheid(t-3)`[t] -0.105964`werkloosheid(t-4)`[t] +  0.153319`werkloosheid(t-5)`[t]  + e[t][/C][/ROW]
[ROW][C][/C][/ROW]
[/TABLE]
Source: https://freestatistics.org/blog/index.php?pk=285607&T=1

Globally Unique Identifier (entire table): ba.freestatistics.org/blog/index.php?pk=285607&T=1

As an alternative you can also use a QR Code:  

The GUIDs for individual cells are displayed in the table below:

Multiple Linear Regression - Estimated Regression Equation
werkloosheid[t] = + 1.09721 -0.0287449inflatie[t] -0.00457462industrie[t] + 1.12728`werkloosheid(t-1)`[t] -0.371388`werkloosheid(t-2)`[t] + 0.113978`werkloosheid(t-3)`[t] -0.105964`werkloosheid(t-4)`[t] + 0.153319`werkloosheid(t-5)`[t] + e[t]


Multiple Linear Regression - Ordinary Least Squares
VariableParameterS.D.T-STATH0: parameter = 02-tail p-value1-tail p-value
(Intercept)+1.097 0.4002+2.7420e+00 0.007825 0.003912
inflatie-0.02874 0.01791-1.6050e+00 0.1132 0.05661
industrie-0.004575 0.003107-1.4720e+00 0.1457 0.07283
`werkloosheid(t-1)`+1.127 0.1343+8.3910e+00 4.748e-12 2.374e-12
`werkloosheid(t-2)`-0.3714 0.2257-1.6450e+00 0.1046 0.0523
`werkloosheid(t-3)`+0.114 0.2049+5.5630e-01 0.5799 0.2899
`werkloosheid(t-4)`-0.106 0.1924-5.5080e-01 0.5836 0.2918
`werkloosheid(t-5)`+0.1533 0.1171+1.3100e+00 0.1948 0.09741

\begin{tabular}{lllllllll}
\hline
Multiple Linear Regression - Ordinary Least Squares \tabularnewline
Variable & Parameter & S.D. & T-STATH0: parameter = 0 & 2-tail p-value & 1-tail p-value \tabularnewline
(Intercept) & +1.097 &  0.4002 & +2.7420e+00 &  0.007825 &  0.003912 \tabularnewline
inflatie & -0.02874 &  0.01791 & -1.6050e+00 &  0.1132 &  0.05661 \tabularnewline
industrie & -0.004575 &  0.003107 & -1.4720e+00 &  0.1457 &  0.07283 \tabularnewline
`werkloosheid(t-1)` & +1.127 &  0.1343 & +8.3910e+00 &  4.748e-12 &  2.374e-12 \tabularnewline
`werkloosheid(t-2)` & -0.3714 &  0.2257 & -1.6450e+00 &  0.1046 &  0.0523 \tabularnewline
`werkloosheid(t-3)` & +0.114 &  0.2049 & +5.5630e-01 &  0.5799 &  0.2899 \tabularnewline
`werkloosheid(t-4)` & -0.106 &  0.1924 & -5.5080e-01 &  0.5836 &  0.2918 \tabularnewline
`werkloosheid(t-5)` & +0.1533 &  0.1171 & +1.3100e+00 &  0.1948 &  0.09741 \tabularnewline
\hline
\end{tabular}
%Source: https://freestatistics.org/blog/index.php?pk=285607&T=2

[TABLE]
[ROW][C]Multiple Linear Regression - Ordinary Least Squares[/C][/ROW]
[ROW][C]Variable[/C][C]Parameter[/C][C]S.D.[/C][C]T-STATH0: parameter = 0[/C][C]2-tail p-value[/C][C]1-tail p-value[/C][/ROW]
[ROW][C](Intercept)[/C][C]+1.097[/C][C] 0.4002[/C][C]+2.7420e+00[/C][C] 0.007825[/C][C] 0.003912[/C][/ROW]
[ROW][C]inflatie[/C][C]-0.02874[/C][C] 0.01791[/C][C]-1.6050e+00[/C][C] 0.1132[/C][C] 0.05661[/C][/ROW]
[ROW][C]industrie[/C][C]-0.004575[/C][C] 0.003107[/C][C]-1.4720e+00[/C][C] 0.1457[/C][C] 0.07283[/C][/ROW]
[ROW][C]`werkloosheid(t-1)`[/C][C]+1.127[/C][C] 0.1343[/C][C]+8.3910e+00[/C][C] 4.748e-12[/C][C] 2.374e-12[/C][/ROW]
[ROW][C]`werkloosheid(t-2)`[/C][C]-0.3714[/C][C] 0.2257[/C][C]-1.6450e+00[/C][C] 0.1046[/C][C] 0.0523[/C][/ROW]
[ROW][C]`werkloosheid(t-3)`[/C][C]+0.114[/C][C] 0.2049[/C][C]+5.5630e-01[/C][C] 0.5799[/C][C] 0.2899[/C][/ROW]
[ROW][C]`werkloosheid(t-4)`[/C][C]-0.106[/C][C] 0.1924[/C][C]-5.5080e-01[/C][C] 0.5836[/C][C] 0.2918[/C][/ROW]
[ROW][C]`werkloosheid(t-5)`[/C][C]+0.1533[/C][C] 0.1171[/C][C]+1.3100e+00[/C][C] 0.1948[/C][C] 0.09741[/C][/ROW]
[/TABLE]
Source: https://freestatistics.org/blog/index.php?pk=285607&T=2

Globally Unique Identifier (entire table): ba.freestatistics.org/blog/index.php?pk=285607&T=2

As an alternative you can also use a QR Code:  

The GUIDs for individual cells are displayed in the table below:

Multiple Linear Regression - Ordinary Least Squares
VariableParameterS.D.T-STATH0: parameter = 02-tail p-value1-tail p-value
(Intercept)+1.097 0.4002+2.7420e+00 0.007825 0.003912
inflatie-0.02874 0.01791-1.6050e+00 0.1132 0.05661
industrie-0.004575 0.003107-1.4720e+00 0.1457 0.07283
`werkloosheid(t-1)`+1.127 0.1343+8.3910e+00 4.748e-12 2.374e-12
`werkloosheid(t-2)`-0.3714 0.2257-1.6450e+00 0.1046 0.0523
`werkloosheid(t-3)`+0.114 0.2049+5.5630e-01 0.5799 0.2899
`werkloosheid(t-4)`-0.106 0.1924-5.5080e-01 0.5836 0.2918
`werkloosheid(t-5)`+0.1533 0.1171+1.3100e+00 0.1948 0.09741


Multiple Linear Regression - Regression Statistics
Multiple R 0.9546
R-squared 0.9113
Adjusted R-squared 0.902
F-TEST (value) 98.28
F-TEST (DF numerator)7
F-TEST (DF denominator)67
p-value 0
Multiple Linear Regression - Residual Statistics
Residual Standard Deviation 0.1696
Sum Squared Residuals 1.926

\begin{tabular}{lllllllll}
\hline
Multiple Linear Regression - Regression Statistics \tabularnewline
Multiple R &  0.9546 \tabularnewline
R-squared &  0.9113 \tabularnewline
Adjusted R-squared &  0.902 \tabularnewline
F-TEST (value) &  98.28 \tabularnewline
F-TEST (DF numerator) & 7 \tabularnewline
F-TEST (DF denominator) & 67 \tabularnewline
p-value &  0 \tabularnewline
Multiple Linear Regression - Residual Statistics \tabularnewline
Residual Standard Deviation &  0.1696 \tabularnewline
Sum Squared Residuals &  1.926 \tabularnewline
\hline
\end{tabular}
%Source: https://freestatistics.org/blog/index.php?pk=285607&T=3

[TABLE]
[ROW][C]Multiple Linear Regression - Regression Statistics[/C][/ROW]
[ROW][C]Multiple R[/C][C] 0.9546[/C][/ROW]
[ROW][C]R-squared[/C][C] 0.9113[/C][/ROW]
[ROW][C]Adjusted R-squared[/C][C] 0.902[/C][/ROW]
[ROW][C]F-TEST (value)[/C][C] 98.28[/C][/ROW]
[ROW][C]F-TEST (DF numerator)[/C][C]7[/C][/ROW]
[ROW][C]F-TEST (DF denominator)[/C][C]67[/C][/ROW]
[ROW][C]p-value[/C][C] 0[/C][/ROW]
[ROW][C]Multiple Linear Regression - Residual Statistics[/C][/ROW]
[ROW][C]Residual Standard Deviation[/C][C] 0.1696[/C][/ROW]
[ROW][C]Sum Squared Residuals[/C][C] 1.926[/C][/ROW]
[/TABLE]
Source: https://freestatistics.org/blog/index.php?pk=285607&T=3

Globally Unique Identifier (entire table): ba.freestatistics.org/blog/index.php?pk=285607&T=3

As an alternative you can also use a QR Code:  

The GUIDs for individual cells are displayed in the table below:

Multiple Linear Regression - Regression Statistics
Multiple R 0.9546
R-squared 0.9113
Adjusted R-squared 0.902
F-TEST (value) 98.28
F-TEST (DF numerator)7
F-TEST (DF denominator)67
p-value 0
Multiple Linear Regression - Residual Statistics
Residual Standard Deviation 0.1696
Sum Squared Residuals 1.926


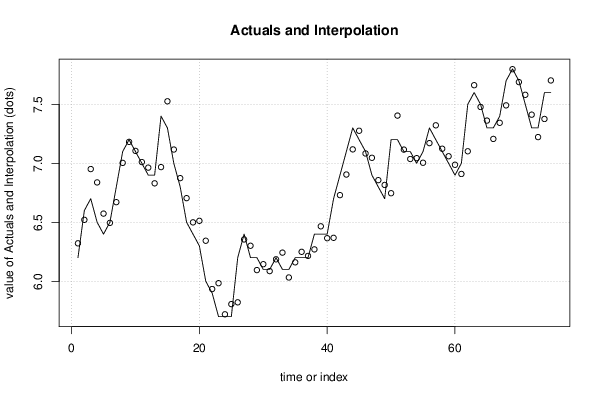
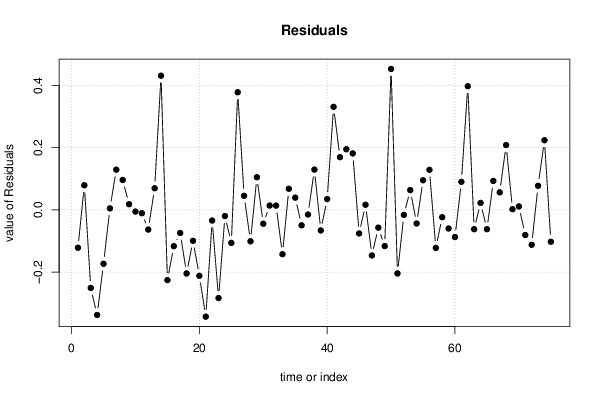
Multiple Linear Regression - Actuals, Interpolation, and Residuals
Time or IndexActualsInterpolationForecastResidualsPrediction Error
1 6.2 6.322-0.1218
2 6.6 6.521 0.07918
3 6.7 6.951-0.2512
4 6.5 6.838-0.3381
5 6.4 6.574-0.1735
6 6.5 6.495 0.004885
7 6.8 6.671 0.1294
8 7.1 7.004 0.09633
9 7.2 7.182 0.01816
10 7.1 7.105-0.005489
11 7 7.011-0.01074
12 6.9 6.963-0.06331
13 6.9 6.83 0.06951
14 7.4 6.968 0.432
15 7.3 7.526-0.226
16 7 7.117-0.1168
17 6.8 6.874-0.07425
18 6.5 6.705-0.2047
19 6.4 6.5-0.0995
20 6.3 6.512-0.2123
21 6 6.344-0.3436
22 5.9 5.934-0.03426
23 5.7 5.984-0.2837
24 5.7 5.72-0.01988
25 5.7 5.806-0.1061
26 6.2 5.821 0.3785
27 6.4 6.355 0.04536
28 6.2 6.301-0.1011
29 6.2 6.095 0.1051
30 6.1 6.145-0.04456
31 6.1 6.086 0.01393
32 6.2 6.186 0.01376
33 6.1 6.243-0.1427
34 6.1 6.032 0.06798
35 6.2 6.161 0.03936
36 6.2 6.25-0.0496
37 6.2 6.215-0.0148
38 6.4 6.27 0.1297
39 6.4 6.466-0.06612
40 6.4 6.365 0.03479
41 6.7 6.368 0.3317
42 6.9 6.73 0.1696
43 7.1 6.905 0.1951
44 7.3 7.118 0.1818
45 7.2 7.276-0.07586
46 7.1 7.084 0.01648
47 6.9 7.047-0.1467
48 6.8 6.857-0.05714
49 6.7 6.816-0.1165
50 7.2 6.746 0.4536
51 7.2 7.405-0.2045
52 7.1 7.116-0.01613
53 7.1 7.036 0.06363
54 7 7.044-0.04382
55 7.1 7.005 0.09521
56 7.3 7.171 0.1289
57 7.2 7.322-0.1223
58 7.1 7.124-0.02353
59 7 7.06-0.05984
60 6.9 6.987-0.08738
61 7 6.91 0.09024
62 7.5 7.102 0.398
63 7.6 7.662-0.06221
64 7.5 7.478 0.02245
65 7.3 7.362-0.06214
66 7.3 7.207 0.09315
67 7.4 7.343 0.0565
68 7.7 7.491 0.2087
69 7.8 7.798 0.002169
70 7.7 7.689 0.01116
71 7.5 7.581-0.08088
72 7.3 7.412-0.1123
73 7.3 7.222 0.07758
74 7.6 7.376 0.2241
75 7.6 7.703-0.1026

\begin{tabular}{lllllllll}
\hline
Multiple Linear Regression - Actuals, Interpolation, and Residuals \tabularnewline
Time or Index & Actuals & InterpolationForecast & ResidualsPrediction Error \tabularnewline
1 &  6.2 &  6.322 & -0.1218 \tabularnewline
2 &  6.6 &  6.521 &  0.07918 \tabularnewline
3 &  6.7 &  6.951 & -0.2512 \tabularnewline
4 &  6.5 &  6.838 & -0.3381 \tabularnewline
5 &  6.4 &  6.574 & -0.1735 \tabularnewline
6 &  6.5 &  6.495 &  0.004885 \tabularnewline
7 &  6.8 &  6.671 &  0.1294 \tabularnewline
8 &  7.1 &  7.004 &  0.09633 \tabularnewline
9 &  7.2 &  7.182 &  0.01816 \tabularnewline
10 &  7.1 &  7.105 & -0.005489 \tabularnewline
11 &  7 &  7.011 & -0.01074 \tabularnewline
12 &  6.9 &  6.963 & -0.06331 \tabularnewline
13 &  6.9 &  6.83 &  0.06951 \tabularnewline
14 &  7.4 &  6.968 &  0.432 \tabularnewline
15 &  7.3 &  7.526 & -0.226 \tabularnewline
16 &  7 &  7.117 & -0.1168 \tabularnewline
17 &  6.8 &  6.874 & -0.07425 \tabularnewline
18 &  6.5 &  6.705 & -0.2047 \tabularnewline
19 &  6.4 &  6.5 & -0.0995 \tabularnewline
20 &  6.3 &  6.512 & -0.2123 \tabularnewline
21 &  6 &  6.344 & -0.3436 \tabularnewline
22 &  5.9 &  5.934 & -0.03426 \tabularnewline
23 &  5.7 &  5.984 & -0.2837 \tabularnewline
24 &  5.7 &  5.72 & -0.01988 \tabularnewline
25 &  5.7 &  5.806 & -0.1061 \tabularnewline
26 &  6.2 &  5.821 &  0.3785 \tabularnewline
27 &  6.4 &  6.355 &  0.04536 \tabularnewline
28 &  6.2 &  6.301 & -0.1011 \tabularnewline
29 &  6.2 &  6.095 &  0.1051 \tabularnewline
30 &  6.1 &  6.145 & -0.04456 \tabularnewline
31 &  6.1 &  6.086 &  0.01393 \tabularnewline
32 &  6.2 &  6.186 &  0.01376 \tabularnewline
33 &  6.1 &  6.243 & -0.1427 \tabularnewline
34 &  6.1 &  6.032 &  0.06798 \tabularnewline
35 &  6.2 &  6.161 &  0.03936 \tabularnewline
36 &  6.2 &  6.25 & -0.0496 \tabularnewline
37 &  6.2 &  6.215 & -0.0148 \tabularnewline
38 &  6.4 &  6.27 &  0.1297 \tabularnewline
39 &  6.4 &  6.466 & -0.06612 \tabularnewline
40 &  6.4 &  6.365 &  0.03479 \tabularnewline
41 &  6.7 &  6.368 &  0.3317 \tabularnewline
42 &  6.9 &  6.73 &  0.1696 \tabularnewline
43 &  7.1 &  6.905 &  0.1951 \tabularnewline
44 &  7.3 &  7.118 &  0.1818 \tabularnewline
45 &  7.2 &  7.276 & -0.07586 \tabularnewline
46 &  7.1 &  7.084 &  0.01648 \tabularnewline
47 &  6.9 &  7.047 & -0.1467 \tabularnewline
48 &  6.8 &  6.857 & -0.05714 \tabularnewline
49 &  6.7 &  6.816 & -0.1165 \tabularnewline
50 &  7.2 &  6.746 &  0.4536 \tabularnewline
51 &  7.2 &  7.405 & -0.2045 \tabularnewline
52 &  7.1 &  7.116 & -0.01613 \tabularnewline
53 &  7.1 &  7.036 &  0.06363 \tabularnewline
54 &  7 &  7.044 & -0.04382 \tabularnewline
55 &  7.1 &  7.005 &  0.09521 \tabularnewline
56 &  7.3 &  7.171 &  0.1289 \tabularnewline
57 &  7.2 &  7.322 & -0.1223 \tabularnewline
58 &  7.1 &  7.124 & -0.02353 \tabularnewline
59 &  7 &  7.06 & -0.05984 \tabularnewline
60 &  6.9 &  6.987 & -0.08738 \tabularnewline
61 &  7 &  6.91 &  0.09024 \tabularnewline
62 &  7.5 &  7.102 &  0.398 \tabularnewline
63 &  7.6 &  7.662 & -0.06221 \tabularnewline
64 &  7.5 &  7.478 &  0.02245 \tabularnewline
65 &  7.3 &  7.362 & -0.06214 \tabularnewline
66 &  7.3 &  7.207 &  0.09315 \tabularnewline
67 &  7.4 &  7.343 &  0.0565 \tabularnewline
68 &  7.7 &  7.491 &  0.2087 \tabularnewline
69 &  7.8 &  7.798 &  0.002169 \tabularnewline
70 &  7.7 &  7.689 &  0.01116 \tabularnewline
71 &  7.5 &  7.581 & -0.08088 \tabularnewline
72 &  7.3 &  7.412 & -0.1123 \tabularnewline
73 &  7.3 &  7.222 &  0.07758 \tabularnewline
74 &  7.6 &  7.376 &  0.2241 \tabularnewline
75 &  7.6 &  7.703 & -0.1026 \tabularnewline
\hline
\end{tabular}
%Source: https://freestatistics.org/blog/index.php?pk=285607&T=4

[TABLE]
[ROW][C]Multiple Linear Regression - Actuals, Interpolation, and Residuals[/C][/ROW]
[ROW][C]Time or Index[/C][C]Actuals[/C][C]InterpolationForecast[/C][C]ResidualsPrediction Error[/C][/ROW]
[ROW][C]1[/C][C] 6.2[/C][C] 6.322[/C][C]-0.1218[/C][/ROW]
[ROW][C]2[/C][C] 6.6[/C][C] 6.521[/C][C] 0.07918[/C][/ROW]
[ROW][C]3[/C][C] 6.7[/C][C] 6.951[/C][C]-0.2512[/C][/ROW]
[ROW][C]4[/C][C] 6.5[/C][C] 6.838[/C][C]-0.3381[/C][/ROW]
[ROW][C]5[/C][C] 6.4[/C][C] 6.574[/C][C]-0.1735[/C][/ROW]
[ROW][C]6[/C][C] 6.5[/C][C] 6.495[/C][C] 0.004885[/C][/ROW]
[ROW][C]7[/C][C] 6.8[/C][C] 6.671[/C][C] 0.1294[/C][/ROW]
[ROW][C]8[/C][C] 7.1[/C][C] 7.004[/C][C] 0.09633[/C][/ROW]
[ROW][C]9[/C][C] 7.2[/C][C] 7.182[/C][C] 0.01816[/C][/ROW]
[ROW][C]10[/C][C] 7.1[/C][C] 7.105[/C][C]-0.005489[/C][/ROW]
[ROW][C]11[/C][C] 7[/C][C] 7.011[/C][C]-0.01074[/C][/ROW]
[ROW][C]12[/C][C] 6.9[/C][C] 6.963[/C][C]-0.06331[/C][/ROW]
[ROW][C]13[/C][C] 6.9[/C][C] 6.83[/C][C] 0.06951[/C][/ROW]
[ROW][C]14[/C][C] 7.4[/C][C] 6.968[/C][C] 0.432[/C][/ROW]
[ROW][C]15[/C][C] 7.3[/C][C] 7.526[/C][C]-0.226[/C][/ROW]
[ROW][C]16[/C][C] 7[/C][C] 7.117[/C][C]-0.1168[/C][/ROW]
[ROW][C]17[/C][C] 6.8[/C][C] 6.874[/C][C]-0.07425[/C][/ROW]
[ROW][C]18[/C][C] 6.5[/C][C] 6.705[/C][C]-0.2047[/C][/ROW]
[ROW][C]19[/C][C] 6.4[/C][C] 6.5[/C][C]-0.0995[/C][/ROW]
[ROW][C]20[/C][C] 6.3[/C][C] 6.512[/C][C]-0.2123[/C][/ROW]
[ROW][C]21[/C][C] 6[/C][C] 6.344[/C][C]-0.3436[/C][/ROW]
[ROW][C]22[/C][C] 5.9[/C][C] 5.934[/C][C]-0.03426[/C][/ROW]
[ROW][C]23[/C][C] 5.7[/C][C] 5.984[/C][C]-0.2837[/C][/ROW]
[ROW][C]24[/C][C] 5.7[/C][C] 5.72[/C][C]-0.01988[/C][/ROW]
[ROW][C]25[/C][C] 5.7[/C][C] 5.806[/C][C]-0.1061[/C][/ROW]
[ROW][C]26[/C][C] 6.2[/C][C] 5.821[/C][C] 0.3785[/C][/ROW]
[ROW][C]27[/C][C] 6.4[/C][C] 6.355[/C][C] 0.04536[/C][/ROW]
[ROW][C]28[/C][C] 6.2[/C][C] 6.301[/C][C]-0.1011[/C][/ROW]
[ROW][C]29[/C][C] 6.2[/C][C] 6.095[/C][C] 0.1051[/C][/ROW]
[ROW][C]30[/C][C] 6.1[/C][C] 6.145[/C][C]-0.04456[/C][/ROW]
[ROW][C]31[/C][C] 6.1[/C][C] 6.086[/C][C] 0.01393[/C][/ROW]
[ROW][C]32[/C][C] 6.2[/C][C] 6.186[/C][C] 0.01376[/C][/ROW]
[ROW][C]33[/C][C] 6.1[/C][C] 6.243[/C][C]-0.1427[/C][/ROW]
[ROW][C]34[/C][C] 6.1[/C][C] 6.032[/C][C] 0.06798[/C][/ROW]
[ROW][C]35[/C][C] 6.2[/C][C] 6.161[/C][C] 0.03936[/C][/ROW]
[ROW][C]36[/C][C] 6.2[/C][C] 6.25[/C][C]-0.0496[/C][/ROW]
[ROW][C]37[/C][C] 6.2[/C][C] 6.215[/C][C]-0.0148[/C][/ROW]
[ROW][C]38[/C][C] 6.4[/C][C] 6.27[/C][C] 0.1297[/C][/ROW]
[ROW][C]39[/C][C] 6.4[/C][C] 6.466[/C][C]-0.06612[/C][/ROW]
[ROW][C]40[/C][C] 6.4[/C][C] 6.365[/C][C] 0.03479[/C][/ROW]
[ROW][C]41[/C][C] 6.7[/C][C] 6.368[/C][C] 0.3317[/C][/ROW]
[ROW][C]42[/C][C] 6.9[/C][C] 6.73[/C][C] 0.1696[/C][/ROW]
[ROW][C]43[/C][C] 7.1[/C][C] 6.905[/C][C] 0.1951[/C][/ROW]
[ROW][C]44[/C][C] 7.3[/C][C] 7.118[/C][C] 0.1818[/C][/ROW]
[ROW][C]45[/C][C] 7.2[/C][C] 7.276[/C][C]-0.07586[/C][/ROW]
[ROW][C]46[/C][C] 7.1[/C][C] 7.084[/C][C] 0.01648[/C][/ROW]
[ROW][C]47[/C][C] 6.9[/C][C] 7.047[/C][C]-0.1467[/C][/ROW]
[ROW][C]48[/C][C] 6.8[/C][C] 6.857[/C][C]-0.05714[/C][/ROW]
[ROW][C]49[/C][C] 6.7[/C][C] 6.816[/C][C]-0.1165[/C][/ROW]
[ROW][C]50[/C][C] 7.2[/C][C] 6.746[/C][C] 0.4536[/C][/ROW]
[ROW][C]51[/C][C] 7.2[/C][C] 7.405[/C][C]-0.2045[/C][/ROW]
[ROW][C]52[/C][C] 7.1[/C][C] 7.116[/C][C]-0.01613[/C][/ROW]
[ROW][C]53[/C][C] 7.1[/C][C] 7.036[/C][C] 0.06363[/C][/ROW]
[ROW][C]54[/C][C] 7[/C][C] 7.044[/C][C]-0.04382[/C][/ROW]
[ROW][C]55[/C][C] 7.1[/C][C] 7.005[/C][C] 0.09521[/C][/ROW]
[ROW][C]56[/C][C] 7.3[/C][C] 7.171[/C][C] 0.1289[/C][/ROW]
[ROW][C]57[/C][C] 7.2[/C][C] 7.322[/C][C]-0.1223[/C][/ROW]
[ROW][C]58[/C][C] 7.1[/C][C] 7.124[/C][C]-0.02353[/C][/ROW]
[ROW][C]59[/C][C] 7[/C][C] 7.06[/C][C]-0.05984[/C][/ROW]
[ROW][C]60[/C][C] 6.9[/C][C] 6.987[/C][C]-0.08738[/C][/ROW]
[ROW][C]61[/C][C] 7[/C][C] 6.91[/C][C] 0.09024[/C][/ROW]
[ROW][C]62[/C][C] 7.5[/C][C] 7.102[/C][C] 0.398[/C][/ROW]
[ROW][C]63[/C][C] 7.6[/C][C] 7.662[/C][C]-0.06221[/C][/ROW]
[ROW][C]64[/C][C] 7.5[/C][C] 7.478[/C][C] 0.02245[/C][/ROW]
[ROW][C]65[/C][C] 7.3[/C][C] 7.362[/C][C]-0.06214[/C][/ROW]
[ROW][C]66[/C][C] 7.3[/C][C] 7.207[/C][C] 0.09315[/C][/ROW]
[ROW][C]67[/C][C] 7.4[/C][C] 7.343[/C][C] 0.0565[/C][/ROW]
[ROW][C]68[/C][C] 7.7[/C][C] 7.491[/C][C] 0.2087[/C][/ROW]
[ROW][C]69[/C][C] 7.8[/C][C] 7.798[/C][C] 0.002169[/C][/ROW]
[ROW][C]70[/C][C] 7.7[/C][C] 7.689[/C][C] 0.01116[/C][/ROW]
[ROW][C]71[/C][C] 7.5[/C][C] 7.581[/C][C]-0.08088[/C][/ROW]
[ROW][C]72[/C][C] 7.3[/C][C] 7.412[/C][C]-0.1123[/C][/ROW]
[ROW][C]73[/C][C] 7.3[/C][C] 7.222[/C][C] 0.07758[/C][/ROW]
[ROW][C]74[/C][C] 7.6[/C][C] 7.376[/C][C] 0.2241[/C][/ROW]
[ROW][C]75[/C][C] 7.6[/C][C] 7.703[/C][C]-0.1026[/C][/ROW]
[/TABLE]
Source: https://freestatistics.org/blog/index.php?pk=285607&T=4

Globally Unique Identifier (entire table): ba.freestatistics.org/blog/index.php?pk=285607&T=4

As an alternative you can also use a QR Code:  

The GUIDs for individual cells are displayed in the table below:

Multiple Linear Regression - Actuals, Interpolation, and Residuals
Time or IndexActualsInterpolationForecastResidualsPrediction Error
1 6.2 6.322-0.1218
2 6.6 6.521 0.07918
3 6.7 6.951-0.2512
4 6.5 6.838-0.3381
5 6.4 6.574-0.1735
6 6.5 6.495 0.004885
7 6.8 6.671 0.1294
8 7.1 7.004 0.09633
9 7.2 7.182 0.01816
10 7.1 7.105-0.005489
11 7 7.011-0.01074
12 6.9 6.963-0.06331
13 6.9 6.83 0.06951
14 7.4 6.968 0.432
15 7.3 7.526-0.226
16 7 7.117-0.1168
17 6.8 6.874-0.07425
18 6.5 6.705-0.2047
19 6.4 6.5-0.0995
20 6.3 6.512-0.2123
21 6 6.344-0.3436
22 5.9 5.934-0.03426
23 5.7 5.984-0.2837
24 5.7 5.72-0.01988
25 5.7 5.806-0.1061
26 6.2 5.821 0.3785
27 6.4 6.355 0.04536
28 6.2 6.301-0.1011
29 6.2 6.095 0.1051
30 6.1 6.145-0.04456
31 6.1 6.086 0.01393
32 6.2 6.186 0.01376
33 6.1 6.243-0.1427
34 6.1 6.032 0.06798
35 6.2 6.161 0.03936
36 6.2 6.25-0.0496
37 6.2 6.215-0.0148
38 6.4 6.27 0.1297
39 6.4 6.466-0.06612
40 6.4 6.365 0.03479
41 6.7 6.368 0.3317
42 6.9 6.73 0.1696
43 7.1 6.905 0.1951
44 7.3 7.118 0.1818
45 7.2 7.276-0.07586
46 7.1 7.084 0.01648
47 6.9 7.047-0.1467
48 6.8 6.857-0.05714
49 6.7 6.816-0.1165
50 7.2 6.746 0.4536
51 7.2 7.405-0.2045
52 7.1 7.116-0.01613
53 7.1 7.036 0.06363
54 7 7.044-0.04382
55 7.1 7.005 0.09521
56 7.3 7.171 0.1289
57 7.2 7.322-0.1223
58 7.1 7.124-0.02353
59 7 7.06-0.05984
60 6.9 6.987-0.08738
61 7 6.91 0.09024
62 7.5 7.102 0.398
63 7.6 7.662-0.06221
64 7.5 7.478 0.02245
65 7.3 7.362-0.06214
66 7.3 7.207 0.09315
67 7.4 7.343 0.0565
68 7.7 7.491 0.2087
69 7.8 7.798 0.002169
70 7.7 7.689 0.01116
71 7.5 7.581-0.08088
72 7.3 7.412-0.1123
73 7.3 7.222 0.07758
74 7.6 7.376 0.2241
75 7.6 7.703-0.1026


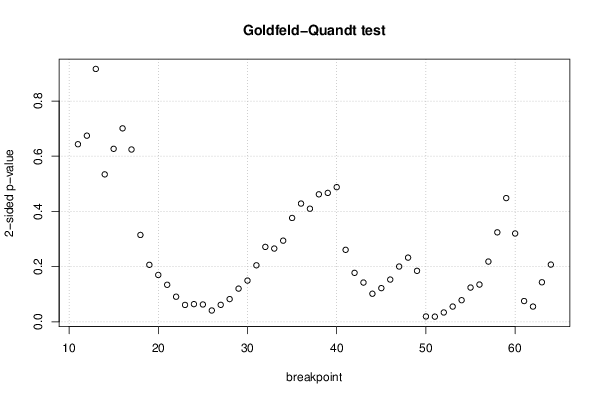
Goldfeld-Quandt test for Heteroskedasticity
p-valuesAlternative Hypothesis
breakpoint indexgreater2-sidedless
11 0.6783 0.6435 0.3217
12 0.6628 0.6744 0.3372
13 0.5418 0.9163 0.4582
14 0.7329 0.5342 0.2671
15 0.6866 0.6268 0.3134
16 0.6495 0.701 0.3505
17 0.6878 0.6244 0.3122
18 0.8427 0.3146 0.1573
19 0.8968 0.2064 0.1032
20 0.9152 0.1696 0.0848
21 0.933 0.134 0.06701
22 0.9547 0.09069 0.04534
23 0.9695 0.0609 0.03045
24 0.9681 0.06387 0.03193
25 0.9687 0.0626 0.0313
26 0.9796 0.04082 0.02041
27 0.9693 0.06131 0.03065
28 0.9589 0.0821 0.04105
29 0.94 0.1201 0.06005
30 0.9254 0.1492 0.0746
31 0.8977 0.2046 0.1023
32 0.8643 0.2713 0.1356
33 0.8673 0.2653 0.1327
34 0.853 0.2939 0.147
35 0.8119 0.3761 0.1881
36 0.7858 0.4284 0.2142
37 0.7952 0.4096 0.2048
38 0.7691 0.4619 0.2309
39 0.7665 0.467 0.2335
40 0.756 0.4879 0.244
41 0.8696 0.2607 0.1304
42 0.9114 0.1773 0.08864
43 0.9289 0.1421 0.07106
44 0.9492 0.1015 0.05076
45 0.9391 0.1218 0.06092
46 0.9236 0.1529 0.07645
47 0.8999 0.2002 0.1001
48 0.8838 0.2324 0.1162
49 0.9077 0.1845 0.09227
50 0.9904 0.01922 0.009612
51 0.9908 0.01848 0.009241
52 0.9832 0.03363 0.01681
53 0.9725 0.05502 0.02751
54 0.9609 0.07812 0.03906
55 0.938 0.1239 0.06196
56 0.9326 0.1348 0.0674
57 0.8909 0.2182 0.1091
58 0.838 0.3241 0.162
59 0.7759 0.4483 0.2241
60 0.84 0.3199 0.16
61 0.9624 0.07513 0.03757
62 0.9725 0.05504 0.02752
63 0.9284 0.1432 0.07158
64 0.8964 0.2072 0.1036

\begin{tabular}{lllllllll}
\hline
Goldfeld-Quandt test for Heteroskedasticity \tabularnewline
p-values & Alternative Hypothesis \tabularnewline
breakpoint index & greater & 2-sided & less \tabularnewline
11 &  0.6783 &  0.6435 &  0.3217 \tabularnewline
12 &  0.6628 &  0.6744 &  0.3372 \tabularnewline
13 &  0.5418 &  0.9163 &  0.4582 \tabularnewline
14 &  0.7329 &  0.5342 &  0.2671 \tabularnewline
15 &  0.6866 &  0.6268 &  0.3134 \tabularnewline
16 &  0.6495 &  0.701 &  0.3505 \tabularnewline
17 &  0.6878 &  0.6244 &  0.3122 \tabularnewline
18 &  0.8427 &  0.3146 &  0.1573 \tabularnewline
19 &  0.8968 &  0.2064 &  0.1032 \tabularnewline
20 &  0.9152 &  0.1696 &  0.0848 \tabularnewline
21 &  0.933 &  0.134 &  0.06701 \tabularnewline
22 &  0.9547 &  0.09069 &  0.04534 \tabularnewline
23 &  0.9695 &  0.0609 &  0.03045 \tabularnewline
24 &  0.9681 &  0.06387 &  0.03193 \tabularnewline
25 &  0.9687 &  0.0626 &  0.0313 \tabularnewline
26 &  0.9796 &  0.04082 &  0.02041 \tabularnewline
27 &  0.9693 &  0.06131 &  0.03065 \tabularnewline
28 &  0.9589 &  0.0821 &  0.04105 \tabularnewline
29 &  0.94 &  0.1201 &  0.06005 \tabularnewline
30 &  0.9254 &  0.1492 &  0.0746 \tabularnewline
31 &  0.8977 &  0.2046 &  0.1023 \tabularnewline
32 &  0.8643 &  0.2713 &  0.1356 \tabularnewline
33 &  0.8673 &  0.2653 &  0.1327 \tabularnewline
34 &  0.853 &  0.2939 &  0.147 \tabularnewline
35 &  0.8119 &  0.3761 &  0.1881 \tabularnewline
36 &  0.7858 &  0.4284 &  0.2142 \tabularnewline
37 &  0.7952 &  0.4096 &  0.2048 \tabularnewline
38 &  0.7691 &  0.4619 &  0.2309 \tabularnewline
39 &  0.7665 &  0.467 &  0.2335 \tabularnewline
40 &  0.756 &  0.4879 &  0.244 \tabularnewline
41 &  0.8696 &  0.2607 &  0.1304 \tabularnewline
42 &  0.9114 &  0.1773 &  0.08864 \tabularnewline
43 &  0.9289 &  0.1421 &  0.07106 \tabularnewline
44 &  0.9492 &  0.1015 &  0.05076 \tabularnewline
45 &  0.9391 &  0.1218 &  0.06092 \tabularnewline
46 &  0.9236 &  0.1529 &  0.07645 \tabularnewline
47 &  0.8999 &  0.2002 &  0.1001 \tabularnewline
48 &  0.8838 &  0.2324 &  0.1162 \tabularnewline
49 &  0.9077 &  0.1845 &  0.09227 \tabularnewline
50 &  0.9904 &  0.01922 &  0.009612 \tabularnewline
51 &  0.9908 &  0.01848 &  0.009241 \tabularnewline
52 &  0.9832 &  0.03363 &  0.01681 \tabularnewline
53 &  0.9725 &  0.05502 &  0.02751 \tabularnewline
54 &  0.9609 &  0.07812 &  0.03906 \tabularnewline
55 &  0.938 &  0.1239 &  0.06196 \tabularnewline
56 &  0.9326 &  0.1348 &  0.0674 \tabularnewline
57 &  0.8909 &  0.2182 &  0.1091 \tabularnewline
58 &  0.838 &  0.3241 &  0.162 \tabularnewline
59 &  0.7759 &  0.4483 &  0.2241 \tabularnewline
60 &  0.84 &  0.3199 &  0.16 \tabularnewline
61 &  0.9624 &  0.07513 &  0.03757 \tabularnewline
62 &  0.9725 &  0.05504 &  0.02752 \tabularnewline
63 &  0.9284 &  0.1432 &  0.07158 \tabularnewline
64 &  0.8964 &  0.2072 &  0.1036 \tabularnewline
\hline
\end{tabular}
%Source: https://freestatistics.org/blog/index.php?pk=285607&T=5

[TABLE]
[ROW][C]Goldfeld-Quandt test for Heteroskedasticity[/C][/ROW]
[ROW][C]p-values[/C][C]Alternative Hypothesis[/C][/ROW]
[ROW][C]breakpoint index[/C][C]greater[/C][C]2-sided[/C][C]less[/C][/ROW]
[ROW][C]11[/C][C] 0.6783[/C][C] 0.6435[/C][C] 0.3217[/C][/ROW]
[ROW][C]12[/C][C] 0.6628[/C][C] 0.6744[/C][C] 0.3372[/C][/ROW]
[ROW][C]13[/C][C] 0.5418[/C][C] 0.9163[/C][C] 0.4582[/C][/ROW]
[ROW][C]14[/C][C] 0.7329[/C][C] 0.5342[/C][C] 0.2671[/C][/ROW]
[ROW][C]15[/C][C] 0.6866[/C][C] 0.6268[/C][C] 0.3134[/C][/ROW]
[ROW][C]16[/C][C] 0.6495[/C][C] 0.701[/C][C] 0.3505[/C][/ROW]
[ROW][C]17[/C][C] 0.6878[/C][C] 0.6244[/C][C] 0.3122[/C][/ROW]
[ROW][C]18[/C][C] 0.8427[/C][C] 0.3146[/C][C] 0.1573[/C][/ROW]
[ROW][C]19[/C][C] 0.8968[/C][C] 0.2064[/C][C] 0.1032[/C][/ROW]
[ROW][C]20[/C][C] 0.9152[/C][C] 0.1696[/C][C] 0.0848[/C][/ROW]
[ROW][C]21[/C][C] 0.933[/C][C] 0.134[/C][C] 0.06701[/C][/ROW]
[ROW][C]22[/C][C] 0.9547[/C][C] 0.09069[/C][C] 0.04534[/C][/ROW]
[ROW][C]23[/C][C] 0.9695[/C][C] 0.0609[/C][C] 0.03045[/C][/ROW]
[ROW][C]24[/C][C] 0.9681[/C][C] 0.06387[/C][C] 0.03193[/C][/ROW]
[ROW][C]25[/C][C] 0.9687[/C][C] 0.0626[/C][C] 0.0313[/C][/ROW]
[ROW][C]26[/C][C] 0.9796[/C][C] 0.04082[/C][C] 0.02041[/C][/ROW]
[ROW][C]27[/C][C] 0.9693[/C][C] 0.06131[/C][C] 0.03065[/C][/ROW]
[ROW][C]28[/C][C] 0.9589[/C][C] 0.0821[/C][C] 0.04105[/C][/ROW]
[ROW][C]29[/C][C] 0.94[/C][C] 0.1201[/C][C] 0.06005[/C][/ROW]
[ROW][C]30[/C][C] 0.9254[/C][C] 0.1492[/C][C] 0.0746[/C][/ROW]
[ROW][C]31[/C][C] 0.8977[/C][C] 0.2046[/C][C] 0.1023[/C][/ROW]
[ROW][C]32[/C][C] 0.8643[/C][C] 0.2713[/C][C] 0.1356[/C][/ROW]
[ROW][C]33[/C][C] 0.8673[/C][C] 0.2653[/C][C] 0.1327[/C][/ROW]
[ROW][C]34[/C][C] 0.853[/C][C] 0.2939[/C][C] 0.147[/C][/ROW]
[ROW][C]35[/C][C] 0.8119[/C][C] 0.3761[/C][C] 0.1881[/C][/ROW]
[ROW][C]36[/C][C] 0.7858[/C][C] 0.4284[/C][C] 0.2142[/C][/ROW]
[ROW][C]37[/C][C] 0.7952[/C][C] 0.4096[/C][C] 0.2048[/C][/ROW]
[ROW][C]38[/C][C] 0.7691[/C][C] 0.4619[/C][C] 0.2309[/C][/ROW]
[ROW][C]39[/C][C] 0.7665[/C][C] 0.467[/C][C] 0.2335[/C][/ROW]
[ROW][C]40[/C][C] 0.756[/C][C] 0.4879[/C][C] 0.244[/C][/ROW]
[ROW][C]41[/C][C] 0.8696[/C][C] 0.2607[/C][C] 0.1304[/C][/ROW]
[ROW][C]42[/C][C] 0.9114[/C][C] 0.1773[/C][C] 0.08864[/C][/ROW]
[ROW][C]43[/C][C] 0.9289[/C][C] 0.1421[/C][C] 0.07106[/C][/ROW]
[ROW][C]44[/C][C] 0.9492[/C][C] 0.1015[/C][C] 0.05076[/C][/ROW]
[ROW][C]45[/C][C] 0.9391[/C][C] 0.1218[/C][C] 0.06092[/C][/ROW]
[ROW][C]46[/C][C] 0.9236[/C][C] 0.1529[/C][C] 0.07645[/C][/ROW]
[ROW][C]47[/C][C] 0.8999[/C][C] 0.2002[/C][C] 0.1001[/C][/ROW]
[ROW][C]48[/C][C] 0.8838[/C][C] 0.2324[/C][C] 0.1162[/C][/ROW]
[ROW][C]49[/C][C] 0.9077[/C][C] 0.1845[/C][C] 0.09227[/C][/ROW]
[ROW][C]50[/C][C] 0.9904[/C][C] 0.01922[/C][C] 0.009612[/C][/ROW]
[ROW][C]51[/C][C] 0.9908[/C][C] 0.01848[/C][C] 0.009241[/C][/ROW]
[ROW][C]52[/C][C] 0.9832[/C][C] 0.03363[/C][C] 0.01681[/C][/ROW]
[ROW][C]53[/C][C] 0.9725[/C][C] 0.05502[/C][C] 0.02751[/C][/ROW]
[ROW][C]54[/C][C] 0.9609[/C][C] 0.07812[/C][C] 0.03906[/C][/ROW]
[ROW][C]55[/C][C] 0.938[/C][C] 0.1239[/C][C] 0.06196[/C][/ROW]
[ROW][C]56[/C][C] 0.9326[/C][C] 0.1348[/C][C] 0.0674[/C][/ROW]
[ROW][C]57[/C][C] 0.8909[/C][C] 0.2182[/C][C] 0.1091[/C][/ROW]
[ROW][C]58[/C][C] 0.838[/C][C] 0.3241[/C][C] 0.162[/C][/ROW]
[ROW][C]59[/C][C] 0.7759[/C][C] 0.4483[/C][C] 0.2241[/C][/ROW]
[ROW][C]60[/C][C] 0.84[/C][C] 0.3199[/C][C] 0.16[/C][/ROW]
[ROW][C]61[/C][C] 0.9624[/C][C] 0.07513[/C][C] 0.03757[/C][/ROW]
[ROW][C]62[/C][C] 0.9725[/C][C] 0.05504[/C][C] 0.02752[/C][/ROW]
[ROW][C]63[/C][C] 0.9284[/C][C] 0.1432[/C][C] 0.07158[/C][/ROW]
[ROW][C]64[/C][C] 0.8964[/C][C] 0.2072[/C][C] 0.1036[/C][/ROW]
[/TABLE]
Source: https://freestatistics.org/blog/index.php?pk=285607&T=5

Globally Unique Identifier (entire table): ba.freestatistics.org/blog/index.php?pk=285607&T=5

As an alternative you can also use a QR Code:  

The GUIDs for individual cells are displayed in the table below:

Goldfeld-Quandt test for Heteroskedasticity
p-valuesAlternative Hypothesis
breakpoint indexgreater2-sidedless
11 0.6783 0.6435 0.3217
12 0.6628 0.6744 0.3372
13 0.5418 0.9163 0.4582
14 0.7329 0.5342 0.2671
15 0.6866 0.6268 0.3134
16 0.6495 0.701 0.3505
17 0.6878 0.6244 0.3122
18 0.8427 0.3146 0.1573
19 0.8968 0.2064 0.1032
20 0.9152 0.1696 0.0848
21 0.933 0.134 0.06701
22 0.9547 0.09069 0.04534
23 0.9695 0.0609 0.03045
24 0.9681 0.06387 0.03193
25 0.9687 0.0626 0.0313
26 0.9796 0.04082 0.02041
27 0.9693 0.06131 0.03065
28 0.9589 0.0821 0.04105
29 0.94 0.1201 0.06005
30 0.9254 0.1492 0.0746
31 0.8977 0.2046 0.1023
32 0.8643 0.2713 0.1356
33 0.8673 0.2653 0.1327
34 0.853 0.2939 0.147
35 0.8119 0.3761 0.1881
36 0.7858 0.4284 0.2142
37 0.7952 0.4096 0.2048
38 0.7691 0.4619 0.2309
39 0.7665 0.467 0.2335
40 0.756 0.4879 0.244
41 0.8696 0.2607 0.1304
42 0.9114 0.1773 0.08864
43 0.9289 0.1421 0.07106
44 0.9492 0.1015 0.05076
45 0.9391 0.1218 0.06092
46 0.9236 0.1529 0.07645
47 0.8999 0.2002 0.1001
48 0.8838 0.2324 0.1162
49 0.9077 0.1845 0.09227
50 0.9904 0.01922 0.009612
51 0.9908 0.01848 0.009241
52 0.9832 0.03363 0.01681
53 0.9725 0.05502 0.02751
54 0.9609 0.07812 0.03906
55 0.938 0.1239 0.06196
56 0.9326 0.1348 0.0674
57 0.8909 0.2182 0.1091
58 0.838 0.3241 0.162
59 0.7759 0.4483 0.2241
60 0.84 0.3199 0.16
61 0.9624 0.07513 0.03757
62 0.9725 0.05504 0.02752
63 0.9284 0.1432 0.07158
64 0.8964 0.2072 0.1036


Meta Analysis of Goldfeld-Quandt test for Heteroskedasticity
Description# significant tests% significant testsOK/NOK
1% type I error level0 0OK
5% type I error level40.0740741NOK
10% type I error level140.259259NOK

\begin{tabular}{lllllllll}
\hline
Meta Analysis of Goldfeld-Quandt test for Heteroskedasticity \tabularnewline
Description & # significant tests & % significant tests & OK/NOK \tabularnewline
1% type I error level & 0 &  0 & OK \tabularnewline
5% type I error level & 4 & 0.0740741 & NOK \tabularnewline
10% type I error level & 14 & 0.259259 & NOK \tabularnewline
\hline
\end{tabular}
%Source: https://freestatistics.org/blog/index.php?pk=285607&T=6

[TABLE]
[ROW][C]Meta Analysis of Goldfeld-Quandt test for Heteroskedasticity[/C][/ROW]
[ROW][C]Description[/C][C]# significant tests[/C][C]% significant tests[/C][C]OK/NOK[/C][/ROW]
[ROW][C]1% type I error level[/C][C]0[/C][C] 0[/C][C]OK[/C][/ROW]
[ROW][C]5% type I error level[/C][C]4[/C][C]0.0740741[/C][C]NOK[/C][/ROW]
[ROW][C]10% type I error level[/C][C]14[/C][C]0.259259[/C][C]NOK[/C][/ROW]
[/TABLE]
Source: https://freestatistics.org/blog/index.php?pk=285607&T=6

Globally Unique Identifier (entire table): ba.freestatistics.org/blog/index.php?pk=285607&T=6

As an alternative you can also use a QR Code:  

The GUIDs for individual cells are displayed in the table below:

Meta Analysis of Goldfeld-Quandt test for Heteroskedasticity
Description# significant tests% significant testsOK/NOK
1% type I error level0 0OK
5% type I error level40.0740741NOK
10% type I error level140.259259NOK


Parameters (Session):
Parameters (R input):
par1 = 1 ; par2 = Do not include Seasonal Dummies ; par3 = No Linear Trend ; par4 = 5 ; par5 = 0 ;
R code (references can be found in the software module):
library(lattice)
library(lmtest)
n25 <- 25 #minimum number of obs. for Goldfeld-Quandt test
mywarning <- ''
par1 <- as.numeric(par1)
if(is.na(par1)) {
par1 <- 1
mywarning = 'Warning: you did not specify the column number of the endogenous series! The first column was selected by default.'
}
if (par4=='') par4 <- 0
par4 <- as.numeric(par4)
if (par5=='') par5 <- 0
par5 <- as.numeric(par5)
x <- na.omit(t(y))
k <- length(x[1,])
n <- length(x[,1])
x1 <- cbind(x[,par1], x[,1:k!=par1])
mycolnames <- c(colnames(x)[par1], colnames(x)[1:k!=par1])
colnames(x1) <- mycolnames #colnames(x)[par1]
x <- x1
if (par3 == 'First Differences'){
(n <- n -1)
x2 <- array(0, dim=c(n,k), dimnames=list(1:n, paste('(1-B)',colnames(x),sep='')))
for (i in 1:n) {
for (j in 1:k) {
x2[i,j] <- x[i+1,j] - x[i,j]
}
}
x <- x2
}
if (par3 == 'Seasonal Differences (s=12)'){
(n <- n - 12)
x2 <- array(0, dim=c(n,k), dimnames=list(1:n, paste('(1-B12)',colnames(x),sep='')))
for (i in 1:n) {
for (j in 1:k) {
x2[i,j] <- x[i+12,j] - x[i,j]
}
}
x <- x2
}
if (par3 == 'First and Seasonal Differences (s=12)'){
(n <- n -1)
x2 <- array(0, dim=c(n,k), dimnames=list(1:n, paste('(1-B)',colnames(x),sep='')))
for (i in 1:n) {
for (j in 1:k) {
x2[i,j] <- x[i+1,j] - x[i,j]
}
}
x <- x2
(n <- n - 12)
x2 <- array(0, dim=c(n,k), dimnames=list(1:n, paste('(1-B12)',colnames(x),sep='')))
for (i in 1:n) {
for (j in 1:k) {
x2[i,j] <- x[i+12,j] - x[i,j]
}
}
x <- x2
}
if(par4 > 0) {
x2 <- array(0, dim=c(n-par4,par4), dimnames=list(1:(n-par4), paste(colnames(x)[par1],'(t-',1:par4,')',sep='')))
for (i in 1:(n-par4)) {
for (j in 1:par4) {
x2[i,j] <- x[i+par4-j,par1]
}
}
x <- cbind(x[(par4+1):n,], x2)
n <- n - par4
}
if(par5 > 0) {
x2 <- array(0, dim=c(n-par5*12,par5), dimnames=list(1:(n-par5*12), paste(colnames(x)[par1],'(t-',1:par5,'s)',sep='')))
for (i in 1:(n-par5*12)) {
for (j in 1:par5) {
x2[i,j] <- x[i+par5*12-j*12,par1]
}
}
x <- cbind(x[(par5*12+1):n,], x2)
n <- n - par5*12
}
if (par2 == 'Include Monthly Dummies'){
x2 <- array(0, dim=c(n,11), dimnames=list(1:n, paste('M', seq(1:11), sep ='')))
for (i in 1:11){
x2[seq(i,n,12),i] <- 1
}
x <- cbind(x, x2)
}
if (par2 == 'Include Quarterly Dummies'){
x2 <- array(0, dim=c(n,3), dimnames=list(1:n, paste('Q', seq(1:3), sep ='')))
for (i in 1:3){
x2[seq(i,n,4),i] <- 1
}
x <- cbind(x, x2)
}
(k <- length(x[n,]))
if (par3 == 'Linear Trend'){
x <- cbind(x, c(1:n))
colnames(x)[k+1] <- 't'
}
x
(k <- length(x[n,]))
head(x)
df <- as.data.frame(x)
(mylm <- lm(df))
(mysum <- summary(mylm))
if (n > n25) {
kp3 <- k + 3
nmkm3 <- n - k - 3
gqarr <- array(NA, dim=c(nmkm3-kp3+1,3))
numgqtests <- 0
numsignificant1 <- 0
numsignificant5 <- 0
numsignificant10 <- 0
for (mypoint in kp3:nmkm3) {
j <- 0
numgqtests <- numgqtests + 1
for (myalt in c('greater', 'two.sided', 'less')) {
j <- j + 1
gqarr[mypoint-kp3+1,j] <- gqtest(mylm, point=mypoint, alternative=myalt)$p.value
}
if (gqarr[mypoint-kp3+1,2] < 0.01) numsignificant1 <- numsignificant1 + 1
if (gqarr[mypoint-kp3+1,2] < 0.05) numsignificant5 <- numsignificant5 + 1
if (gqarr[mypoint-kp3+1,2] < 0.10) numsignificant10 <- numsignificant10 + 1
}
gqarr
}
bitmap(file='test0.png')
plot(x[,1], type='l', main='Actuals and Interpolation', ylab='value of Actuals and Interpolation (dots)', xlab='time or index')
points(x[,1]-mysum$resid)
grid()
dev.off()
bitmap(file='test1.png')
plot(mysum$resid, type='b', pch=19, main='Residuals', ylab='value of Residuals', xlab='time or index')
grid()
dev.off()
bitmap(file='test2.png')
hist(mysum$resid, main='Residual Histogram', xlab='values of Residuals')
grid()
dev.off()
bitmap(file='test3.png')
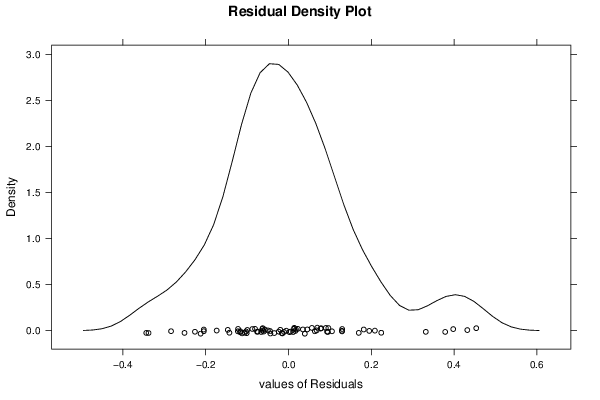
densityplot(~mysum$resid,col='black',main='Residual Density Plot', xlab='values of Residuals')
dev.off()
bitmap(file='test4.png')
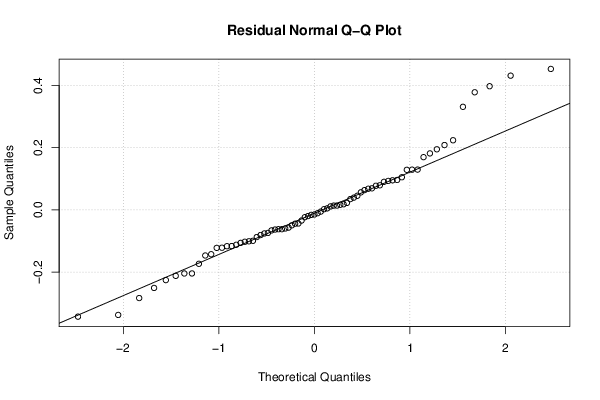
qqnorm(mysum$resid, main='Residual Normal Q-Q Plot')
qqline(mysum$resid)
grid()
dev.off()
(myerror <- as.ts(mysum$resid))
bitmap(file='test5.png')
dum <- cbind(lag(myerror,k=1),myerror)
dum
dum1 <- dum[2:length(myerror),]
dum1
z <- as.data.frame(dum1)
z
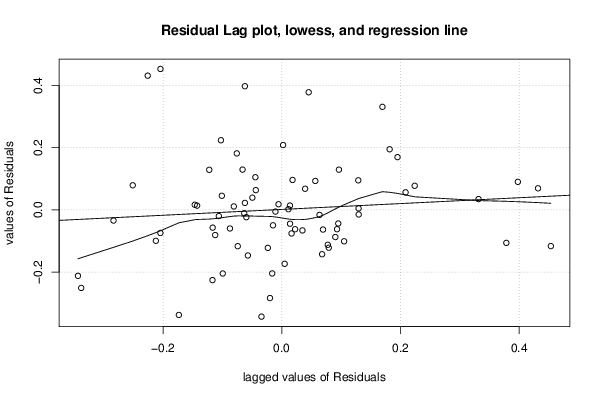
plot(z,main=paste('Residual Lag plot, lowess, and regression line'), ylab='values of Residuals', xlab='lagged values of Residuals')
lines(lowess(z))
abline(lm(z))
grid()
dev.off()
bitmap(file='test6.png')
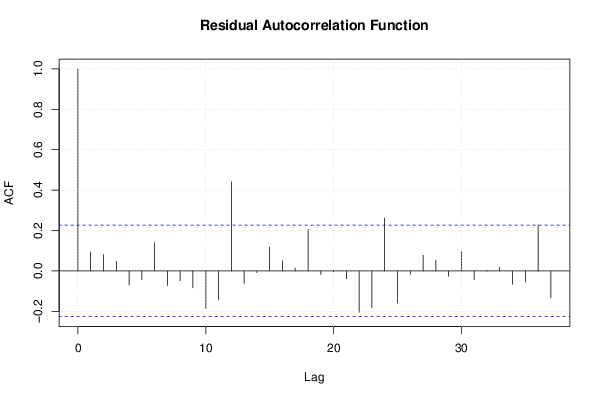
acf(mysum$resid, lag.max=length(mysum$resid)/2, main='Residual Autocorrelation Function')
grid()
dev.off()
bitmap(file='test7.png')
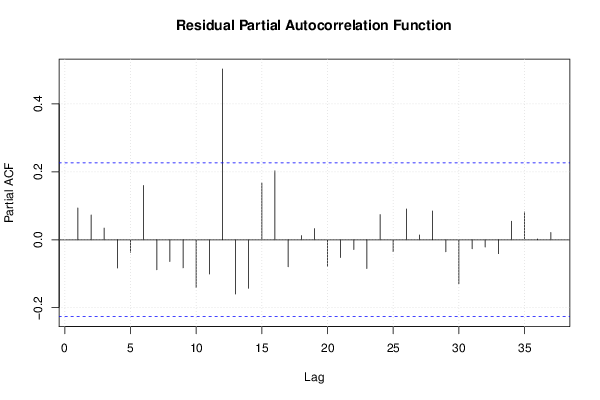
pacf(mysum$resid, lag.max=length(mysum$resid)/2, main='Residual Partial Autocorrelation Function')
grid()
dev.off()
bitmap(file='test8.png')
opar <- par(mfrow = c(2,2), oma = c(0, 0, 1.1, 0))
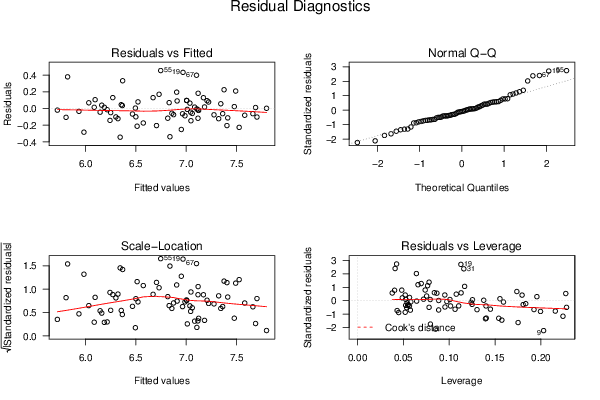
plot(mylm, las = 1, sub='Residual Diagnostics')
par(opar)
dev.off()
if (n > n25) {
bitmap(file='test9.png')
plot(kp3:nmkm3,gqarr[,2], main='Goldfeld-Quandt test',ylab='2-sided p-value',xlab='breakpoint')
grid()
dev.off()
}
load(file='createtable')
a<-table.start()
a<-table.row.start(a)
a<-table.element(a, 'Multiple Linear Regression - Estimated Regression Equation', 1, TRUE)
a<-table.row.end(a)
myeq <- colnames(x)[1]
myeq <- paste(myeq, '[t] = ', sep='')
for (i in 1:k){
if (mysum$coefficients[i,1] > 0) myeq <- paste(myeq, '+', '')
myeq <- paste(myeq, signif(mysum$coefficients[i,1],6), sep=' ')
if (rownames(mysum$coefficients)[i] != '(Intercept)') {
myeq <- paste(myeq, rownames(mysum$coefficients)[i], sep='')
if (rownames(mysum$coefficients)[i] != 't') myeq <- paste(myeq, '[t]', sep='')
}
}
myeq <- paste(myeq, ' + e[t]')
a<-table.row.start(a)
a<-table.element(a, myeq)
a<-table.row.end(a)
a<-table.row.start(a)
a<-table.element(a, mywarning)
a<-table.row.end(a)
a<-table.end(a)
table.save(a,file='mytable1.tab')
a<-table.start()
a<-table.row.start(a)
a<-table.element(a,hyperlink('ols1.htm','Multiple Linear Regression - Ordinary Least Squares',''), 6, TRUE)
a<-table.row.end(a)
a<-table.row.start(a)
a<-table.element(a,'Variable',header=TRUE)
a<-table.element(a,'Parameter',header=TRUE)
a<-table.element(a,'S.D.',header=TRUE)
a<-table.element(a,'T-STAT
H0: parameter = 0',header=TRUE)
a<-table.element(a,'2-tail p-value',header=TRUE)
a<-table.element(a,'1-tail p-value',header=TRUE)
a<-table.row.end(a)
for (i in 1:k){
a<-table.row.start(a)
a<-table.element(a,rownames(mysum$coefficients)[i],header=TRUE)
a<-table.element(a,formatC(signif(mysum$coefficients[i,1],5),format='g',flag='+'))
a<-table.element(a,formatC(signif(mysum$coefficients[i,2],5),format='g',flag=' '))
a<-table.element(a,formatC(signif(mysum$coefficients[i,3],4),format='e',flag='+'))
a<-table.element(a,formatC(signif(mysum$coefficients[i,4],4),format='g',flag=' '))
a<-table.element(a,formatC(signif(mysum$coefficients[i,4]/2,4),format='g',flag=' '))
a<-table.row.end(a)
}
a<-table.end(a)
table.save(a,file='mytable2.tab')
a<-table.start()
a<-table.row.start(a)
a<-table.element(a, 'Multiple Linear Regression - Regression Statistics', 2, TRUE)
a<-table.row.end(a)
a<-table.row.start(a)
a<-table.element(a, 'Multiple R',1,TRUE)
a<-table.element(a,formatC(signif(sqrt(mysum$r.squared),6),format='g',flag=' '))
a<-table.row.end(a)
a<-table.row.start(a)
a<-table.element(a, 'R-squared',1,TRUE)
a<-table.element(a,formatC(signif(mysum$r.squared,6),format='g',flag=' '))
a<-table.row.end(a)
a<-table.row.start(a)
a<-table.element(a, 'Adjusted R-squared',1,TRUE)
a<-table.element(a,formatC(signif(mysum$adj.r.squared,6),format='g',flag=' '))
a<-table.row.end(a)
a<-table.row.start(a)
a<-table.element(a, 'F-TEST (value)',1,TRUE)
a<-table.element(a,formatC(signif(mysum$fstatistic[1],6),format='g',flag=' '))
a<-table.row.end(a)
a<-table.row.start(a)
a<-table.element(a, 'F-TEST (DF numerator)',1,TRUE)
a<-table.element(a, signif(mysum$fstatistic[2],6))
a<-table.row.end(a)
a<-table.row.start(a)
a<-table.element(a, 'F-TEST (DF denominator)',1,TRUE)
a<-table.element(a, signif(mysum$fstatistic[3],6))
a<-table.row.end(a)
a<-table.row.start(a)
a<-table.element(a, 'p-value',1,TRUE)
a<-table.element(a,formatC(signif(1-pf(mysum$fstatistic[1],mysum$fstatistic[2],mysum$fstatistic[3]),6),format='g',flag=' '))
a<-table.row.end(a)
a<-table.row.start(a)
a<-table.element(a, 'Multiple Linear Regression - Residual Statistics', 2, TRUE)
a<-table.row.end(a)
a<-table.row.start(a)
a<-table.element(a, 'Residual Standard Deviation',1,TRUE)
a<-table.element(a,formatC(signif(mysum$sigma,6),format='g',flag=' '))
a<-table.row.end(a)
a<-table.row.start(a)
a<-table.element(a, 'Sum Squared Residuals',1,TRUE)
a<-table.element(a,formatC(signif(sum(myerror*myerror),6),format='g',flag=' '))
a<-table.row.end(a)
a<-table.end(a)
table.save(a,file='mytable3.tab')
if(n < 200) {
a<-table.start()
a<-table.row.start(a)
a<-table.element(a, 'Multiple Linear Regression - Actuals, Interpolation, and Residuals', 4, TRUE)
a<-table.row.end(a)
a<-table.row.start(a)
a<-table.element(a, 'Time or Index', 1, TRUE)
a<-table.element(a, 'Actuals', 1, TRUE)
a<-table.element(a, 'Interpolation
Forecast', 1, TRUE)
a<-table.element(a, 'Residuals
Prediction Error', 1, TRUE)
a<-table.row.end(a)
for (i in 1:n) {
a<-table.row.start(a)
a<-table.element(a,i, 1, TRUE)
a<-table.element(a,formatC(signif(x[i],6),format='g',flag=' '))
a<-table.element(a,formatC(signif(x[i]-mysum$resid[i],6),format='g',flag=' '))
a<-table.element(a,formatC(signif(mysum$resid[i],6),format='g',flag=' '))
a<-table.row.end(a)
}
a<-table.end(a)
table.save(a,file='mytable4.tab')
if (n > n25) {
a<-table.start()
a<-table.row.start(a)
a<-table.element(a,'Goldfeld-Quandt test for Heteroskedasticity',4,TRUE)
a<-table.row.end(a)
a<-table.row.start(a)
a<-table.element(a,'p-values',header=TRUE)
a<-table.element(a,'Alternative Hypothesis',3,header=TRUE)
a<-table.row.end(a)
a<-table.row.start(a)
a<-table.element(a,'breakpoint index',header=TRUE)
a<-table.element(a,'greater',header=TRUE)
a<-table.element(a,'2-sided',header=TRUE)
a<-table.element(a,'less',header=TRUE)
a<-table.row.end(a)
for (mypoint in kp3:nmkm3) {
a<-table.row.start(a)
a<-table.element(a,mypoint,header=TRUE)
a<-table.element(a,formatC(signif(gqarr[mypoint-kp3+1,1],6),format='g',flag=' '))
a<-table.element(a,formatC(signif(gqarr[mypoint-kp3+1,2],6),format='g',flag=' '))
a<-table.element(a,formatC(signif(gqarr[mypoint-kp3+1,3],6),format='g',flag=' '))
a<-table.row.end(a)
}
a<-table.end(a)
table.save(a,file='mytable5.tab')
a<-table.start()
a<-table.row.start(a)
a<-table.element(a,'Meta Analysis of Goldfeld-Quandt test for Heteroskedasticity',4,TRUE)
a<-table.row.end(a)
a<-table.row.start(a)
a<-table.element(a,'Description',header=TRUE)
a<-table.element(a,'# significant tests',header=TRUE)
a<-table.element(a,'% significant tests',header=TRUE)
a<-table.element(a,'OK/NOK',header=TRUE)
a<-table.row.end(a)
a<-table.row.start(a)
a<-table.element(a,'1% type I error level',header=TRUE)
a<-table.element(a,signif(numsignificant1,6))
a<-table.element(a,formatC(signif(numsignificant1/numgqtests,6),format='g',flag=' '))
if (numsignificant1/numgqtests < 0.01) dum <- 'OK' else dum <- 'NOK'
a<-table.element(a,dum)
a<-table.row.end(a)
a<-table.row.start(a)
a<-table.element(a,'5% type I error level',header=TRUE)
a<-table.element(a,signif(numsignificant5,6))
a<-table.element(a,signif(numsignificant5/numgqtests,6))
if (numsignificant5/numgqtests < 0.05) dum <- 'OK' else dum <- 'NOK'
a<-table.element(a,dum)
a<-table.row.end(a)
a<-table.row.start(a)
a<-table.element(a,'10% type I error level',header=TRUE)
a<-table.element(a,signif(numsignificant10,6))
a<-table.element(a,signif(numsignificant10/numgqtests,6))
if (numsignificant10/numgqtests < 0.1) dum <- 'OK' else dum <- 'NOK'
a<-table.element(a,dum)
a<-table.row.end(a)
a<-table.end(a)
table.save(a,file='mytable6.tab')
}
}