Free Statistics

of Irreproducible Research!

Author's title

Author*Unverified author*
R Software Modulerwasp_smp.wasp
Title produced by softwareStandard Deviation-Mean Plot
Date of computationMon, 10 Aug 2015 12:42:51 +0100
Cite this page as followsStatistical Computations at FreeStatistics.org, Office for Research Development and Education, URL https://freestatistics.org/blog/index.php?v=date/2015/Aug/10/t1439206992cgrxi0vreo8qifd.htm/, Retrieved Sun, 19 May 2024 09:23:12 +0000
Statistical Computations at FreeStatistics.org, Office for Research Development and Education, URL https://freestatistics.org/blog/index.php?pk=279982, Retrieved Sun, 19 May 2024 09:23:12 +0000
QR Codes:

Original text written by user:
IsPrivate?No (this computation is public)
User-defined keywords
Estimated Impact131
Family? (F = Feedback message, R = changed R code, M = changed R Module, P = changed Parameters, D = changed Data)
-     [Histogram] [omzetontwikkeling...] [2014-09-24 09:10:11] [3d50c3f1d1505d45371c80c331b9aa00]
- R  D  [Histogram] [] [2015-07-23 12:50:11] [74be16979710d4c4e7c6647856088456]
- RMPD    [Harrell-Davis Quantiles] [] [2015-08-10 08:16:05] [74be16979710d4c4e7c6647856088456]
- RMP       [Mean versus Median] [] [2015-08-10 09:14:26] [74be16979710d4c4e7c6647856088456]
- RMP         [Mean Plot] [] [2015-08-10 09:32:31] [74be16979710d4c4e7c6647856088456]
- RMP           [(Partial) Autocorrelation Function] [] [2015-08-10 11:22:46] [74be16979710d4c4e7c6647856088456]
- RM                [Standard Deviation-Mean Plot] [] [2015-08-10 11:42:51] [d41d8cd98f00b204e9800998ecf8427e] [Current]
Feedback Forum

Post a new message
Dataseries X:
1053000
1014000
1072500
858000
1111500
1092000
1170000
1209000
1345500
1170000
1111500
1384500
1170000
877500
1033500
780000
1092000
897000
1189500
1072500
1131000
1267500
1248000
1482000
1072500
897000
994500
721500
1033500
799500
1131000
1072500
955500
1365000
1228500
1404000
1053000
975000
877500
721500
955500
858000
1170000
1131000
975000
1306500
1209000
1560000
1248000
760500
760500
760500
897000
897000
1209000
1111500
994500
1248000
1150500
1657500
1306500
760500
799500
663000
916500
1053000
1326000
1306500
1053000
1228500
1092000
1560000
1189500
955500
858000
643500
955500
1150500
1345500
1267500
936000
1345500
1053000
1618500
1345500
975000
897000
604500
955500
916500
1384500
1384500
1053000
1365000
1014000
1579500
1345500
994500
760500
526500
1033500
994500
1306500
1501500
1111500
1248000
936000
1618500


Summary of computational transaction
Raw Inputview raw input (R code)
Raw Outputview raw output of R engine
Computing time1 seconds
R Server'Sir Maurice George Kendall' @ kendall.wessa.net

\begin{tabular}{lllllllll}
\hline
Summary of computational transaction \tabularnewline
Raw Input & view raw input (R code)  \tabularnewline
Raw Output & view raw output of R engine  \tabularnewline
Computing time & 1 seconds \tabularnewline
R Server & 'Sir Maurice George Kendall' @ kendall.wessa.net \tabularnewline
\hline
\end{tabular}
%Source: https://freestatistics.org/blog/index.php?pk=279982&T=0

[TABLE]
[ROW][C]Summary of computational transaction[/C][/ROW]
[ROW][C]Raw Input[/C][C]view raw input (R code) [/C][/ROW]
[ROW][C]Raw Output[/C][C]view raw output of R engine [/C][/ROW]
[ROW][C]Computing time[/C][C]1 seconds[/C][/ROW]
[ROW][C]R Server[/C][C]'Sir Maurice George Kendall' @ kendall.wessa.net[/C][/ROW]
[/TABLE]
Source: https://freestatistics.org/blog/index.php?pk=279982&T=0

Globally Unique Identifier (entire table): ba.freestatistics.org/blog/index.php?pk=279982&T=0

As an alternative you can also use a QR Code:  

The GUIDs for individual cells are displayed in the table below:

Summary of computational transaction
Raw Inputview raw input (R code)
Raw Outputview raw output of R engine
Computing time1 seconds
R Server'Sir Maurice George Kendall' @ kendall.wessa.net


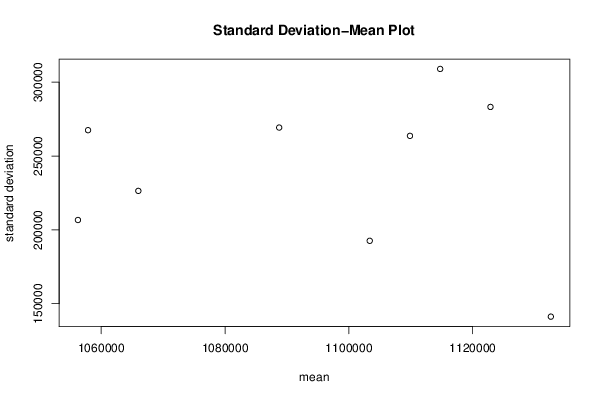
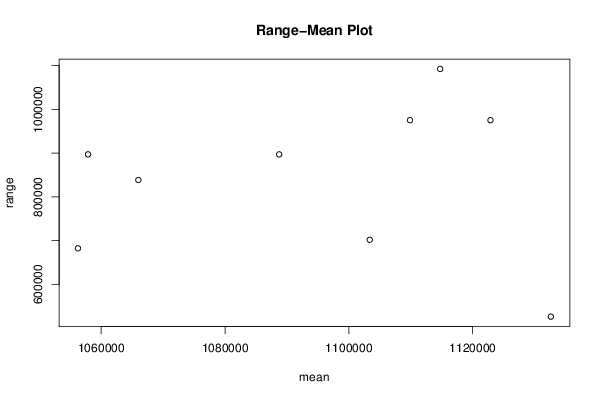
Standard Deviation-Mean Plot
SectionMeanStandard DeviationRange
11132625141219.546194118526500
21103375192584.470840956702000
31056250206675.4702426682500
41066000226391.455026666838500
51057875267515.940476621897000
61088750269281.493473415897000
71109875263654.571275647975000
81122875283248.776375436975000
91114750308975.3961961141092000

\begin{tabular}{lllllllll}
\hline
Standard Deviation-Mean Plot \tabularnewline
Section & Mean & Standard Deviation & Range \tabularnewline
1 & 1132625 & 141219.546194118 & 526500 \tabularnewline
2 & 1103375 & 192584.470840956 & 702000 \tabularnewline
3 & 1056250 & 206675.4702426 & 682500 \tabularnewline
4 & 1066000 & 226391.455026666 & 838500 \tabularnewline
5 & 1057875 & 267515.940476621 & 897000 \tabularnewline
6 & 1088750 & 269281.493473415 & 897000 \tabularnewline
7 & 1109875 & 263654.571275647 & 975000 \tabularnewline
8 & 1122875 & 283248.776375436 & 975000 \tabularnewline
9 & 1114750 & 308975.396196114 & 1092000 \tabularnewline
\hline
\end{tabular}
%Source: https://freestatistics.org/blog/index.php?pk=279982&T=1

[TABLE]
[ROW][C]Standard Deviation-Mean Plot[/C][/ROW]
[ROW][C]Section[/C][C]Mean[/C][C]Standard Deviation[/C][C]Range[/C][/ROW]
[ROW][C]1[/C][C]1132625[/C][C]141219.546194118[/C][C]526500[/C][/ROW]
[ROW][C]2[/C][C]1103375[/C][C]192584.470840956[/C][C]702000[/C][/ROW]
[ROW][C]3[/C][C]1056250[/C][C]206675.4702426[/C][C]682500[/C][/ROW]
[ROW][C]4[/C][C]1066000[/C][C]226391.455026666[/C][C]838500[/C][/ROW]
[ROW][C]5[/C][C]1057875[/C][C]267515.940476621[/C][C]897000[/C][/ROW]
[ROW][C]6[/C][C]1088750[/C][C]269281.493473415[/C][C]897000[/C][/ROW]
[ROW][C]7[/C][C]1109875[/C][C]263654.571275647[/C][C]975000[/C][/ROW]
[ROW][C]8[/C][C]1122875[/C][C]283248.776375436[/C][C]975000[/C][/ROW]
[ROW][C]9[/C][C]1114750[/C][C]308975.396196114[/C][C]1092000[/C][/ROW]
[/TABLE]
Source: https://freestatistics.org/blog/index.php?pk=279982&T=1

Globally Unique Identifier (entire table): ba.freestatistics.org/blog/index.php?pk=279982&T=1

As an alternative you can also use a QR Code:  

The GUIDs for individual cells are displayed in the table below:

Standard Deviation-Mean Plot
SectionMeanStandard DeviationRange
11132625141219.546194118526500
21103375192584.470840956702000
31056250206675.4702426682500
41066000226391.455026666838500
51057875267515.940476621897000
61088750269281.493473415897000
71109875263654.571275647975000
81122875283248.776375436975000
91114750308975.3961961141092000


Regression: S.E.(k) = alpha + beta * Mean(k)
alpha357574.248099363
beta-0.107448317059866
S.D.0.68875700161761
T-STAT-0.156003230177716
p-value0.88043412050898

\begin{tabular}{lllllllll}
\hline
Regression: S.E.(k) = alpha + beta * Mean(k) \tabularnewline
alpha & 357574.248099363 \tabularnewline
beta & -0.107448317059866 \tabularnewline
S.D. & 0.68875700161761 \tabularnewline
T-STAT & -0.156003230177716 \tabularnewline
p-value & 0.88043412050898 \tabularnewline
\hline
\end{tabular}
%Source: https://freestatistics.org/blog/index.php?pk=279982&T=2

[TABLE]
[ROW][C]Regression: S.E.(k) = alpha + beta * Mean(k)[/C][/ROW]
[ROW][C]alpha[/C][C]357574.248099363[/C][/ROW]
[ROW][C]beta[/C][C]-0.107448317059866[/C][/ROW]
[ROW][C]S.D.[/C][C]0.68875700161761[/C][/ROW]
[ROW][C]T-STAT[/C][C]-0.156003230177716[/C][/ROW]
[ROW][C]p-value[/C][C]0.88043412050898[/C][/ROW]
[/TABLE]
Source: https://freestatistics.org/blog/index.php?pk=279982&T=2

Globally Unique Identifier (entire table): ba.freestatistics.org/blog/index.php?pk=279982&T=2

As an alternative you can also use a QR Code:  

The GUIDs for individual cells are displayed in the table below:

Regression: S.E.(k) = alpha + beta * Mean(k)
alpha357574.248099363
beta-0.107448317059866
S.D.0.68875700161761
T-STAT-0.156003230177716
p-value0.88043412050898


Regression: ln S.E.(k) = alpha + beta * ln Mean(k)
alpha30.3901311845676
beta-1.29633550728099
S.D.3.45582772786283
T-STAT-0.375115778147504
p-value0.718681736243662
Lambda2.29633550728099

\begin{tabular}{lllllllll}
\hline
Regression: ln S.E.(k) = alpha + beta * ln Mean(k) \tabularnewline
alpha & 30.3901311845676 \tabularnewline
beta & -1.29633550728099 \tabularnewline
S.D. & 3.45582772786283 \tabularnewline
T-STAT & -0.375115778147504 \tabularnewline
p-value & 0.718681736243662 \tabularnewline
Lambda & 2.29633550728099 \tabularnewline
\hline
\end{tabular}
%Source: https://freestatistics.org/blog/index.php?pk=279982&T=3

[TABLE]
[ROW][C]Regression: ln S.E.(k) = alpha + beta * ln Mean(k)[/C][/ROW]
[ROW][C]alpha[/C][C]30.3901311845676[/C][/ROW]
[ROW][C]beta[/C][C]-1.29633550728099[/C][/ROW]
[ROW][C]S.D.[/C][C]3.45582772786283[/C][/ROW]
[ROW][C]T-STAT[/C][C]-0.375115778147504[/C][/ROW]
[ROW][C]p-value[/C][C]0.718681736243662[/C][/ROW]
[ROW][C]Lambda[/C][C]2.29633550728099[/C][/ROW]
[/TABLE]
Source: https://freestatistics.org/blog/index.php?pk=279982&T=3

Globally Unique Identifier (entire table): ba.freestatistics.org/blog/index.php?pk=279982&T=3

As an alternative you can also use a QR Code:  

The GUIDs for individual cells are displayed in the table below:

Regression: ln S.E.(k) = alpha + beta * ln Mean(k)
alpha30.3901311845676
beta-1.29633550728099
S.D.3.45582772786283
T-STAT-0.375115778147504
p-value0.718681736243662
Lambda2.29633550728099


Parameters (Session):
par1 = 60 ; par2 = 1 ; par3 = 0 ; par4 = 0 ; par5 = 12 ; par6 = White Noise ; par7 = 0.95 ;
Parameters (R input):
par1 = 12 ;
R code (references can be found in the software module):
par1 <- as.numeric(par1)
(n <- length(x))
(np <- floor(n / par1))
arr <- array(NA,dim=c(par1,np))
j <- 0
k <- 1
for (i in 1:(np*par1))
{
j = j + 1
arr[j,k] <- x[i]
if (j == par1) {
j = 0
k=k+1
}
}
arr
arr.mean <- array(NA,dim=np)
arr.sd <- array(NA,dim=np)
arr.range <- array(NA,dim=np)
for (j in 1:np)
{
arr.mean[j] <- mean(arr[,j],na.rm=TRUE)
arr.sd[j] <- sd(arr[,j],na.rm=TRUE)
arr.range[j] <- max(arr[,j],na.rm=TRUE) - min(arr[,j],na.rm=TRUE)
}
arr.mean
arr.sd
arr.range
(lm1 <- lm(arr.sd~arr.mean))
(lnlm1 <- lm(log(arr.sd)~log(arr.mean)))
(lm2 <- lm(arr.range~arr.mean))
bitmap(file='test1.png')
plot(arr.mean,arr.sd,main='Standard Deviation-Mean Plot',xlab='mean',ylab='standard deviation')
dev.off()
bitmap(file='test2.png')
plot(arr.mean,arr.range,main='Range-Mean Plot',xlab='mean',ylab='range')
dev.off()
load(file='createtable')
a<-table.start()
a<-table.row.start(a)
a<-table.element(a,'Standard Deviation-Mean Plot',4,TRUE)
a<-table.row.end(a)
a<-table.row.start(a)
a<-table.element(a,'Section',header=TRUE)
a<-table.element(a,'Mean',header=TRUE)
a<-table.element(a,'Standard Deviation',header=TRUE)
a<-table.element(a,'Range',header=TRUE)
a<-table.row.end(a)
for (j in 1:np) {
a<-table.row.start(a)
a<-table.element(a,j,header=TRUE)
a<-table.element(a,arr.mean[j])
a<-table.element(a,arr.sd[j] )
a<-table.element(a,arr.range[j] )
a<-table.row.end(a)
}
a<-table.end(a)
table.save(a,file='mytable.tab')
a<-table.start()
a<-table.row.start(a)
a<-table.element(a,'Regression: S.E.(k) = alpha + beta * Mean(k)',2,TRUE)
a<-table.row.end(a)
a<-table.row.start(a)
a<-table.element(a,'alpha',header=TRUE)
a<-table.element(a,lm1$coefficients[[1]])
a<-table.row.end(a)
a<-table.row.start(a)
a<-table.element(a,'beta',header=TRUE)
a<-table.element(a,lm1$coefficients[[2]])
a<-table.row.end(a)
a<-table.row.start(a)
a<-table.element(a,'S.D.',header=TRUE)
a<-table.element(a,summary(lm1)$coefficients[2,2])
a<-table.row.end(a)
a<-table.row.start(a)
a<-table.element(a,'T-STAT',header=TRUE)
a<-table.element(a,summary(lm1)$coefficients[2,3])
a<-table.row.end(a)
a<-table.row.start(a)
a<-table.element(a,'p-value',header=TRUE)
a<-table.element(a,summary(lm1)$coefficients[2,4])
a<-table.row.end(a)
a<-table.end(a)
table.save(a,file='mytable1.tab')
a<-table.start()
a<-table.row.start(a)
a<-table.element(a,'Regression: ln S.E.(k) = alpha + beta * ln Mean(k)',2,TRUE)
a<-table.row.end(a)
a<-table.row.start(a)
a<-table.element(a,'alpha',header=TRUE)
a<-table.element(a,lnlm1$coefficients[[1]])
a<-table.row.end(a)
a<-table.row.start(a)
a<-table.element(a,'beta',header=TRUE)
a<-table.element(a,lnlm1$coefficients[[2]])
a<-table.row.end(a)
a<-table.row.start(a)
a<-table.element(a,'S.D.',header=TRUE)
a<-table.element(a,summary(lnlm1)$coefficients[2,2])
a<-table.row.end(a)
a<-table.row.start(a)
a<-table.element(a,'T-STAT',header=TRUE)
a<-table.element(a,summary(lnlm1)$coefficients[2,3])
a<-table.row.end(a)
a<-table.row.start(a)
a<-table.element(a,'p-value',header=TRUE)
a<-table.element(a,summary(lnlm1)$coefficients[2,4])
a<-table.row.end(a)
a<-table.row.start(a)
a<-table.element(a,'Lambda',header=TRUE)
a<-table.element(a,1-lnlm1$coefficients[[2]])
a<-table.row.end(a)
a<-table.end(a)
table.save(a,file='mytable2.tab')