\begin{tabular}{lllllllll}
\hline
Summary of computational transaction \tabularnewline
Raw Input & view raw input (R code)  \tabularnewline
Raw Output & view raw output of R engine  \tabularnewline
Computing time & 1 seconds \tabularnewline
R Server & 'Gwilym Jenkins' @ jenkins.wessa.net \tabularnewline
\hline
\end{tabular}
%Source: https://freestatistics.org/blog/index.php?pk=236019&T=0
[TABLE]
[ROW][C]Summary of computational transaction[/C][/ROW]
[ROW][C]Raw Input[/C][C]view raw input (R code) [/C][/ROW]
[ROW][C]Raw Output[/C][C]view raw output of R engine [/C][/ROW]
[ROW][C]Computing time[/C][C]1 seconds[/C][/ROW]
[ROW][C]R Server[/C][C]'Gwilym Jenkins' @ jenkins.wessa.net[/C][/ROW]
[/TABLE]
Source: https://freestatistics.org/blog/index.php?pk=236019&T=0
If you paste this QR Code into your document, anyone with a smartphone or tablet will be able to scan it and view this table in a browser.
If you paste this QR Code into your document, anyone with a smartphone or tablet will be able to scan it and view this table in a browser.
If you paste this QR Code into your document, anyone with a smartphone or tablet will be able to scan it and view this table in a browser.
If you paste this QR Code into your document, anyone with a smartphone or tablet will be able to scan it and view this table in a browser.
If you paste this QR Code into your document, anyone with a smartphone or tablet will be able to scan it and view this table in a browser.
| Univariate Dataseries | | Name of dataseries | immigratie | | Source | http://statline.cbs.nl/StatWeb/publication/?DM=SLNL&PA=37943NED&D1=0-9&D2=0-2,4-6,8-10,12-14,17-19,21-23,25-27,29-31,34-36,38-40,42-44,46-48,51-53,55-57,59-61,63-65,68-70,72-74,76-78,80-82,85-87,89-91,93-95,97-99,102-104,106-108,110-112,114-116,119-121,123-125,127-129,131-133,136-138,140-142,144-146,148-150,153-155,157-159,161-163,165-167,170-172,174-176,178-180,182-184,187-189,191-193,195-197,199-201,203-206,208-210,212-214,216-218,220-223,225-227,229-231,233-235,237-240,242-244,246-248,250-252,254-257,259-261,263-265,267-269,271-274,276-278,280-282,284-286,288-291,293-295,297-299,301-303,306-308,310-312,314-331&HDR=T&STB=G1&VW=T | | Description | de immigratie in belgi� per maand van 2007 t.e.m 2013 | | Number of observations | 93 |
\begin{tabular}{lllllllll}
\hline
Univariate Dataseries \tabularnewline
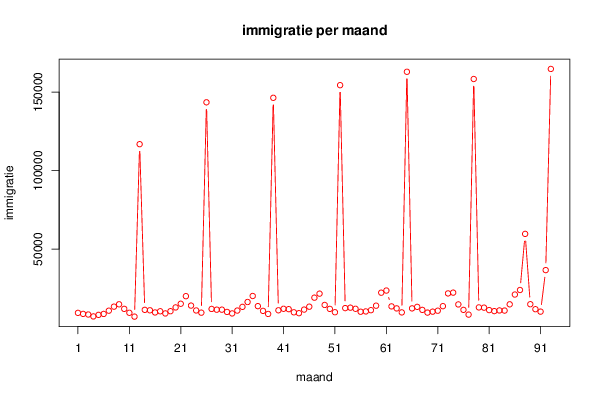
Name of dataseries & immigratie \tabularnewline
Source & http://statline.cbs.nl/StatWeb/publication/?DM=SLNL&PA=37943NED&D1=0-9&D2=0-2,4-6,8-10,12-14,17-19,21-23,25-27,29-31,34-36,38-40,42-44,46-48,51-53,55-57,59-61,63-65,68-70,72-74,76-78,80-82,85-87,89-91,93-95,97-99,102-104,106-108,110-112,114-116,119-121,123-125,127-129,131-133,136-138,140-142,144-146,148-150,153-155,157-159,161-163,165-167,170-172,174-176,178-180,182-184,187-189,191-193,195-197,199-201,203-206,208-210,212-214,216-218,220-223,225-227,229-231,233-235,237-240,242-244,246-248,250-252,254-257,259-261,263-265,267-269,271-274,276-278,280-282,284-286,288-291,293-295,297-299,301-303,306-308,310-312,314-331&HDR=T&STB=G1&VW=T \tabularnewline
Description & de immigratie in belgi� per maand van 2007 t.e.m 2013 \tabularnewline
Number of observations & 93 \tabularnewline
\hline
\end{tabular}
%Source: https://freestatistics.org/blog/index.php?pk=236019&T=1
[TABLE]
[ROW][C]Univariate Dataseries[/C][/ROW]
[ROW][C]Name of dataseries[/C][C]immigratie[/C][/ROW]
[ROW][C]Source[/C][C]http://statline.cbs.nl/StatWeb/publication/?DM=SLNL&PA=37943NED&D1=0-9&D2=0-2,4-6,8-10,12-14,17-19,21-23,25-27,29-31,34-36,38-40,42-44,46-48,51-53,55-57,59-61,63-65,68-70,72-74,76-78,80-82,85-87,89-91,93-95,97-99,102-104,106-108,110-112,114-116,119-121,123-125,127-129,131-133,136-138,140-142,144-146,148-150,153-155,157-159,161-163,165-167,170-172,174-176,178-180,182-184,187-189,191-193,195-197,199-201,203-206,208-210,212-214,216-218,220-223,225-227,229-231,233-235,237-240,242-244,246-248,250-252,254-257,259-261,263-265,267-269,271-274,276-278,280-282,284-286,288-291,293-295,297-299,301-303,306-308,310-312,314-331&HDR=T&STB=G1&VW=T[/C][/ROW]
[ROW][C]Description[/C][C]de immigratie in belgi� per maand van 2007 t.e.m 2013[/C][/ROW]
[ROW][C]Number of observations[/C][C]93[/C][/ROW]
[/TABLE]
Source: https://freestatistics.org/blog/index.php?pk=236019&T=1
Globally Unique Identifier (entire table): ba.freestatistics.org/blog/index.php?pk=236019&T=1
As an alternative you can also use a QR Code:
The GUIDs for individual cells are displayed in the table below:
| Univariate Dataseries | | Name of dataseries | immigratie | | Source | http://statline.cbs.nl/StatWeb/publication/?DM=SLNL&PA=37943NED&D1=0-9&D2=0-2,4-6,8-10,12-14,17-19,21-23,25-27,29-31,34-36,38-40,42-44,46-48,51-53,55-57,59-61,63-65,68-70,72-74,76-78,80-82,85-87,89-91,93-95,97-99,102-104,106-108,110-112,114-116,119-121,123-125,127-129,131-133,136-138,140-142,144-146,148-150,153-155,157-159,161-163,165-167,170-172,174-176,178-180,182-184,187-189,191-193,195-197,199-201,203-206,208-210,212-214,216-218,220-223,225-227,229-231,233-235,237-240,242-244,246-248,250-252,254-257,259-261,263-265,267-269,271-274,276-278,280-282,284-286,288-291,293-295,297-299,301-303,306-308,310-312,314-331&HDR=T&STB=G1&VW=T | | Description | de immigratie in belgi� per maand van 2007 t.e.m 2013 | | Number of observations | 93 |
If you paste this QR Code into your document, anyone with a smartphone or tablet will be able to scan it and view this table in a browser.
If you paste this QR Code into your document, anyone with a smartphone or tablet will be able to scan it and view this table in a browser.
If you paste this QR Code into your document, anyone with a smartphone or tablet will be able to scan it and view this table in a browser.
If you paste this QR Code into your document, anyone with a smartphone or tablet will be able to scan it and view this table in a browser.
If you paste this QR Code into your document, anyone with a smartphone or tablet will be able to scan it and view this table in a browser.
|