Free Statistics

of Irreproducible Research!

Author's title

Author*Unverified author*
R Software Modulerwasp_cross.wasp
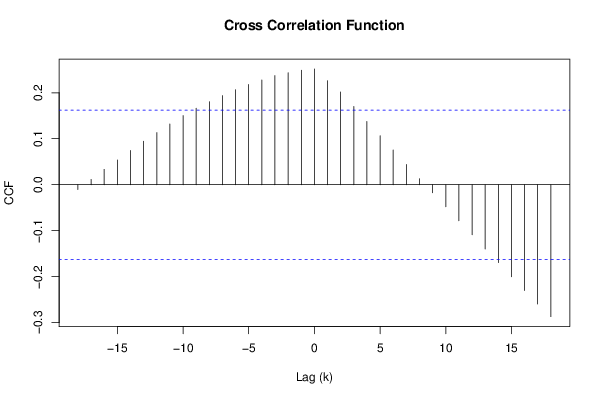
Title produced by softwareCross Correlation Function
Date of computationFri, 31 Oct 2014 09:32:47 +0000
Cite this page as followsStatistical Computations at FreeStatistics.org, Office for Research Development and Education, URL https://freestatistics.org/blog/index.php?v=date/2014/Oct/31/t1414748003pencunfieo4e27a.htm/, Retrieved Mon, 13 May 2024 12:38:21 +0000
Statistical Computations at FreeStatistics.org, Office for Research Development and Education, URL https://freestatistics.org/blog/index.php?pk=250565, Retrieved Mon, 13 May 2024 12:38:21 +0000
QR Codes:

Original text written by user:
IsPrivate?No (this computation is public)
User-defined keywords
Estimated Impact104
Family? (F = Feedback message, R = changed R code, M = changed R Module, P = changed Parameters, D = changed Data)
-       [Cross Correlation Function] [] [2014-10-31 09:32:47] [d41d8cd98f00b204e9800998ecf8427e] [Current]
Feedback Forum

Post a new message
Dataseries X:
0.1358
0.1387
0.1363
0.1377
0.1407
0.1422
0.1431
0.1446
0.1461
0.1466
0.1471
0.1475
0.1475
0.1485
0.1475
0.148
0.148
0.1485
0.1475
0.148
0.148
0.1485
0.1485
0.148
0.149
0.1485
0.148
0.1475
0.1471
0.1471
0.1456
0.1456
0.1451
0.1451
0.1446
0.1446
0.1446
0.1451
0.1441
0.1441
0.1436
0.1436
0.1436
0.1431
0.1431
0.1436
0.1431
0.1426
0.1431
0.1431
0.1426
0.1426
0.1422
0.1422
0.1422
0.1426
0.1426
0.1422
0.1417
0.1417
0.1422
0.1422
0.1426
0.1422
0.1422
0.1422
0.1422
0.1422
0.1431
0.1426
0.1426
0.1422
0.1422
0.1426
0.1422
0.1426
0.1426
0.1426
0.1426
0.1426
0.1422
0.1422
0.1426
0.1426
0.1422
0.1422
0.1426
0.1426
0.1422
0.1422
0.1426
0.1422
0.1426
0.1422
0.1422
0.1417
0.1422
0.1422
0.1417
0.1426
0.1417
0.1412
0.1422
0.1417
0.1407
0.1407
0.1402
0.1407
0.1407
0.1407
0.1402
0.1397
0.1397
0.1397
0.1397
0.1392
0.1387
0.1392
0.1387
0.1392
0.1382
0.1392
0.1377
0.1377
0.1382
0.1382
0.1382
0.1373
0.1373
0.1373
0.1377
0.1373
0.1373
0.1373
0.1368
0.1363
0.1368
0.1368
0.1363
0.1358
0.1353
0.1353
0.1343
0.1348
0.1343
0.1343
	
Dataseries Y:
-67.48769
-64.93435
-62.09455
-59.24374
-56.24434
-53.29357
-50.24352
-47.21371
-44.31956
-41.40615
-38.67882
-36.07201
-33.53312
-31.24318
-29.06622
-27.10601
-25.44346
-23.95676
-22.79198
-21.83444
-21.21284
-20.82125
-20.76539
-20.99605
-21.44044
-22.24562
-23.3189
-24.66141
-26.26336
-28.08825
-30.15747
-32.43541
-34.91399
-37.57035
-40.37001
-43.2971
-46.32778
-49.41776
-52.56352
-55.74308
-58.90207
-62.03418
-65.11547
-68.08083
-70.93258
-73.63394
-76.16604
-78.49364
-80.59772
-82.46155
-84.05849
-85.37479
-86.38548
-87.08258
-87.44406
-87.47346
-87.14482
-86.47578
-85.43721
-84.05641
-82.30603
-80.19695
-77.77158
-74.98702
-71.90565
-68.5277
-64.824
-60.87651
-56.64985
-52.18774
-47.56321
-42.72731
-37.76972
-32.66815
-27.50522
-22.30677
-17.01678
-11.75518
-6.494408
-1.300473
3.773934
8.736804
13.53007
18.14927
22.54604
26.70576
30.59934
34.20228
37.48168
40.43245
43.04378
45.2574
47.12449
48.55617
49.63199
50.30155
50.50163
50.3484
49.71404
48.66773
47.20958
45.52402
43.37497
40.76828
37.89896
34.59856
31.07775
27.26912
23.08356
18.6522
14.00902
9.275627
4.388309
-0.7375945
-5.85959
-11.15065
-16.37748
-21.49657
-26.80144
-32.05593
-37.20892
-42.15165
-46.9585
-51.67009
-56.10513
-60.32025
-64.29823
-68.01822
-71.50566
-74.64172
-77.55137
-80.04708
-82.2119
-84.0584
-85.54139
-86.68427
-87.47647
-87.92064
-88.03718
-87.83202
-87.28342
-86.42725
-85.27068
-83.88298
-82.24538
-80.32531


Summary of computational transaction
Raw Inputview raw input (R code)
Raw Outputview raw output of R engine
Computing time1 seconds
R Server'Gertrude Mary Cox' @ cox.wessa.net

\begin{tabular}{lllllllll}
\hline
Summary of computational transaction \tabularnewline
Raw Input & view raw input (R code)  \tabularnewline
Raw Output & view raw output of R engine  \tabularnewline
Computing time & 1 seconds \tabularnewline
R Server & 'Gertrude Mary Cox' @ cox.wessa.net \tabularnewline
\hline
\end{tabular}
%Source: https://freestatistics.org/blog/index.php?pk=250565&T=0

[TABLE]
[ROW][C]Summary of computational transaction[/C][/ROW]
[ROW][C]Raw Input[/C][C]view raw input (R code) [/C][/ROW]
[ROW][C]Raw Output[/C][C]view raw output of R engine [/C][/ROW]
[ROW][C]Computing time[/C][C]1 seconds[/C][/ROW]
[ROW][C]R Server[/C][C]'Gertrude Mary Cox' @ cox.wessa.net[/C][/ROW]
[/TABLE]
Source: https://freestatistics.org/blog/index.php?pk=250565&T=0

Globally Unique Identifier (entire table): ba.freestatistics.org/blog/index.php?pk=250565&T=0

As an alternative you can also use a QR Code:  

The GUIDs for individual cells are displayed in the table below:

Summary of computational transaction
Raw Inputview raw input (R code)
Raw Outputview raw output of R engine
Computing time1 seconds
R Server'Gertrude Mary Cox' @ cox.wessa.net


Cross Correlation Function
ParameterValue
Box-Cox transformation parameter (lambda) of X series1
Degree of non-seasonal differencing (d) of X series0
Degree of seasonal differencing (D) of X series0
Seasonal Period (s)1
Box-Cox transformation parameter (lambda) of Y series1
Degree of non-seasonal differencing (d) of Y series0
Degree of seasonal differencing (D) of Y series0
krho(Y[t],X[t+k])
-18-0.0105185549728786
-170.0115406147378546
-160.0333687483797661
-150.0538988039769799
-140.0745801032138956
-130.0944290746627984
-120.11325216166277
-110.131927936507984
-100.150299598738579
-90.166156756631961
-80.180363390989338
-70.193774618470684
-60.206374378083898
-50.218070567920085
-40.227698350970423
-30.237295368580186
-20.243686804985022
-10.248875945400085
00.251756515476576
10.226231932693231
20.201728121771795
30.170093345892284
40.137403698873662
50.106544687686247
60.0755918192183833
70.0439375718069873
80.0128234680293294
9-0.0173610410980102
10-0.0478802396784525
11-0.0784725238386559
12-0.109024828727649
13-0.139953064191038
14-0.169405336079195
15-0.200300764627354
16-0.23010866024009
17-0.259319450469288
18-0.286963364232656

\begin{tabular}{lllllllll}
\hline
Cross Correlation Function \tabularnewline
Parameter & Value \tabularnewline
Box-Cox transformation parameter (lambda) of X series & 1 \tabularnewline
Degree of non-seasonal differencing (d) of X series & 0 \tabularnewline
Degree of seasonal differencing (D) of X series & 0 \tabularnewline
Seasonal Period (s) & 1 \tabularnewline
Box-Cox transformation parameter (lambda) of Y series & 1 \tabularnewline
Degree of non-seasonal differencing (d) of Y series & 0 \tabularnewline
Degree of seasonal differencing (D) of Y series & 0 \tabularnewline
k & rho(Y[t],X[t+k]) \tabularnewline
-18 & -0.0105185549728786 \tabularnewline
-17 & 0.0115406147378546 \tabularnewline
-16 & 0.0333687483797661 \tabularnewline
-15 & 0.0538988039769799 \tabularnewline
-14 & 0.0745801032138956 \tabularnewline
-13 & 0.0944290746627984 \tabularnewline
-12 & 0.11325216166277 \tabularnewline
-11 & 0.131927936507984 \tabularnewline
-10 & 0.150299598738579 \tabularnewline
-9 & 0.166156756631961 \tabularnewline
-8 & 0.180363390989338 \tabularnewline
-7 & 0.193774618470684 \tabularnewline
-6 & 0.206374378083898 \tabularnewline
-5 & 0.218070567920085 \tabularnewline
-4 & 0.227698350970423 \tabularnewline
-3 & 0.237295368580186 \tabularnewline
-2 & 0.243686804985022 \tabularnewline
-1 & 0.248875945400085 \tabularnewline
0 & 0.251756515476576 \tabularnewline
1 & 0.226231932693231 \tabularnewline
2 & 0.201728121771795 \tabularnewline
3 & 0.170093345892284 \tabularnewline
4 & 0.137403698873662 \tabularnewline
5 & 0.106544687686247 \tabularnewline
6 & 0.0755918192183833 \tabularnewline
7 & 0.0439375718069873 \tabularnewline
8 & 0.0128234680293294 \tabularnewline
9 & -0.0173610410980102 \tabularnewline
10 & -0.0478802396784525 \tabularnewline
11 & -0.0784725238386559 \tabularnewline
12 & -0.109024828727649 \tabularnewline
13 & -0.139953064191038 \tabularnewline
14 & -0.169405336079195 \tabularnewline
15 & -0.200300764627354 \tabularnewline
16 & -0.23010866024009 \tabularnewline
17 & -0.259319450469288 \tabularnewline
18 & -0.286963364232656 \tabularnewline
\hline
\end{tabular}
%Source: https://freestatistics.org/blog/index.php?pk=250565&T=1

[TABLE]
[ROW][C]Cross Correlation Function[/C][/ROW]
[ROW][C]Parameter[/C][C]Value[/C][/ROW]
[ROW][C]Box-Cox transformation parameter (lambda) of X series[/C][C]1[/C][/ROW]
[ROW][C]Degree of non-seasonal differencing (d) of X series[/C][C]0[/C][/ROW]
[ROW][C]Degree of seasonal differencing (D) of X series[/C][C]0[/C][/ROW]
[ROW][C]Seasonal Period (s)[/C][C]1[/C][/ROW]
[ROW][C]Box-Cox transformation parameter (lambda) of Y series[/C][C]1[/C][/ROW]
[ROW][C]Degree of non-seasonal differencing (d) of Y series[/C][C]0[/C][/ROW]
[ROW][C]Degree of seasonal differencing (D) of Y series[/C][C]0[/C][/ROW]
[ROW][C]k[/C][C]rho(Y[t],X[t+k])[/C][/ROW]
[ROW][C]-18[/C][C]-0.0105185549728786[/C][/ROW]
[ROW][C]-17[/C][C]0.0115406147378546[/C][/ROW]
[ROW][C]-16[/C][C]0.0333687483797661[/C][/ROW]
[ROW][C]-15[/C][C]0.0538988039769799[/C][/ROW]
[ROW][C]-14[/C][C]0.0745801032138956[/C][/ROW]
[ROW][C]-13[/C][C]0.0944290746627984[/C][/ROW]
[ROW][C]-12[/C][C]0.11325216166277[/C][/ROW]
[ROW][C]-11[/C][C]0.131927936507984[/C][/ROW]
[ROW][C]-10[/C][C]0.150299598738579[/C][/ROW]
[ROW][C]-9[/C][C]0.166156756631961[/C][/ROW]
[ROW][C]-8[/C][C]0.180363390989338[/C][/ROW]
[ROW][C]-7[/C][C]0.193774618470684[/C][/ROW]
[ROW][C]-6[/C][C]0.206374378083898[/C][/ROW]
[ROW][C]-5[/C][C]0.218070567920085[/C][/ROW]
[ROW][C]-4[/C][C]0.227698350970423[/C][/ROW]
[ROW][C]-3[/C][C]0.237295368580186[/C][/ROW]
[ROW][C]-2[/C][C]0.243686804985022[/C][/ROW]
[ROW][C]-1[/C][C]0.248875945400085[/C][/ROW]
[ROW][C]0[/C][C]0.251756515476576[/C][/ROW]
[ROW][C]1[/C][C]0.226231932693231[/C][/ROW]
[ROW][C]2[/C][C]0.201728121771795[/C][/ROW]
[ROW][C]3[/C][C]0.170093345892284[/C][/ROW]
[ROW][C]4[/C][C]0.137403698873662[/C][/ROW]
[ROW][C]5[/C][C]0.106544687686247[/C][/ROW]
[ROW][C]6[/C][C]0.0755918192183833[/C][/ROW]
[ROW][C]7[/C][C]0.0439375718069873[/C][/ROW]
[ROW][C]8[/C][C]0.0128234680293294[/C][/ROW]
[ROW][C]9[/C][C]-0.0173610410980102[/C][/ROW]
[ROW][C]10[/C][C]-0.0478802396784525[/C][/ROW]
[ROW][C]11[/C][C]-0.0784725238386559[/C][/ROW]
[ROW][C]12[/C][C]-0.109024828727649[/C][/ROW]
[ROW][C]13[/C][C]-0.139953064191038[/C][/ROW]
[ROW][C]14[/C][C]-0.169405336079195[/C][/ROW]
[ROW][C]15[/C][C]-0.200300764627354[/C][/ROW]
[ROW][C]16[/C][C]-0.23010866024009[/C][/ROW]
[ROW][C]17[/C][C]-0.259319450469288[/C][/ROW]
[ROW][C]18[/C][C]-0.286963364232656[/C][/ROW]
[/TABLE]
Source: https://freestatistics.org/blog/index.php?pk=250565&T=1

Globally Unique Identifier (entire table): ba.freestatistics.org/blog/index.php?pk=250565&T=1

As an alternative you can also use a QR Code:  

The GUIDs for individual cells are displayed in the table below:

Cross Correlation Function
ParameterValue
Box-Cox transformation parameter (lambda) of X series1
Degree of non-seasonal differencing (d) of X series0
Degree of seasonal differencing (D) of X series0
Seasonal Period (s)1
Box-Cox transformation parameter (lambda) of Y series1
Degree of non-seasonal differencing (d) of Y series0
Degree of seasonal differencing (D) of Y series0
krho(Y[t],X[t+k])
-18-0.0105185549728786
-170.0115406147378546
-160.0333687483797661
-150.0538988039769799
-140.0745801032138956
-130.0944290746627984
-120.11325216166277
-110.131927936507984
-100.150299598738579
-90.166156756631961
-80.180363390989338
-70.193774618470684
-60.206374378083898
-50.218070567920085
-40.227698350970423
-30.237295368580186
-20.243686804985022
-10.248875945400085
00.251756515476576
10.226231932693231
20.201728121771795
30.170093345892284
40.137403698873662
50.106544687686247
60.0755918192183833
70.0439375718069873
80.0128234680293294
9-0.0173610410980102
10-0.0478802396784525
11-0.0784725238386559
12-0.109024828727649
13-0.139953064191038
14-0.169405336079195
15-0.200300764627354
16-0.23010866024009
17-0.259319450469288
18-0.286963364232656


Parameters (Session):
par1 = 1 ; par2 = 0 ; par3 = 0 ; par4 = 1 ; par5 = 1 ; par6 = 0 ; par7 = 0 ; par8 = na.pass ;
Parameters (R input):
par1 = 1 ; par2 = 0 ; par3 = 0 ; par4 = 1 ; par5 = 1 ; par6 = 0 ; par7 = 0 ; par8 = na.pass ;
R code (references can be found in the software module):
par1 <- as.numeric(par1)
par2 <- as.numeric(par2)
par3 <- as.numeric(par3)
par4 <- as.numeric(par4)
par5 <- as.numeric(par5)
par6 <- as.numeric(par6)
par7 <- as.numeric(par7)
if (par8=='na.fail') par8 <- na.fail else par8 <- na.pass
ccf <- function (x, y, lag.max = NULL, type = c('correlation', 'covariance'), plot = TRUE, na.action = na.fail, ...) {
type <- match.arg(type)
if (is.matrix(x) || is.matrix(y))
stop('univariate time series only')
X <- na.action(ts.intersect(as.ts(x), as.ts(y)))
colnames(X) <- c(deparse(substitute(x))[1L], deparse(substitute(y))[1L])
acf.out <- acf(X, lag.max = lag.max, plot = FALSE, type = type, na.action=na.action)
lag <- c(rev(acf.out$lag[-1, 2, 1]), acf.out$lag[, 1, 2])
y <- c(rev(acf.out$acf[-1, 2, 1]), acf.out$acf[, 1, 2])
acf.out$acf <- array(y, dim = c(length(y), 1L, 1L))
acf.out$lag <- array(lag, dim = c(length(y), 1L, 1L))
acf.out$snames <- paste(acf.out$snames, collapse = ' & ')
if (plot) {
plot(acf.out, ...)
return(invisible(acf.out))
}
else return(acf.out)
}
if (par1 == 0) {
x <- log(x)
} else {
x <- (x ^ par1 - 1) / par1
}
if (par5 == 0) {
y <- log(y)
} else {
y <- (y ^ par5 - 1) / par5
}
if (par2 > 0) x <- diff(x,lag=1,difference=par2)
if (par6 > 0) y <- diff(y,lag=1,difference=par6)
if (par3 > 0) x <- diff(x,lag=par4,difference=par3)
if (par7 > 0) y <- diff(y,lag=par4,difference=par7)
x
y
bitmap(file='test1.png')
(r <- ccf(x,y,na.action=par8,main='Cross Correlation Function',ylab='CCF',xlab='Lag (k)'))
dev.off()
load(file='createtable')
a<-table.start()
a<-table.row.start(a)
a<-table.element(a,'Cross Correlation Function',2,TRUE)
a<-table.row.end(a)
a<-table.row.start(a)
a<-table.element(a,'Parameter',header=TRUE)
a<-table.element(a,'Value',header=TRUE)
a<-table.row.end(a)
a<-table.row.start(a)
a<-table.element(a,'Box-Cox transformation parameter (lambda) of X series',header=TRUE)
a<-table.element(a,par1)
a<-table.row.end(a)
a<-table.row.start(a)
a<-table.element(a,'Degree of non-seasonal differencing (d) of X series',header=TRUE)
a<-table.element(a,par2)
a<-table.row.end(a)
a<-table.row.start(a)
a<-table.element(a,'Degree of seasonal differencing (D) of X series',header=TRUE)
a<-table.element(a,par3)
a<-table.row.end(a)
a<-table.row.start(a)
a<-table.element(a,'Seasonal Period (s)',header=TRUE)
a<-table.element(a,par4)
a<-table.row.end(a)
a<-table.row.start(a)
a<-table.element(a,'Box-Cox transformation parameter (lambda) of Y series',header=TRUE)
a<-table.element(a,par5)
a<-table.row.end(a)
a<-table.row.start(a)
a<-table.element(a,'Degree of non-seasonal differencing (d) of Y series',header=TRUE)
a<-table.element(a,par6)
a<-table.row.end(a)
a<-table.row.start(a)
a<-table.element(a,'Degree of seasonal differencing (D) of Y series',header=TRUE)
a<-table.element(a,par7)
a<-table.row.end(a)
a<-table.row.start(a)
a<-table.element(a,'k',header=TRUE)
a<-table.element(a,'rho(Y[t],X[t+k])',header=TRUE)
a<-table.row.end(a)
mylength <- length(r$acf)
myhalf <- floor((mylength-1)/2)
for (i in 1:mylength) {
a<-table.row.start(a)
a<-table.element(a,i-myhalf-1,header=TRUE)
a<-table.element(a,r$acf[i])
a<-table.row.end(a)
}
a<-table.end(a)
table.save(a,file='mytable.tab')