Free Statistics
of Irreproducible Research!
Description of Statistical Computation | |||||||||||||||||||||||||||||||||||||||||||||||||||||||||||||||||||||||||||||||||||||||||||||||||||||||||||||||||||||||||||||||||||||||||||||||||||||||||||||||||||||||||
|---|---|---|---|---|---|---|---|---|---|---|---|---|---|---|---|---|---|---|---|---|---|---|---|---|---|---|---|---|---|---|---|---|---|---|---|---|---|---|---|---|---|---|---|---|---|---|---|---|---|---|---|---|---|---|---|---|---|---|---|---|---|---|---|---|---|---|---|---|---|---|---|---|---|---|---|---|---|---|---|---|---|---|---|---|---|---|---|---|---|---|---|---|---|---|---|---|---|---|---|---|---|---|---|---|---|---|---|---|---|---|---|---|---|---|---|---|---|---|---|---|---|---|---|---|---|---|---|---|---|---|---|---|---|---|---|---|---|---|---|---|---|---|---|---|---|---|---|---|---|---|---|---|---|---|---|---|---|---|---|---|---|---|---|---|---|---|---|---|---|
| Author's title | |||||||||||||||||||||||||||||||||||||||||||||||||||||||||||||||||||||||||||||||||||||||||||||||||||||||||||||||||||||||||||||||||||||||||||||||||||||||||||||||||||||||||
| Author | *The author of this computation has been verified* | ||||||||||||||||||||||||||||||||||||||||||||||||||||||||||||||||||||||||||||||||||||||||||||||||||||||||||||||||||||||||||||||||||||||||||||||||||||||||||||||||||||||||
| R Software Module | rwasp_twosampletests_mean.wasp | ||||||||||||||||||||||||||||||||||||||||||||||||||||||||||||||||||||||||||||||||||||||||||||||||||||||||||||||||||||||||||||||||||||||||||||||||||||||||||||||||||||||||
| Title produced by software | Paired and Unpaired Two Samples Tests about the Mean | ||||||||||||||||||||||||||||||||||||||||||||||||||||||||||||||||||||||||||||||||||||||||||||||||||||||||||||||||||||||||||||||||||||||||||||||||||||||||||||||||||||||||
| Date of computation | Tue, 21 Oct 2014 08:51:16 +0100 | ||||||||||||||||||||||||||||||||||||||||||||||||||||||||||||||||||||||||||||||||||||||||||||||||||||||||||||||||||||||||||||||||||||||||||||||||||||||||||||||||||||||||
| Cite this page as follows | Statistical Computations at FreeStatistics.org, Office for Research Development and Education, URL https://freestatistics.org/blog/index.php?v=date/2014/Oct/21/t1413877891oxt62nxhxp5we0o.htm/, Retrieved Mon, 13 May 2024 19:51:27 +0000 | ||||||||||||||||||||||||||||||||||||||||||||||||||||||||||||||||||||||||||||||||||||||||||||||||||||||||||||||||||||||||||||||||||||||||||||||||||||||||||||||||||||||||
| Statistical Computations at FreeStatistics.org, Office for Research Development and Education, URL https://freestatistics.org/blog/index.php?pk=244323, Retrieved Mon, 13 May 2024 19:51:27 +0000 | |||||||||||||||||||||||||||||||||||||||||||||||||||||||||||||||||||||||||||||||||||||||||||||||||||||||||||||||||||||||||||||||||||||||||||||||||||||||||||||||||||||||||
| QR Codes: | |||||||||||||||||||||||||||||||||||||||||||||||||||||||||||||||||||||||||||||||||||||||||||||||||||||||||||||||||||||||||||||||||||||||||||||||||||||||||||||||||||||||||
|
| |||||||||||||||||||||||||||||||||||||||||||||||||||||||||||||||||||||||||||||||||||||||||||||||||||||||||||||||||||||||||||||||||||||||||||||||||||||||||||||||||||||||||
| Original text written by user: | |||||||||||||||||||||||||||||||||||||||||||||||||||||||||||||||||||||||||||||||||||||||||||||||||||||||||||||||||||||||||||||||||||||||||||||||||||||||||||||||||||||||||
| IsPrivate? | No (this computation is public) | ||||||||||||||||||||||||||||||||||||||||||||||||||||||||||||||||||||||||||||||||||||||||||||||||||||||||||||||||||||||||||||||||||||||||||||||||||||||||||||||||||||||||
| User-defined keywords | |||||||||||||||||||||||||||||||||||||||||||||||||||||||||||||||||||||||||||||||||||||||||||||||||||||||||||||||||||||||||||||||||||||||||||||||||||||||||||||||||||||||||
| Estimated Impact | 296 | ||||||||||||||||||||||||||||||||||||||||||||||||||||||||||||||||||||||||||||||||||||||||||||||||||||||||||||||||||||||||||||||||||||||||||||||||||||||||||||||||||||||||
Tree of Dependent Computations | |||||||||||||||||||||||||||||||||||||||||||||||||||||||||||||||||||||||||||||||||||||||||||||||||||||||||||||||||||||||||||||||||||||||||||||||||||||||||||||||||||||||||
| Family? (F = Feedback message, R = changed R code, M = changed R Module, P = changed Parameters, D = changed Data) | |||||||||||||||||||||||||||||||||||||||||||||||||||||||||||||||||||||||||||||||||||||||||||||||||||||||||||||||||||||||||||||||||||||||||||||||||||||||||||||||||||||||||
| - [Paired and Unpaired Two Samples Tests about the Mean] [] [2010-11-01 13:13:29] [b98453cac15ba1066b407e146608df68] - RMP [Paired and Unpaired Two Samples Tests about the Mean] [] [2014-10-21 07:51:16] [63a9f0ea7bb98050796b649e85481845] [Current] - M [Paired and Unpaired Two Samples Tests about the Mean] [Ws 5 Question 2] [2014-10-29 09:21:22] [be945163e51ed825733188af308451be] - M [Paired and Unpaired Two Samples Tests about the Mean] [q2] [2014-10-29 09:26:00] [eee95947b6243a1febfcd5f41483d733] - [Paired and Unpaired Two Samples Tests about the Mean] [] [2014-10-29 09:58:13] [2b9d0c54c8c845c625e475ed5f1f3af1] - M [Paired and Unpaired Two Samples Tests about the Mean] [] [2014-10-29 10:14:48] [eee95947b6243a1febfcd5f41483d733] - [Paired and Unpaired Two Samples Tests about the Mean] [] [2014-10-29 11:26:19] [b2fe7fef0850359c2a41ad606a8f04c2] - [Paired and Unpaired Two Samples Tests about the Mean] [] [2014-10-29 11:37:31] [9b99fe494671b75fb711c2dc543f4e3e] - [Paired and Unpaired Two Samples Tests about the Mean] [] [2014-10-29 11:39:13] [9b99fe494671b75fb711c2dc543f4e3e] - [Paired and Unpaired Two Samples Tests about the Mean] [] [2014-10-29 11:39:13] [9b99fe494671b75fb711c2dc543f4e3e] - [Paired and Unpaired Two Samples Tests about the Mean] [] [2014-10-29 11:50:15] [394a9522c47495260fca596e959e6202] - M [Paired and Unpaired Two Samples Tests about the Mean] [WS5 - task2] [2014-10-29 12:41:16] [81f624c2f0b20a2549c93e7c3dccf981] - [Paired and Unpaired Two Samples Tests about the Mean] [] [2014-10-29 12:54:16] [e493208d2907342b139e6792bbaea494] - M [Paired and Unpaired Two Samples Tests about the Mean] [] [2014-10-29 13:17:23] [eee95947b6243a1febfcd5f41483d733] - [Paired and Unpaired Two Samples Tests about the Mean] [] [2014-10-29 13:24:15] [765bd0d5d4a0c852014c120c6930661d] - D [Paired and Unpaired Two Samples Tests about the Mean] [workshop 5 bereke...] [2014-10-29 13:34:10] [b007041690f75f30ec26eb43925b7b35] - M [Paired and Unpaired Two Samples Tests about the Mean] [] [2014-10-29 13:42:02] [ae96d02647dd9ad9c105f1fa6642e295] - M [Paired and Unpaired Two Samples Tests about the Mean] [] [2014-10-29 13:44:40] [d253a55552bf9917a397def3be261e30] - MP [Paired and Unpaired Two Samples Tests about the Mean] [] [2014-10-29 13:45:03] [044144d0728beecdb08e0d94daaff202] - M [Paired and Unpaired Two Samples Tests about the Mean] [WS5-2] [2014-10-29 13:52:17] [40df8d8b5657a9599acc6ccced535535] - R PD [Paired and Unpaired Two Samples Tests about the Mean] [] [2014-10-29 13:53:50] [044144d0728beecdb08e0d94daaff202] - [Paired and Unpaired Two Samples Tests about the Mean] [question 2] [2014-10-29 13:59:42] [2ba32e9656c7c3fdddad3ba3f1588288] - [Paired and Unpaired Two Samples Tests about the Mean] [] [2014-10-29 14:04:24] [bca3c6529212edfac3e771806c79a908] - [Paired and Unpaired Two Samples Tests about the Mean] [workshop 5] [2014-10-29 14:04:14] [a6b2572b29932aa41ecec373f1b28823] - R PD [Paired and Unpaired Two Samples Tests about the Mean] [] [2014-10-29 14:04:55] [c2c160edf30e228bd3a949bf24376c2c] - R P [Paired and Unpaired Two Samples Tests about the Mean] [] [2014-10-29 14:07:35] [c2c160edf30e228bd3a949bf24376c2c] - [Paired and Unpaired Two Samples Tests about the Mean] [workshop 5] [2014-10-29 14:09:35] [a6b2572b29932aa41ecec373f1b28823] - R PD [Paired and Unpaired Two Samples Tests about the Mean] [] [2014-10-29 14:09:10] [044144d0728beecdb08e0d94daaff202] - R PD [Paired and Unpaired Two Samples Tests about the Mean] [] [2014-10-29 14:13:33] [044144d0728beecdb08e0d94daaff202] - R PD [Paired and Unpaired Two Samples Tests about the Mean] [] [2014-10-29 14:16:04] [044144d0728beecdb08e0d94daaff202] - R PD [Paired and Unpaired Two Samples Tests about the Mean] [] [2014-10-29 14:17:15] [c2c160edf30e228bd3a949bf24376c2c] - R PD [Paired and Unpaired Two Samples Tests about the Mean] [] [2014-10-29 14:20:34] [c2c160edf30e228bd3a949bf24376c2c] - R [Paired and Unpaired Two Samples Tests about the Mean] [] [2014-10-29 14:36:30] [c2c160edf30e228bd3a949bf24376c2c] - [Paired and Unpaired Two Samples Tests about the Mean] [Question 2 - two ...] [2014-10-29 14:21:50] [1e921ed6280e31020168fe5cd3fc7265] - M [Paired and Unpaired Two Samples Tests about the Mean] [] [2014-10-29 14:45:26] [d69b52d23ca73e15a0c741afa583703c] - [Paired and Unpaired Two Samples Tests about the Mean] [] [2014-10-29 15:10:15] [fda96889f4ef6d31c0c28fd64d281011] - M [Paired and Unpaired Two Samples Tests about the Mean] [] [2014-10-29 15:34:41] [02fb6cbf799bcf1e525e4e01c2f27ada] - D [Paired and Unpaired Two Samples Tests about the Mean] [] [2014-10-29 15:42:46] [69bf0eb8b9b38defaaf4848d8c317571] - M [Paired and Unpaired Two Samples Tests about the Mean] [compendium 5] [2014-10-29 15:48:04] [006b54b8ce76f482b86cd20c6480b526] - M [Paired and Unpaired Two Samples Tests about the Mean] [] [2014-10-29 16:51:37] [8d160a85bfd9526a7d0e42afc5fb569b] - [Paired and Unpaired Two Samples Tests about the Mean] [Q2] [2014-10-29 17:10:08] [9378e2688aa9dcfd1390615d31e9d404] - [Paired and Unpaired Two Samples Tests about the Mean] [] [2014-10-29 19:13:07] [93cb0d178904cf975da218b7c929e42d] - M [Paired and Unpaired Two Samples Tests about the Mean] [] [2014-10-30 08:05:08] [1a6d42b46b3d01bc960fcfb45e99fecd] - R D [Paired and Unpaired Two Samples Tests about the Mean] [question 2] [2014-10-30 10:09:32] [18108d1ac0353540c4304edbd3652e0f] - R PD [Paired and Unpaired Two Samples Tests about the Mean] [question 3] [2014-10-30 10:22:27] [18108d1ac0353540c4304edbd3652e0f] - M [Paired and Unpaired Two Samples Tests about the Mean] [Q2] [2014-10-30 10:26:40] [1651e47f7f65f3a10bbbb444d4b26be7] - [Paired and Unpaired Two Samples Tests about the Mean] [] [2014-10-30 10:46:11] [9922f47a08b670aeeb7c38448acbfea1] - R PD [Paired and Unpaired Two Samples Tests about the Mean] [question 5] [2014-10-30 10:55:39] [18108d1ac0353540c4304edbd3652e0f] - R PD [Paired and Unpaired Two Samples Tests about the Mean] [question 5] [2014-10-30 10:58:01] [18108d1ac0353540c4304edbd3652e0f] - R PD [Paired and Unpaired Two Samples Tests about the Mean] [Question 5] [2014-10-30 10:59:51] [18108d1ac0353540c4304edbd3652e0f] [Truncated] | |||||||||||||||||||||||||||||||||||||||||||||||||||||||||||||||||||||||||||||||||||||||||||||||||||||||||||||||||||||||||||||||||||||||||||||||||||||||||||||||||||||||||
| Feedback Forum | |||||||||||||||||||||||||||||||||||||||||||||||||||||||||||||||||||||||||||||||||||||||||||||||||||||||||||||||||||||||||||||||||||||||||||||||||||||||||||||||||||||||||
Post a new message | |||||||||||||||||||||||||||||||||||||||||||||||||||||||||||||||||||||||||||||||||||||||||||||||||||||||||||||||||||||||||||||||||||||||||||||||||||||||||||||||||||||||||
Dataset | |||||||||||||||||||||||||||||||||||||||||||||||||||||||||||||||||||||||||||||||||||||||||||||||||||||||||||||||||||||||||||||||||||||||||||||||||||||||||||||||||||||||||
| Dataseries X: | |||||||||||||||||||||||||||||||||||||||||||||||||||||||||||||||||||||||||||||||||||||||||||||||||||||||||||||||||||||||||||||||||||||||||||||||||||||||||||||||||||||||||
1 1 1 1 0 1 0 0 1 1 1 1 1 1 0 1 0 1 1 1 0 0 0 1 0 1 0 1 0 0 1 1 1 1 1 1 0 1 0 0 1 1 1 1 0 0 1 0 1 1 1 0 1 1 0 0 0 0 1 1 1 0 1 1 0 0 0 0 0 0 1 1 1 1 | |||||||||||||||||||||||||||||||||||||||||||||||||||||||||||||||||||||||||||||||||||||||||||||||||||||||||||||||||||||||||||||||||||||||||||||||||||||||||||||||||||||||||
Tables (Output of Computation) | |||||||||||||||||||||||||||||||||||||||||||||||||||||||||||||||||||||||||||||||||||||||||||||||||||||||||||||||||||||||||||||||||||||||||||||||||||||||||||||||||||||||||
| |||||||||||||||||||||||||||||||||||||||||||||||||||||||||||||||||||||||||||||||||||||||||||||||||||||||||||||||||||||||||||||||||||||||||||||||||||||||||||||||||||||||||
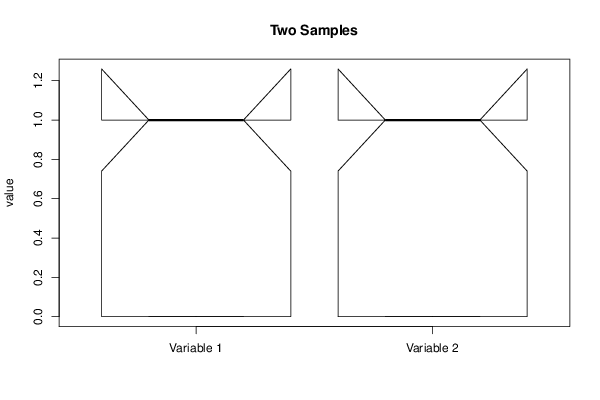
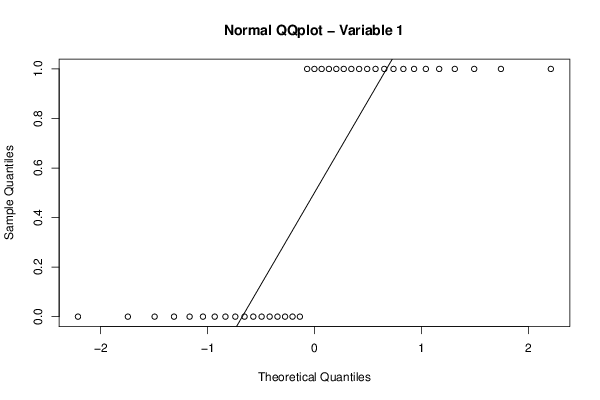
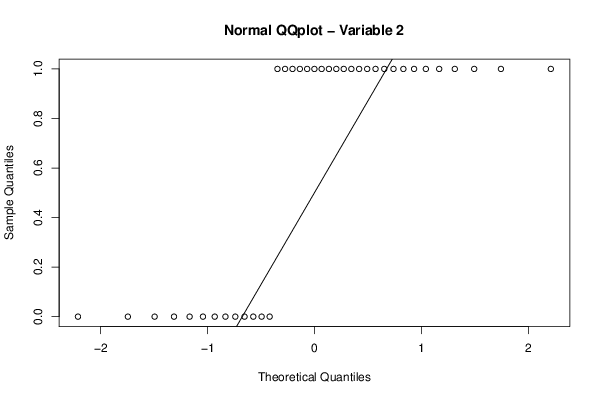
Figures (Output of Computation) | |||||||||||||||||||||||||||||||||||||||||||||||||||||||||||||||||||||||||||||||||||||||||||||||||||||||||||||||||||||||||||||||||||||||||||||||||||||||||||||||||||||||||
Input Parameters & R Code | |||||||||||||||||||||||||||||||||||||||||||||||||||||||||||||||||||||||||||||||||||||||||||||||||||||||||||||||||||||||||||||||||||||||||||||||||||||||||||||||||||||||||
| Parameters (Session): | |||||||||||||||||||||||||||||||||||||||||||||||||||||||||||||||||||||||||||||||||||||||||||||||||||||||||||||||||||||||||||||||||||||||||||||||||||||||||||||||||||||||||
| par1 = 1 ; par2 = 2 ; par3 = 0.95 ; par4 = two.sided ; par5 = paired ; par6 = 0 ; | |||||||||||||||||||||||||||||||||||||||||||||||||||||||||||||||||||||||||||||||||||||||||||||||||||||||||||||||||||||||||||||||||||||||||||||||||||||||||||||||||||||||||
| Parameters (R input): | |||||||||||||||||||||||||||||||||||||||||||||||||||||||||||||||||||||||||||||||||||||||||||||||||||||||||||||||||||||||||||||||||||||||||||||||||||||||||||||||||||||||||
| par1 = 1 ; par2 = 2 ; par3 = 0.95 ; par4 = two.sided ; par5 = paired ; par6 = 0 ; | |||||||||||||||||||||||||||||||||||||||||||||||||||||||||||||||||||||||||||||||||||||||||||||||||||||||||||||||||||||||||||||||||||||||||||||||||||||||||||||||||||||||||
| R code (references can be found in the software module): | |||||||||||||||||||||||||||||||||||||||||||||||||||||||||||||||||||||||||||||||||||||||||||||||||||||||||||||||||||||||||||||||||||||||||||||||||||||||||||||||||||||||||
par1 <- as.numeric(par1) #column number of first sample | |||||||||||||||||||||||||||||||||||||||||||||||||||||||||||||||||||||||||||||||||||||||||||||||||||||||||||||||||||||||||||||||||||||||||||||||||||||||||||||||||||||||||