Free Statistics

of Irreproducible Research!

Author's title

Author*Unverified author*
R Software Modulerwasp_autocorrelation.wasp
Title produced by software(Partial) Autocorrelation Function
Date of computationMon, 20 Oct 2014 22:25:44 +0100
Cite this page as followsStatistical Computations at FreeStatistics.org, Office for Research Development and Education, URL https://freestatistics.org/blog/index.php?v=date/2014/Oct/20/t14138403836io49i75y1bap9v.htm/, Retrieved Sun, 12 May 2024 05:38:53 +0000
Statistical Computations at FreeStatistics.org, Office for Research Development and Education, URL https://freestatistics.org/blog/index.php?pk=244277, Retrieved Sun, 12 May 2024 05:38:53 +0000
QR Codes:

Original text written by user:
IsPrivate?No (this computation is public)
User-defined keywords
Estimated Impact60
Family? (F = Feedback message, R = changed R code, M = changed R Module, P = changed Parameters, D = changed Data)
-       [(Partial) Autocorrelation Function] [] [2014-10-20 21:25:44] [96491c5b369fa11edd053689120acbcd] [Current]
Feedback Forum

Post a new message
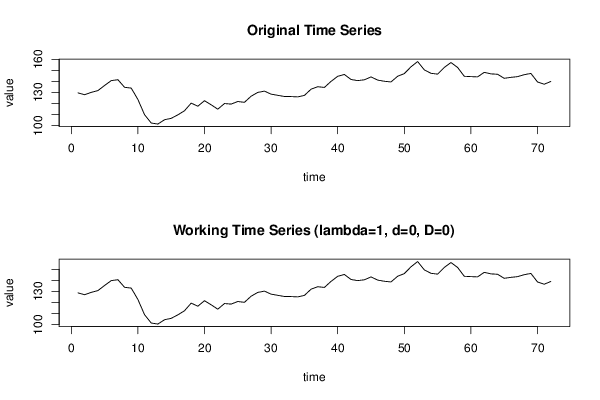
Dataseries X:
129,62
127,96
130,1
131,7
136,34
140,73
141,51
134,66
133,94
123,66
109,88
102,36
101,41
105,33
106,58
109,72
113,47
120,35
117,55
122,55
118,82
114,87
119,98
119,48
121,81
121,08
126,63
130,04
131,21
128,48
127,4
126,35
126,28
126
127,34
132,96
135,19
134,55
140,03
144,6
146,27
141,74
140,72
141,45
144,04
141,19
140,13
139,51
144,67
147,05
153,2
157,97
150,44
147,31
146,61
152,62
157,08
152,62
144,63
144,34
144,09
148,21
146,81
146,46
142,8
143,66
144,31
146,07
147,21
139,5
137,44
139,94


Summary of computational transaction
Raw Inputview raw input (R code)
Raw Outputview raw output of R engine
Computing time1 seconds
R Server'Sir Ronald Aylmer Fisher' @ fisher.wessa.net

\begin{tabular}{lllllllll}
\hline
Summary of computational transaction \tabularnewline
Raw Input & view raw input (R code)  \tabularnewline
Raw Output & view raw output of R engine  \tabularnewline
Computing time & 1 seconds \tabularnewline
R Server & 'Sir Ronald Aylmer Fisher' @ fisher.wessa.net \tabularnewline
\hline
\end{tabular}
%Source: https://freestatistics.org/blog/index.php?pk=244277&T=0

[TABLE]
[ROW][C]Summary of computational transaction[/C][/ROW]
[ROW][C]Raw Input[/C][C]view raw input (R code) [/C][/ROW]
[ROW][C]Raw Output[/C][C]view raw output of R engine [/C][/ROW]
[ROW][C]Computing time[/C][C]1 seconds[/C][/ROW]
[ROW][C]R Server[/C][C]'Sir Ronald Aylmer Fisher' @ fisher.wessa.net[/C][/ROW]
[/TABLE]
Source: https://freestatistics.org/blog/index.php?pk=244277&T=0

Globally Unique Identifier (entire table): ba.freestatistics.org/blog/index.php?pk=244277&T=0

As an alternative you can also use a QR Code:  

The GUIDs for individual cells are displayed in the table below:

Summary of computational transaction
Raw Inputview raw input (R code)
Raw Outputview raw output of R engine
Computing time1 seconds
R Server'Sir Ronald Aylmer Fisher' @ fisher.wessa.net


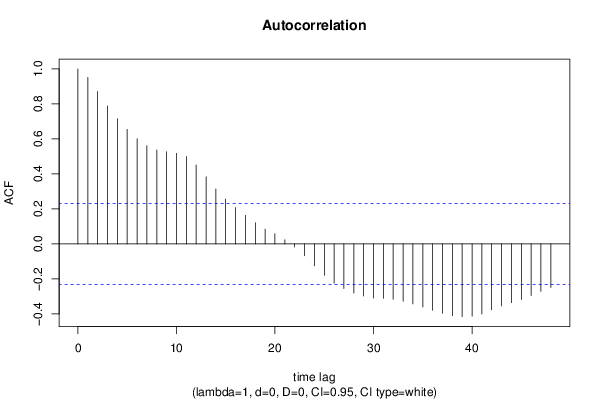
Autocorrelation Function
Time lag kACF(k)T-STATP-value
10.9509778.06930
20.8708857.38970
30.7878086.68480
40.7158316.0740
50.654835.55640
60.6007695.09771e-06
70.5605884.75675e-06
80.5365864.55311.1e-05
90.5265094.46761.4e-05
100.5174464.39071.9e-05
110.4991444.23543.3e-05
120.4507143.82440.000138
130.3830283.25010.000878
140.313762.66230.004783
150.256022.17240.016559
160.2080731.76560.040855
170.1630511.38350.085388
180.1210431.02710.153909
190.0843250.71550.2383
200.0578850.49120.312401
210.0240170.20380.419547
22-0.017776-0.15080.440262
23-0.067312-0.57120.284835
24-0.124793-1.05890.146592
25-0.179343-1.52180.066222
26-0.224115-1.90170.030607
27-0.254559-2.160.017051
28-0.281042-2.38470.009864
29-0.297928-2.5280.006833
30-0.309589-2.62690.00526
31-0.310942-2.63840.005101
32-0.316444-2.68510.004497
33-0.327582-2.77960.003469
34-0.342891-2.90950.002406
35-0.361173-3.06470.001533
36-0.379377-3.21910.000965
37-0.396596-3.36520.000615
38-0.409981-3.47880.000429
39-0.415843-3.52850.000366
40-0.412746-3.50230.000398
41-0.399972-3.39390.000562
42-0.376091-3.19120.00105
43-0.354369-3.00690.001816
44-0.335597-2.84760.002868
45-0.317336-2.69270.004405
46-0.295102-2.5040.007273
47-0.271603-2.30460.012037
48-0.24864-2.10980.019177

\begin{tabular}{lllllllll}
\hline
Autocorrelation Function \tabularnewline
Time lag k & ACF(k) & T-STAT & P-value \tabularnewline
1 & 0.950977 & 8.0693 & 0 \tabularnewline
2 & 0.870885 & 7.3897 & 0 \tabularnewline
3 & 0.787808 & 6.6848 & 0 \tabularnewline
4 & 0.715831 & 6.074 & 0 \tabularnewline
5 & 0.65483 & 5.5564 & 0 \tabularnewline
6 & 0.600769 & 5.0977 & 1e-06 \tabularnewline
7 & 0.560588 & 4.7567 & 5e-06 \tabularnewline
8 & 0.536586 & 4.5531 & 1.1e-05 \tabularnewline
9 & 0.526509 & 4.4676 & 1.4e-05 \tabularnewline
10 & 0.517446 & 4.3907 & 1.9e-05 \tabularnewline
11 & 0.499144 & 4.2354 & 3.3e-05 \tabularnewline
12 & 0.450714 & 3.8244 & 0.000138 \tabularnewline
13 & 0.383028 & 3.2501 & 0.000878 \tabularnewline
14 & 0.31376 & 2.6623 & 0.004783 \tabularnewline
15 & 0.25602 & 2.1724 & 0.016559 \tabularnewline
16 & 0.208073 & 1.7656 & 0.040855 \tabularnewline
17 & 0.163051 & 1.3835 & 0.085388 \tabularnewline
18 & 0.121043 & 1.0271 & 0.153909 \tabularnewline
19 & 0.084325 & 0.7155 & 0.2383 \tabularnewline
20 & 0.057885 & 0.4912 & 0.312401 \tabularnewline
21 & 0.024017 & 0.2038 & 0.419547 \tabularnewline
22 & -0.017776 & -0.1508 & 0.440262 \tabularnewline
23 & -0.067312 & -0.5712 & 0.284835 \tabularnewline
24 & -0.124793 & -1.0589 & 0.146592 \tabularnewline
25 & -0.179343 & -1.5218 & 0.066222 \tabularnewline
26 & -0.224115 & -1.9017 & 0.030607 \tabularnewline
27 & -0.254559 & -2.16 & 0.017051 \tabularnewline
28 & -0.281042 & -2.3847 & 0.009864 \tabularnewline
29 & -0.297928 & -2.528 & 0.006833 \tabularnewline
30 & -0.309589 & -2.6269 & 0.00526 \tabularnewline
31 & -0.310942 & -2.6384 & 0.005101 \tabularnewline
32 & -0.316444 & -2.6851 & 0.004497 \tabularnewline
33 & -0.327582 & -2.7796 & 0.003469 \tabularnewline
34 & -0.342891 & -2.9095 & 0.002406 \tabularnewline
35 & -0.361173 & -3.0647 & 0.001533 \tabularnewline
36 & -0.379377 & -3.2191 & 0.000965 \tabularnewline
37 & -0.396596 & -3.3652 & 0.000615 \tabularnewline
38 & -0.409981 & -3.4788 & 0.000429 \tabularnewline
39 & -0.415843 & -3.5285 & 0.000366 \tabularnewline
40 & -0.412746 & -3.5023 & 0.000398 \tabularnewline
41 & -0.399972 & -3.3939 & 0.000562 \tabularnewline
42 & -0.376091 & -3.1912 & 0.00105 \tabularnewline
43 & -0.354369 & -3.0069 & 0.001816 \tabularnewline
44 & -0.335597 & -2.8476 & 0.002868 \tabularnewline
45 & -0.317336 & -2.6927 & 0.004405 \tabularnewline
46 & -0.295102 & -2.504 & 0.007273 \tabularnewline
47 & -0.271603 & -2.3046 & 0.012037 \tabularnewline
48 & -0.24864 & -2.1098 & 0.019177 \tabularnewline
\hline
\end{tabular}
%Source: https://freestatistics.org/blog/index.php?pk=244277&T=1

[TABLE]
[ROW][C]Autocorrelation Function[/C][/ROW]
[ROW][C]Time lag k[/C][C]ACF(k)[/C][C]T-STAT[/C][C]P-value[/C][/ROW]
[ROW][C]1[/C][C]0.950977[/C][C]8.0693[/C][C]0[/C][/ROW]
[ROW][C]2[/C][C]0.870885[/C][C]7.3897[/C][C]0[/C][/ROW]
[ROW][C]3[/C][C]0.787808[/C][C]6.6848[/C][C]0[/C][/ROW]
[ROW][C]4[/C][C]0.715831[/C][C]6.074[/C][C]0[/C][/ROW]
[ROW][C]5[/C][C]0.65483[/C][C]5.5564[/C][C]0[/C][/ROW]
[ROW][C]6[/C][C]0.600769[/C][C]5.0977[/C][C]1e-06[/C][/ROW]
[ROW][C]7[/C][C]0.560588[/C][C]4.7567[/C][C]5e-06[/C][/ROW]
[ROW][C]8[/C][C]0.536586[/C][C]4.5531[/C][C]1.1e-05[/C][/ROW]
[ROW][C]9[/C][C]0.526509[/C][C]4.4676[/C][C]1.4e-05[/C][/ROW]
[ROW][C]10[/C][C]0.517446[/C][C]4.3907[/C][C]1.9e-05[/C][/ROW]
[ROW][C]11[/C][C]0.499144[/C][C]4.2354[/C][C]3.3e-05[/C][/ROW]
[ROW][C]12[/C][C]0.450714[/C][C]3.8244[/C][C]0.000138[/C][/ROW]
[ROW][C]13[/C][C]0.383028[/C][C]3.2501[/C][C]0.000878[/C][/ROW]
[ROW][C]14[/C][C]0.31376[/C][C]2.6623[/C][C]0.004783[/C][/ROW]
[ROW][C]15[/C][C]0.25602[/C][C]2.1724[/C][C]0.016559[/C][/ROW]
[ROW][C]16[/C][C]0.208073[/C][C]1.7656[/C][C]0.040855[/C][/ROW]
[ROW][C]17[/C][C]0.163051[/C][C]1.3835[/C][C]0.085388[/C][/ROW]
[ROW][C]18[/C][C]0.121043[/C][C]1.0271[/C][C]0.153909[/C][/ROW]
[ROW][C]19[/C][C]0.084325[/C][C]0.7155[/C][C]0.2383[/C][/ROW]
[ROW][C]20[/C][C]0.057885[/C][C]0.4912[/C][C]0.312401[/C][/ROW]
[ROW][C]21[/C][C]0.024017[/C][C]0.2038[/C][C]0.419547[/C][/ROW]
[ROW][C]22[/C][C]-0.017776[/C][C]-0.1508[/C][C]0.440262[/C][/ROW]
[ROW][C]23[/C][C]-0.067312[/C][C]-0.5712[/C][C]0.284835[/C][/ROW]
[ROW][C]24[/C][C]-0.124793[/C][C]-1.0589[/C][C]0.146592[/C][/ROW]
[ROW][C]25[/C][C]-0.179343[/C][C]-1.5218[/C][C]0.066222[/C][/ROW]
[ROW][C]26[/C][C]-0.224115[/C][C]-1.9017[/C][C]0.030607[/C][/ROW]
[ROW][C]27[/C][C]-0.254559[/C][C]-2.16[/C][C]0.017051[/C][/ROW]
[ROW][C]28[/C][C]-0.281042[/C][C]-2.3847[/C][C]0.009864[/C][/ROW]
[ROW][C]29[/C][C]-0.297928[/C][C]-2.528[/C][C]0.006833[/C][/ROW]
[ROW][C]30[/C][C]-0.309589[/C][C]-2.6269[/C][C]0.00526[/C][/ROW]
[ROW][C]31[/C][C]-0.310942[/C][C]-2.6384[/C][C]0.005101[/C][/ROW]
[ROW][C]32[/C][C]-0.316444[/C][C]-2.6851[/C][C]0.004497[/C][/ROW]
[ROW][C]33[/C][C]-0.327582[/C][C]-2.7796[/C][C]0.003469[/C][/ROW]
[ROW][C]34[/C][C]-0.342891[/C][C]-2.9095[/C][C]0.002406[/C][/ROW]
[ROW][C]35[/C][C]-0.361173[/C][C]-3.0647[/C][C]0.001533[/C][/ROW]
[ROW][C]36[/C][C]-0.379377[/C][C]-3.2191[/C][C]0.000965[/C][/ROW]
[ROW][C]37[/C][C]-0.396596[/C][C]-3.3652[/C][C]0.000615[/C][/ROW]
[ROW][C]38[/C][C]-0.409981[/C][C]-3.4788[/C][C]0.000429[/C][/ROW]
[ROW][C]39[/C][C]-0.415843[/C][C]-3.5285[/C][C]0.000366[/C][/ROW]
[ROW][C]40[/C][C]-0.412746[/C][C]-3.5023[/C][C]0.000398[/C][/ROW]
[ROW][C]41[/C][C]-0.399972[/C][C]-3.3939[/C][C]0.000562[/C][/ROW]
[ROW][C]42[/C][C]-0.376091[/C][C]-3.1912[/C][C]0.00105[/C][/ROW]
[ROW][C]43[/C][C]-0.354369[/C][C]-3.0069[/C][C]0.001816[/C][/ROW]
[ROW][C]44[/C][C]-0.335597[/C][C]-2.8476[/C][C]0.002868[/C][/ROW]
[ROW][C]45[/C][C]-0.317336[/C][C]-2.6927[/C][C]0.004405[/C][/ROW]
[ROW][C]46[/C][C]-0.295102[/C][C]-2.504[/C][C]0.007273[/C][/ROW]
[ROW][C]47[/C][C]-0.271603[/C][C]-2.3046[/C][C]0.012037[/C][/ROW]
[ROW][C]48[/C][C]-0.24864[/C][C]-2.1098[/C][C]0.019177[/C][/ROW]
[/TABLE]
Source: https://freestatistics.org/blog/index.php?pk=244277&T=1

Globally Unique Identifier (entire table): ba.freestatistics.org/blog/index.php?pk=244277&T=1

As an alternative you can also use a QR Code:  

The GUIDs for individual cells are displayed in the table below:

Autocorrelation Function
Time lag kACF(k)T-STATP-value
10.9509778.06930
20.8708857.38970
30.7878086.68480
40.7158316.0740
50.654835.55640
60.6007695.09771e-06
70.5605884.75675e-06
80.5365864.55311.1e-05
90.5265094.46761.4e-05
100.5174464.39071.9e-05
110.4991444.23543.3e-05
120.4507143.82440.000138
130.3830283.25010.000878
140.313762.66230.004783
150.256022.17240.016559
160.2080731.76560.040855
170.1630511.38350.085388
180.1210431.02710.153909
190.0843250.71550.2383
200.0578850.49120.312401
210.0240170.20380.419547
22-0.017776-0.15080.440262
23-0.067312-0.57120.284835
24-0.124793-1.05890.146592
25-0.179343-1.52180.066222
26-0.224115-1.90170.030607
27-0.254559-2.160.017051
28-0.281042-2.38470.009864
29-0.297928-2.5280.006833
30-0.309589-2.62690.00526
31-0.310942-2.63840.005101
32-0.316444-2.68510.004497
33-0.327582-2.77960.003469
34-0.342891-2.90950.002406
35-0.361173-3.06470.001533
36-0.379377-3.21910.000965
37-0.396596-3.36520.000615
38-0.409981-3.47880.000429
39-0.415843-3.52850.000366
40-0.412746-3.50230.000398
41-0.399972-3.39390.000562
42-0.376091-3.19120.00105
43-0.354369-3.00690.001816
44-0.335597-2.84760.002868
45-0.317336-2.69270.004405
46-0.295102-2.5040.007273
47-0.271603-2.30460.012037
48-0.24864-2.10980.019177


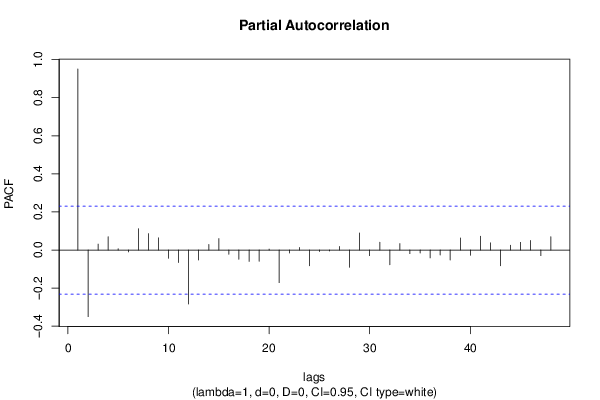
Partial Autocorrelation Function
Time lag kPACF(k)T-STATP-value
10.9509778.06930
2-0.349975-2.96960.002024
30.0308440.26170.397142
40.0701590.59530.276748
50.0067930.05760.477096
6-0.009896-0.0840.466655
70.1119110.94960.172747
80.0861620.73110.233544
90.0639210.54240.294614
10-0.043424-0.36850.356805
11-0.065687-0.55740.289499
12-0.283299-2.40390.009399
13-0.052302-0.44380.32926
140.0288480.24480.40366
150.0599420.50860.306285
16-0.022311-0.18930.425189
17-0.048645-0.41280.340502
18-0.059664-0.50630.30711
19-0.058662-0.49780.310084
200.0048440.04110.483663
21-0.171346-1.45390.075157
22-0.01537-0.13040.448298
230.0131780.11180.455639
24-0.082481-0.69990.243132
25-0.007901-0.0670.473368
26-0.004871-0.04130.483572
270.0184530.15660.438008
28-0.090893-0.77130.22154
290.0890320.75550.226219
30-0.029377-0.24930.40193
310.0408580.34670.364917
32-0.077216-0.65520.257212
330.0337060.2860.387847
34-0.019033-0.16150.436075
35-0.015636-0.13270.447408
36-0.041429-0.35150.363106
37-0.026365-0.22370.411807
38-0.052644-0.44670.328217
390.062990.53450.297325
40-0.027718-0.23520.407361
410.0720740.61160.271374
420.0375940.3190.375325
43-0.082468-0.69980.243165
440.0254190.21570.41492
450.0401760.34090.367084
460.0500380.42460.336202
47-0.029574-0.25090.401285
480.0699640.59370.277298

\begin{tabular}{lllllllll}
\hline
Partial Autocorrelation Function \tabularnewline
Time lag k & PACF(k) & T-STAT & P-value \tabularnewline
1 & 0.950977 & 8.0693 & 0 \tabularnewline
2 & -0.349975 & -2.9696 & 0.002024 \tabularnewline
3 & 0.030844 & 0.2617 & 0.397142 \tabularnewline
4 & 0.070159 & 0.5953 & 0.276748 \tabularnewline
5 & 0.006793 & 0.0576 & 0.477096 \tabularnewline
6 & -0.009896 & -0.084 & 0.466655 \tabularnewline
7 & 0.111911 & 0.9496 & 0.172747 \tabularnewline
8 & 0.086162 & 0.7311 & 0.233544 \tabularnewline
9 & 0.063921 & 0.5424 & 0.294614 \tabularnewline
10 & -0.043424 & -0.3685 & 0.356805 \tabularnewline
11 & -0.065687 & -0.5574 & 0.289499 \tabularnewline
12 & -0.283299 & -2.4039 & 0.009399 \tabularnewline
13 & -0.052302 & -0.4438 & 0.32926 \tabularnewline
14 & 0.028848 & 0.2448 & 0.40366 \tabularnewline
15 & 0.059942 & 0.5086 & 0.306285 \tabularnewline
16 & -0.022311 & -0.1893 & 0.425189 \tabularnewline
17 & -0.048645 & -0.4128 & 0.340502 \tabularnewline
18 & -0.059664 & -0.5063 & 0.30711 \tabularnewline
19 & -0.058662 & -0.4978 & 0.310084 \tabularnewline
20 & 0.004844 & 0.0411 & 0.483663 \tabularnewline
21 & -0.171346 & -1.4539 & 0.075157 \tabularnewline
22 & -0.01537 & -0.1304 & 0.448298 \tabularnewline
23 & 0.013178 & 0.1118 & 0.455639 \tabularnewline
24 & -0.082481 & -0.6999 & 0.243132 \tabularnewline
25 & -0.007901 & -0.067 & 0.473368 \tabularnewline
26 & -0.004871 & -0.0413 & 0.483572 \tabularnewline
27 & 0.018453 & 0.1566 & 0.438008 \tabularnewline
28 & -0.090893 & -0.7713 & 0.22154 \tabularnewline
29 & 0.089032 & 0.7555 & 0.226219 \tabularnewline
30 & -0.029377 & -0.2493 & 0.40193 \tabularnewline
31 & 0.040858 & 0.3467 & 0.364917 \tabularnewline
32 & -0.077216 & -0.6552 & 0.257212 \tabularnewline
33 & 0.033706 & 0.286 & 0.387847 \tabularnewline
34 & -0.019033 & -0.1615 & 0.436075 \tabularnewline
35 & -0.015636 & -0.1327 & 0.447408 \tabularnewline
36 & -0.041429 & -0.3515 & 0.363106 \tabularnewline
37 & -0.026365 & -0.2237 & 0.411807 \tabularnewline
38 & -0.052644 & -0.4467 & 0.328217 \tabularnewline
39 & 0.06299 & 0.5345 & 0.297325 \tabularnewline
40 & -0.027718 & -0.2352 & 0.407361 \tabularnewline
41 & 0.072074 & 0.6116 & 0.271374 \tabularnewline
42 & 0.037594 & 0.319 & 0.375325 \tabularnewline
43 & -0.082468 & -0.6998 & 0.243165 \tabularnewline
44 & 0.025419 & 0.2157 & 0.41492 \tabularnewline
45 & 0.040176 & 0.3409 & 0.367084 \tabularnewline
46 & 0.050038 & 0.4246 & 0.336202 \tabularnewline
47 & -0.029574 & -0.2509 & 0.401285 \tabularnewline
48 & 0.069964 & 0.5937 & 0.277298 \tabularnewline
\hline
\end{tabular}
%Source: https://freestatistics.org/blog/index.php?pk=244277&T=2

[TABLE]
[ROW][C]Partial Autocorrelation Function[/C][/ROW]
[ROW][C]Time lag k[/C][C]PACF(k)[/C][C]T-STAT[/C][C]P-value[/C][/ROW]
[ROW][C]1[/C][C]0.950977[/C][C]8.0693[/C][C]0[/C][/ROW]
[ROW][C]2[/C][C]-0.349975[/C][C]-2.9696[/C][C]0.002024[/C][/ROW]
[ROW][C]3[/C][C]0.030844[/C][C]0.2617[/C][C]0.397142[/C][/ROW]
[ROW][C]4[/C][C]0.070159[/C][C]0.5953[/C][C]0.276748[/C][/ROW]
[ROW][C]5[/C][C]0.006793[/C][C]0.0576[/C][C]0.477096[/C][/ROW]
[ROW][C]6[/C][C]-0.009896[/C][C]-0.084[/C][C]0.466655[/C][/ROW]
[ROW][C]7[/C][C]0.111911[/C][C]0.9496[/C][C]0.172747[/C][/ROW]
[ROW][C]8[/C][C]0.086162[/C][C]0.7311[/C][C]0.233544[/C][/ROW]
[ROW][C]9[/C][C]0.063921[/C][C]0.5424[/C][C]0.294614[/C][/ROW]
[ROW][C]10[/C][C]-0.043424[/C][C]-0.3685[/C][C]0.356805[/C][/ROW]
[ROW][C]11[/C][C]-0.065687[/C][C]-0.5574[/C][C]0.289499[/C][/ROW]
[ROW][C]12[/C][C]-0.283299[/C][C]-2.4039[/C][C]0.009399[/C][/ROW]
[ROW][C]13[/C][C]-0.052302[/C][C]-0.4438[/C][C]0.32926[/C][/ROW]
[ROW][C]14[/C][C]0.028848[/C][C]0.2448[/C][C]0.40366[/C][/ROW]
[ROW][C]15[/C][C]0.059942[/C][C]0.5086[/C][C]0.306285[/C][/ROW]
[ROW][C]16[/C][C]-0.022311[/C][C]-0.1893[/C][C]0.425189[/C][/ROW]
[ROW][C]17[/C][C]-0.048645[/C][C]-0.4128[/C][C]0.340502[/C][/ROW]
[ROW][C]18[/C][C]-0.059664[/C][C]-0.5063[/C][C]0.30711[/C][/ROW]
[ROW][C]19[/C][C]-0.058662[/C][C]-0.4978[/C][C]0.310084[/C][/ROW]
[ROW][C]20[/C][C]0.004844[/C][C]0.0411[/C][C]0.483663[/C][/ROW]
[ROW][C]21[/C][C]-0.171346[/C][C]-1.4539[/C][C]0.075157[/C][/ROW]
[ROW][C]22[/C][C]-0.01537[/C][C]-0.1304[/C][C]0.448298[/C][/ROW]
[ROW][C]23[/C][C]0.013178[/C][C]0.1118[/C][C]0.455639[/C][/ROW]
[ROW][C]24[/C][C]-0.082481[/C][C]-0.6999[/C][C]0.243132[/C][/ROW]
[ROW][C]25[/C][C]-0.007901[/C][C]-0.067[/C][C]0.473368[/C][/ROW]
[ROW][C]26[/C][C]-0.004871[/C][C]-0.0413[/C][C]0.483572[/C][/ROW]
[ROW][C]27[/C][C]0.018453[/C][C]0.1566[/C][C]0.438008[/C][/ROW]
[ROW][C]28[/C][C]-0.090893[/C][C]-0.7713[/C][C]0.22154[/C][/ROW]
[ROW][C]29[/C][C]0.089032[/C][C]0.7555[/C][C]0.226219[/C][/ROW]
[ROW][C]30[/C][C]-0.029377[/C][C]-0.2493[/C][C]0.40193[/C][/ROW]
[ROW][C]31[/C][C]0.040858[/C][C]0.3467[/C][C]0.364917[/C][/ROW]
[ROW][C]32[/C][C]-0.077216[/C][C]-0.6552[/C][C]0.257212[/C][/ROW]
[ROW][C]33[/C][C]0.033706[/C][C]0.286[/C][C]0.387847[/C][/ROW]
[ROW][C]34[/C][C]-0.019033[/C][C]-0.1615[/C][C]0.436075[/C][/ROW]
[ROW][C]35[/C][C]-0.015636[/C][C]-0.1327[/C][C]0.447408[/C][/ROW]
[ROW][C]36[/C][C]-0.041429[/C][C]-0.3515[/C][C]0.363106[/C][/ROW]
[ROW][C]37[/C][C]-0.026365[/C][C]-0.2237[/C][C]0.411807[/C][/ROW]
[ROW][C]38[/C][C]-0.052644[/C][C]-0.4467[/C][C]0.328217[/C][/ROW]
[ROW][C]39[/C][C]0.06299[/C][C]0.5345[/C][C]0.297325[/C][/ROW]
[ROW][C]40[/C][C]-0.027718[/C][C]-0.2352[/C][C]0.407361[/C][/ROW]
[ROW][C]41[/C][C]0.072074[/C][C]0.6116[/C][C]0.271374[/C][/ROW]
[ROW][C]42[/C][C]0.037594[/C][C]0.319[/C][C]0.375325[/C][/ROW]
[ROW][C]43[/C][C]-0.082468[/C][C]-0.6998[/C][C]0.243165[/C][/ROW]
[ROW][C]44[/C][C]0.025419[/C][C]0.2157[/C][C]0.41492[/C][/ROW]
[ROW][C]45[/C][C]0.040176[/C][C]0.3409[/C][C]0.367084[/C][/ROW]
[ROW][C]46[/C][C]0.050038[/C][C]0.4246[/C][C]0.336202[/C][/ROW]
[ROW][C]47[/C][C]-0.029574[/C][C]-0.2509[/C][C]0.401285[/C][/ROW]
[ROW][C]48[/C][C]0.069964[/C][C]0.5937[/C][C]0.277298[/C][/ROW]
[/TABLE]
Source: https://freestatistics.org/blog/index.php?pk=244277&T=2

Globally Unique Identifier (entire table): ba.freestatistics.org/blog/index.php?pk=244277&T=2

As an alternative you can also use a QR Code:  

The GUIDs for individual cells are displayed in the table below:

Partial Autocorrelation Function
Time lag kPACF(k)T-STATP-value
10.9509778.06930
2-0.349975-2.96960.002024
30.0308440.26170.397142
40.0701590.59530.276748
50.0067930.05760.477096
6-0.009896-0.0840.466655
70.1119110.94960.172747
80.0861620.73110.233544
90.0639210.54240.294614
10-0.043424-0.36850.356805
11-0.065687-0.55740.289499
12-0.283299-2.40390.009399
13-0.052302-0.44380.32926
140.0288480.24480.40366
150.0599420.50860.306285
16-0.022311-0.18930.425189
17-0.048645-0.41280.340502
18-0.059664-0.50630.30711
19-0.058662-0.49780.310084
200.0048440.04110.483663
21-0.171346-1.45390.075157
22-0.01537-0.13040.448298
230.0131780.11180.455639
24-0.082481-0.69990.243132
25-0.007901-0.0670.473368
26-0.004871-0.04130.483572
270.0184530.15660.438008
28-0.090893-0.77130.22154
290.0890320.75550.226219
30-0.029377-0.24930.40193
310.0408580.34670.364917
32-0.077216-0.65520.257212
330.0337060.2860.387847
34-0.019033-0.16150.436075
35-0.015636-0.13270.447408
36-0.041429-0.35150.363106
37-0.026365-0.22370.411807
38-0.052644-0.44670.328217
390.062990.53450.297325
40-0.027718-0.23520.407361
410.0720740.61160.271374
420.0375940.3190.375325
43-0.082468-0.69980.243165
440.0254190.21570.41492
450.0401760.34090.367084
460.0500380.42460.336202
47-0.029574-0.25090.401285
480.0699640.59370.277298


Parameters (Session):
par1 = 48 ; par2 = 1 ; par3 = 0 ; par4 = 0 ; par5 = 12 ; par6 = White Noise ; par7 = 0.95 ;
Parameters (R input):
par1 = 48 ; par2 = 1 ; par3 = 0 ; par4 = 0 ; par5 = 12 ; par6 = White Noise ; par7 = 0.95 ; par8 = ;
R code (references can be found in the software module):
if (par1 == 'Default') {
par1 = 10*log10(length(x))
} else {
par1 <- as.numeric(par1)
}
par2 <- as.numeric(par2)
par3 <- as.numeric(par3)
par4 <- as.numeric(par4)
par5 <- as.numeric(par5)
if (par6 == 'White Noise') par6 <- 'white' else par6 <- 'ma'
par7 <- as.numeric(par7)
if (par8 != '') par8 <- as.numeric(par8)
ox <- x
if (par8 == '') {
if (par2 == 0) {
x <- log(x)
} else {
x <- (x ^ par2 - 1) / par2
}
} else {
x <- log(x,base=par8)
}
if (par3 > 0) x <- diff(x,lag=1,difference=par3)
if (par4 > 0) x <- diff(x,lag=par5,difference=par4)
bitmap(file='picts.png')
op <- par(mfrow=c(2,1))
plot(ox,type='l',main='Original Time Series',xlab='time',ylab='value')
if (par8=='') {
mytitle <- paste('Working Time Series (lambda=',par2,', d=',par3,', D=',par4,')',sep='')
mysub <- paste('(lambda=',par2,', d=',par3,', D=',par4,', CI=', par7, ', CI type=',par6,')',sep='')
} else {
mytitle <- paste('Working Time Series (base=',par8,', d=',par3,', D=',par4,')',sep='')
mysub <- paste('(base=',par8,', d=',par3,', D=',par4,', CI=', par7, ', CI type=',par6,')',sep='')
}
plot(x,type='l', main=mytitle,xlab='time',ylab='value')
par(op)
dev.off()
bitmap(file='pic1.png')
racf <- acf(x, par1, main='Autocorrelation', xlab='time lag', ylab='ACF', ci.type=par6, ci=par7, sub=mysub)
dev.off()
bitmap(file='pic2.png')
rpacf <- pacf(x,par1,main='Partial Autocorrelation',xlab='lags',ylab='PACF',sub=mysub)
dev.off()
(myacf <- c(racf$acf))
(mypacf <- c(rpacf$acf))
lengthx <- length(x)
sqrtn <- sqrt(lengthx)
load(file='createtable')
a<-table.start()
a<-table.row.start(a)
a<-table.element(a,'Autocorrelation Function',4,TRUE)
a<-table.row.end(a)
a<-table.row.start(a)
a<-table.element(a,'Time lag k',header=TRUE)
a<-table.element(a,hyperlink('basics.htm','ACF(k)','click here for more information about the Autocorrelation Function'),header=TRUE)
a<-table.element(a,'T-STAT',header=TRUE)
a<-table.element(a,'P-value',header=TRUE)
a<-table.row.end(a)
for (i in 2:(par1+1)) {
a<-table.row.start(a)
a<-table.element(a,i-1,header=TRUE)
a<-table.element(a,round(myacf[i],6))
mytstat <- myacf[i]*sqrtn
a<-table.element(a,round(mytstat,4))
a<-table.element(a,round(1-pt(abs(mytstat),lengthx),6))
a<-table.row.end(a)
}
a<-table.end(a)
table.save(a,file='mytable.tab')
a<-table.start()
a<-table.row.start(a)
a<-table.element(a,'Partial Autocorrelation Function',4,TRUE)
a<-table.row.end(a)
a<-table.row.start(a)
a<-table.element(a,'Time lag k',header=TRUE)
a<-table.element(a,hyperlink('basics.htm','PACF(k)','click here for more information about the Partial Autocorrelation Function'),header=TRUE)
a<-table.element(a,'T-STAT',header=TRUE)
a<-table.element(a,'P-value',header=TRUE)
a<-table.row.end(a)
for (i in 1:par1) {
a<-table.row.start(a)
a<-table.element(a,i,header=TRUE)
a<-table.element(a,round(mypacf[i],6))
mytstat <- mypacf[i]*sqrtn
a<-table.element(a,round(mytstat,4))
a<-table.element(a,round(1-pt(abs(mytstat),lengthx),6))
a<-table.row.end(a)
}
a<-table.end(a)
table.save(a,file='mytable1.tab')