Free Statistics
of Irreproducible Research!
Description of Statistical Computation | ||||||||||||||||||||||||||||||
|---|---|---|---|---|---|---|---|---|---|---|---|---|---|---|---|---|---|---|---|---|---|---|---|---|---|---|---|---|---|---|
| Author's title | ||||||||||||||||||||||||||||||
| Author | *The author of this computation has been verified* | |||||||||||||||||||||||||||||
| R Software Module | rwasp_Distributional Plots.wasp | |||||||||||||||||||||||||||||
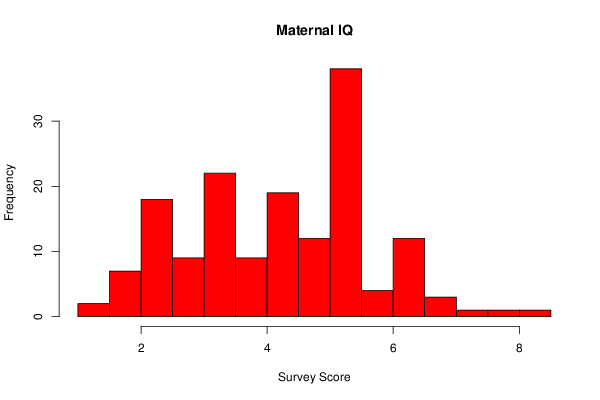
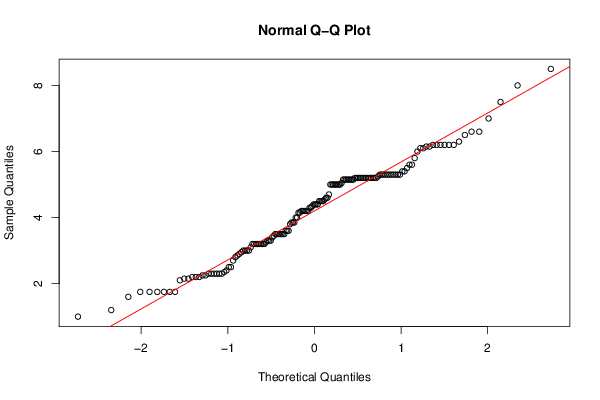
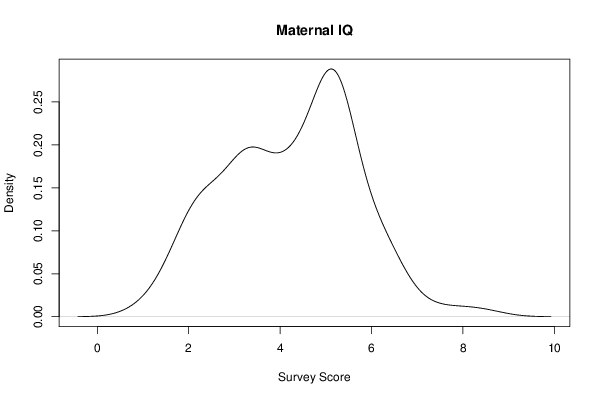
| Title produced by software | Histogram, QQplot and Density | |||||||||||||||||||||||||||||
| Date of computation | Mon, 20 Oct 2014 16:34:37 +0100 | |||||||||||||||||||||||||||||
| Cite this page as follows | Statistical Computations at FreeStatistics.org, Office for Research Development and Education, URL https://freestatistics.org/blog/index.php?v=date/2014/Oct/20/t1413819954i4u5skraevh1fne.htm/, Retrieved Sat, 11 May 2024 17:05:48 +0000 | |||||||||||||||||||||||||||||
| Statistical Computations at FreeStatistics.org, Office for Research Development and Education, URL https://freestatistics.org/blog/index.php?pk=244111, Retrieved Sat, 11 May 2024 17:05:48 +0000 | ||||||||||||||||||||||||||||||
| QR Codes: | ||||||||||||||||||||||||||||||
|
| ||||||||||||||||||||||||||||||
| Original text written by user: | ||||||||||||||||||||||||||||||
| IsPrivate? | No (this computation is public) | |||||||||||||||||||||||||||||
| User-defined keywords | ||||||||||||||||||||||||||||||
| Estimated Impact | 53 | |||||||||||||||||||||||||||||
Tree of Dependent Computations | ||||||||||||||||||||||||||||||
| Family? (F = Feedback message, R = changed R code, M = changed R Module, P = changed Parameters, D = changed Data) | ||||||||||||||||||||||||||||||
| - [Histogram, QQplot and Density] [Ian's Lunches 2013] [2014-10-17 16:57:14] [34296d8f7657c52ed60d5bff9133afec] - PD [Histogram, QQplot and Density] [historgram with 2...] [2014-10-20 15:34:37] [bb19d6e3e90acb3dc02677e1de219dc1] [Current] | ||||||||||||||||||||||||||||||
| Feedback Forum | ||||||||||||||||||||||||||||||
Post a new message | ||||||||||||||||||||||||||||||
Dataset | ||||||||||||||||||||||||||||||
| Dataseries X: | ||||||||||||||||||||||||||||||
2.10 3.30 5.05 6.30 6.15 1.75 3.00 3.30 6.60 5.60 5.50 3.45 2.40 4.60 3.20 2.30 3.30 1.75 3.20 3.60 5.20 3.00 3.50 5.20 6.20 5.60 4.60 2.25 2.25 4.30 4.55 4.20 4.30 5.25 3.20 3.50 1.75 5.20 4.50 6.20 3.85 2.35 5.20 3.50 6.20 3.20 3.10 5.20 5.20 5.20 6.20 3.20 6.10 3.50 4.20 3.20 1.20 3.20 5.20 7.00 6.20 3.00 1.75 2.30 1.75 3.85 5.00 3.25 5.30 6.50 8.00 1.75 2.80 3.20 4.00 3.50 6.00 4.40 8.50 6.10 2.70 6.60 3.60 3.50 3.60 2.30 5.20 5.20 4.00 5.15 5.20 4.40 5.15 5.00 6.20 2.50 4.35 4.15 5.20 1.60 5.20 2.90 2.30 5.00 2.30 4.20 2.15 2.30 5.15 4.15 4.20 5.15 5.15 2.15 2.95 3.80 4.40 5.15 4.50 4.50 4.20 3.85 4.50 6.15 1.00 3.50 2.85 4.70 5.15 2.20 5.15 3.00 7.50 5.00 2.20 5.20 4.20 5.30 5.30 5.30 5.30 5.30 5.30 5.30 5.30 5.30 5.30 5.00 5.00 2.50 4.40 3.40 2.20 5.40 5.40 5.80 5.00 5.00 | ||||||||||||||||||||||||||||||
Tables (Output of Computation) | ||||||||||||||||||||||||||||||
| ||||||||||||||||||||||||||||||
Figures (Output of Computation) | ||||||||||||||||||||||||||||||
Input Parameters & R Code | ||||||||||||||||||||||||||||||
| Parameters (Session): | ||||||||||||||||||||||||||||||
| par1 = 24 ; | ||||||||||||||||||||||||||||||
| Parameters (R input): | ||||||||||||||||||||||||||||||
| par1 = 24 ; | ||||||||||||||||||||||||||||||
| R code (references can be found in the software module): | ||||||||||||||||||||||||||||||
x <- x[!is.na(x)] | ||||||||||||||||||||||||||||||