Free Statistics

of Irreproducible Research!

Author's title

Author*Unverified author*
R Software Modulerwasp_autocorrelation.wasp
Title produced by software(Partial) Autocorrelation Function
Date of computationMon, 20 Oct 2014 16:06:43 +0100
Cite this page as followsStatistical Computations at FreeStatistics.org, Office for Research Development and Education, URL https://freestatistics.org/blog/index.php?v=date/2014/Oct/20/t1413817633yapbzwllk75rl1t.htm/, Retrieved Sat, 11 May 2024 16:59:44 +0000
Statistical Computations at FreeStatistics.org, Office for Research Development and Education, URL https://freestatistics.org/blog/index.php?pk=244083, Retrieved Sat, 11 May 2024 16:59:44 +0000
QR Codes:

Original text written by user:
IsPrivate?No (this computation is public)
User-defined keywords
Estimated Impact59
Family? (F = Feedback message, R = changed R code, M = changed R Module, P = changed Parameters, D = changed Data)
-       [(Partial) Autocorrelation Function] [] [2014-10-20 15:06:43] [bdca4dcc63d0690a1e5c4820657ce42d] [Current]
Feedback Forum

Post a new message
Dataseries X:
55,7
59,2
59,8
61,6
65,8
64,2
67
62,8
65,5
75,2
80,9
83,2
83,7
86,4
85,9
80,4
81,8
87,5
83,7
87
99,7
101,4
101,9
115,7
123,2
136,9
146,8
149,6
146,5
157
147,9
133,6
128,7
100,8
91,8
89,3
96,7
91,6
93,3
93,3
101
100,4
86,9
83,9
80,3
87,7
92,7
95,5
92
87,4
86,8
83,7
85
81,7
90,9
101,5
113,8
120,1
122,1
132,5
140
149,4
144,3
154,4
151,4
145,5
136,8
146,6
145,1
133,6
131,4
127,5
130,1
131,1
132,3
128,6
125,1
128,7
156,1
163,2
159,8
157,4
156,2
152,5
149,4
145,9
144,8
135,9
137,6
136
117,7
111,5
107,8
107,3
102,6
101
98,3
102,7
110,8
112,8
113,4
104,3
93,8
90,5


Summary of computational transaction
Raw Inputview raw input (R code)
Raw Outputview raw output of R engine
Computing time1 seconds
R Server'Sir Ronald Aylmer Fisher' @ fisher.wessa.net

\begin{tabular}{lllllllll}
\hline
Summary of computational transaction \tabularnewline
Raw Input & view raw input (R code)  \tabularnewline
Raw Output & view raw output of R engine  \tabularnewline
Computing time & 1 seconds \tabularnewline
R Server & 'Sir Ronald Aylmer Fisher' @ fisher.wessa.net \tabularnewline
\hline
\end{tabular}
%Source: https://freestatistics.org/blog/index.php?pk=244083&T=0

[TABLE]
[ROW][C]Summary of computational transaction[/C][/ROW]
[ROW][C]Raw Input[/C][C]view raw input (R code) [/C][/ROW]
[ROW][C]Raw Output[/C][C]view raw output of R engine [/C][/ROW]
[ROW][C]Computing time[/C][C]1 seconds[/C][/ROW]
[ROW][C]R Server[/C][C]'Sir Ronald Aylmer Fisher' @ fisher.wessa.net[/C][/ROW]
[/TABLE]
Source: https://freestatistics.org/blog/index.php?pk=244083&T=0

Globally Unique Identifier (entire table): ba.freestatistics.org/blog/index.php?pk=244083&T=0

As an alternative you can also use a QR Code:  

The GUIDs for individual cells are displayed in the table below:

Summary of computational transaction
Raw Inputview raw input (R code)
Raw Outputview raw output of R engine
Computing time1 seconds
R Server'Sir Ronald Aylmer Fisher' @ fisher.wessa.net


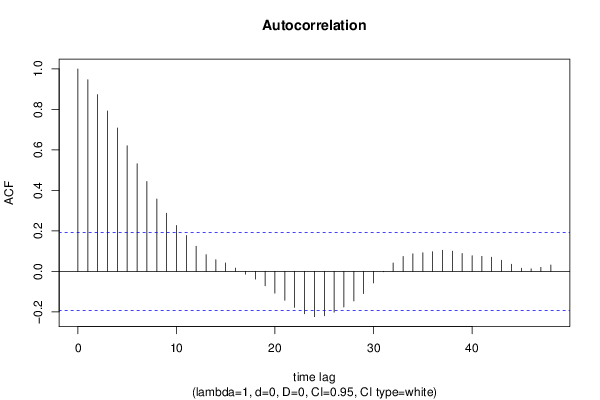
Autocorrelation Function
Time lag kACF(k)T-STATP-value
10.9465589.6530
20.8730258.90310
30.7922938.07980
40.7080297.22050
50.6203486.32630
60.531645.42170
70.4441284.52928e-06
80.3576043.64690.000208
90.2871632.92850.002093
100.226842.31330.011336
110.1772441.80750.036784
120.124011.26470.10441
130.0825250.84160.200973
140.057010.58140.281117
150.0410580.41870.338147
160.0159250.16240.435651
17-0.013615-0.13880.444919
18-0.038245-0.390.348659
19-0.071397-0.72810.234093
20-0.10753-1.09660.137676
21-0.142433-1.45250.074682
22-0.177841-1.81360.036309
23-0.209502-2.13650.017491
24-0.223775-2.28210.012261
25-0.219752-2.2410.013574
26-0.201328-2.05320.021284
27-0.175998-1.79480.037793
28-0.145964-1.48850.069817
29-0.109873-1.12050.132543
30-0.056975-0.5810.281237
31-0.002134-0.02180.49134
320.0409830.4180.338422
330.0734930.74950.227628
340.0866030.88320.189588
350.0922350.94060.174541
360.0969170.98840.162634
370.1040151.06080.14563
380.0998271.0180.15551
390.0886920.90450.183913
400.0773680.7890.215953
410.0740370.7550.225968
420.0693620.70740.240463
430.0551920.56280.287374
440.0351630.35860.360314
450.0155150.15820.437292
460.0123530.1260.449996
470.0195930.19980.421008
480.0317230.32350.373478

\begin{tabular}{lllllllll}
\hline
Autocorrelation Function \tabularnewline
Time lag k & ACF(k) & T-STAT & P-value \tabularnewline
1 & 0.946558 & 9.653 & 0 \tabularnewline
2 & 0.873025 & 8.9031 & 0 \tabularnewline
3 & 0.792293 & 8.0798 & 0 \tabularnewline
4 & 0.708029 & 7.2205 & 0 \tabularnewline
5 & 0.620348 & 6.3263 & 0 \tabularnewline
6 & 0.53164 & 5.4217 & 0 \tabularnewline
7 & 0.444128 & 4.5292 & 8e-06 \tabularnewline
8 & 0.357604 & 3.6469 & 0.000208 \tabularnewline
9 & 0.287163 & 2.9285 & 0.002093 \tabularnewline
10 & 0.22684 & 2.3133 & 0.011336 \tabularnewline
11 & 0.177244 & 1.8075 & 0.036784 \tabularnewline
12 & 0.12401 & 1.2647 & 0.10441 \tabularnewline
13 & 0.082525 & 0.8416 & 0.200973 \tabularnewline
14 & 0.05701 & 0.5814 & 0.281117 \tabularnewline
15 & 0.041058 & 0.4187 & 0.338147 \tabularnewline
16 & 0.015925 & 0.1624 & 0.435651 \tabularnewline
17 & -0.013615 & -0.1388 & 0.444919 \tabularnewline
18 & -0.038245 & -0.39 & 0.348659 \tabularnewline
19 & -0.071397 & -0.7281 & 0.234093 \tabularnewline
20 & -0.10753 & -1.0966 & 0.137676 \tabularnewline
21 & -0.142433 & -1.4525 & 0.074682 \tabularnewline
22 & -0.177841 & -1.8136 & 0.036309 \tabularnewline
23 & -0.209502 & -2.1365 & 0.017491 \tabularnewline
24 & -0.223775 & -2.2821 & 0.012261 \tabularnewline
25 & -0.219752 & -2.241 & 0.013574 \tabularnewline
26 & -0.201328 & -2.0532 & 0.021284 \tabularnewline
27 & -0.175998 & -1.7948 & 0.037793 \tabularnewline
28 & -0.145964 & -1.4885 & 0.069817 \tabularnewline
29 & -0.109873 & -1.1205 & 0.132543 \tabularnewline
30 & -0.056975 & -0.581 & 0.281237 \tabularnewline
31 & -0.002134 & -0.0218 & 0.49134 \tabularnewline
32 & 0.040983 & 0.418 & 0.338422 \tabularnewline
33 & 0.073493 & 0.7495 & 0.227628 \tabularnewline
34 & 0.086603 & 0.8832 & 0.189588 \tabularnewline
35 & 0.092235 & 0.9406 & 0.174541 \tabularnewline
36 & 0.096917 & 0.9884 & 0.162634 \tabularnewline
37 & 0.104015 & 1.0608 & 0.14563 \tabularnewline
38 & 0.099827 & 1.018 & 0.15551 \tabularnewline
39 & 0.088692 & 0.9045 & 0.183913 \tabularnewline
40 & 0.077368 & 0.789 & 0.215953 \tabularnewline
41 & 0.074037 & 0.755 & 0.225968 \tabularnewline
42 & 0.069362 & 0.7074 & 0.240463 \tabularnewline
43 & 0.055192 & 0.5628 & 0.287374 \tabularnewline
44 & 0.035163 & 0.3586 & 0.360314 \tabularnewline
45 & 0.015515 & 0.1582 & 0.437292 \tabularnewline
46 & 0.012353 & 0.126 & 0.449996 \tabularnewline
47 & 0.019593 & 0.1998 & 0.421008 \tabularnewline
48 & 0.031723 & 0.3235 & 0.373478 \tabularnewline
\hline
\end{tabular}
%Source: https://freestatistics.org/blog/index.php?pk=244083&T=1

[TABLE]
[ROW][C]Autocorrelation Function[/C][/ROW]
[ROW][C]Time lag k[/C][C]ACF(k)[/C][C]T-STAT[/C][C]P-value[/C][/ROW]
[ROW][C]1[/C][C]0.946558[/C][C]9.653[/C][C]0[/C][/ROW]
[ROW][C]2[/C][C]0.873025[/C][C]8.9031[/C][C]0[/C][/ROW]
[ROW][C]3[/C][C]0.792293[/C][C]8.0798[/C][C]0[/C][/ROW]
[ROW][C]4[/C][C]0.708029[/C][C]7.2205[/C][C]0[/C][/ROW]
[ROW][C]5[/C][C]0.620348[/C][C]6.3263[/C][C]0[/C][/ROW]
[ROW][C]6[/C][C]0.53164[/C][C]5.4217[/C][C]0[/C][/ROW]
[ROW][C]7[/C][C]0.444128[/C][C]4.5292[/C][C]8e-06[/C][/ROW]
[ROW][C]8[/C][C]0.357604[/C][C]3.6469[/C][C]0.000208[/C][/ROW]
[ROW][C]9[/C][C]0.287163[/C][C]2.9285[/C][C]0.002093[/C][/ROW]
[ROW][C]10[/C][C]0.22684[/C][C]2.3133[/C][C]0.011336[/C][/ROW]
[ROW][C]11[/C][C]0.177244[/C][C]1.8075[/C][C]0.036784[/C][/ROW]
[ROW][C]12[/C][C]0.12401[/C][C]1.2647[/C][C]0.10441[/C][/ROW]
[ROW][C]13[/C][C]0.082525[/C][C]0.8416[/C][C]0.200973[/C][/ROW]
[ROW][C]14[/C][C]0.05701[/C][C]0.5814[/C][C]0.281117[/C][/ROW]
[ROW][C]15[/C][C]0.041058[/C][C]0.4187[/C][C]0.338147[/C][/ROW]
[ROW][C]16[/C][C]0.015925[/C][C]0.1624[/C][C]0.435651[/C][/ROW]
[ROW][C]17[/C][C]-0.013615[/C][C]-0.1388[/C][C]0.444919[/C][/ROW]
[ROW][C]18[/C][C]-0.038245[/C][C]-0.39[/C][C]0.348659[/C][/ROW]
[ROW][C]19[/C][C]-0.071397[/C][C]-0.7281[/C][C]0.234093[/C][/ROW]
[ROW][C]20[/C][C]-0.10753[/C][C]-1.0966[/C][C]0.137676[/C][/ROW]
[ROW][C]21[/C][C]-0.142433[/C][C]-1.4525[/C][C]0.074682[/C][/ROW]
[ROW][C]22[/C][C]-0.177841[/C][C]-1.8136[/C][C]0.036309[/C][/ROW]
[ROW][C]23[/C][C]-0.209502[/C][C]-2.1365[/C][C]0.017491[/C][/ROW]
[ROW][C]24[/C][C]-0.223775[/C][C]-2.2821[/C][C]0.012261[/C][/ROW]
[ROW][C]25[/C][C]-0.219752[/C][C]-2.241[/C][C]0.013574[/C][/ROW]
[ROW][C]26[/C][C]-0.201328[/C][C]-2.0532[/C][C]0.021284[/C][/ROW]
[ROW][C]27[/C][C]-0.175998[/C][C]-1.7948[/C][C]0.037793[/C][/ROW]
[ROW][C]28[/C][C]-0.145964[/C][C]-1.4885[/C][C]0.069817[/C][/ROW]
[ROW][C]29[/C][C]-0.109873[/C][C]-1.1205[/C][C]0.132543[/C][/ROW]
[ROW][C]30[/C][C]-0.056975[/C][C]-0.581[/C][C]0.281237[/C][/ROW]
[ROW][C]31[/C][C]-0.002134[/C][C]-0.0218[/C][C]0.49134[/C][/ROW]
[ROW][C]32[/C][C]0.040983[/C][C]0.418[/C][C]0.338422[/C][/ROW]
[ROW][C]33[/C][C]0.073493[/C][C]0.7495[/C][C]0.227628[/C][/ROW]
[ROW][C]34[/C][C]0.086603[/C][C]0.8832[/C][C]0.189588[/C][/ROW]
[ROW][C]35[/C][C]0.092235[/C][C]0.9406[/C][C]0.174541[/C][/ROW]
[ROW][C]36[/C][C]0.096917[/C][C]0.9884[/C][C]0.162634[/C][/ROW]
[ROW][C]37[/C][C]0.104015[/C][C]1.0608[/C][C]0.14563[/C][/ROW]
[ROW][C]38[/C][C]0.099827[/C][C]1.018[/C][C]0.15551[/C][/ROW]
[ROW][C]39[/C][C]0.088692[/C][C]0.9045[/C][C]0.183913[/C][/ROW]
[ROW][C]40[/C][C]0.077368[/C][C]0.789[/C][C]0.215953[/C][/ROW]
[ROW][C]41[/C][C]0.074037[/C][C]0.755[/C][C]0.225968[/C][/ROW]
[ROW][C]42[/C][C]0.069362[/C][C]0.7074[/C][C]0.240463[/C][/ROW]
[ROW][C]43[/C][C]0.055192[/C][C]0.5628[/C][C]0.287374[/C][/ROW]
[ROW][C]44[/C][C]0.035163[/C][C]0.3586[/C][C]0.360314[/C][/ROW]
[ROW][C]45[/C][C]0.015515[/C][C]0.1582[/C][C]0.437292[/C][/ROW]
[ROW][C]46[/C][C]0.012353[/C][C]0.126[/C][C]0.449996[/C][/ROW]
[ROW][C]47[/C][C]0.019593[/C][C]0.1998[/C][C]0.421008[/C][/ROW]
[ROW][C]48[/C][C]0.031723[/C][C]0.3235[/C][C]0.373478[/C][/ROW]
[/TABLE]
Source: https://freestatistics.org/blog/index.php?pk=244083&T=1

Globally Unique Identifier (entire table): ba.freestatistics.org/blog/index.php?pk=244083&T=1

As an alternative you can also use a QR Code:  

The GUIDs for individual cells are displayed in the table below:

Autocorrelation Function
Time lag kACF(k)T-STATP-value
10.9465589.6530
20.8730258.90310
30.7922938.07980
40.7080297.22050
50.6203486.32630
60.531645.42170
70.4441284.52928e-06
80.3576043.64690.000208
90.2871632.92850.002093
100.226842.31330.011336
110.1772441.80750.036784
120.124011.26470.10441
130.0825250.84160.200973
140.057010.58140.281117
150.0410580.41870.338147
160.0159250.16240.435651
17-0.013615-0.13880.444919
18-0.038245-0.390.348659
19-0.071397-0.72810.234093
20-0.10753-1.09660.137676
21-0.142433-1.45250.074682
22-0.177841-1.81360.036309
23-0.209502-2.13650.017491
24-0.223775-2.28210.012261
25-0.219752-2.2410.013574
26-0.201328-2.05320.021284
27-0.175998-1.79480.037793
28-0.145964-1.48850.069817
29-0.109873-1.12050.132543
30-0.056975-0.5810.281237
31-0.002134-0.02180.49134
320.0409830.4180.338422
330.0734930.74950.227628
340.0866030.88320.189588
350.0922350.94060.174541
360.0969170.98840.162634
370.1040151.06080.14563
380.0998271.0180.15551
390.0886920.90450.183913
400.0773680.7890.215953
410.0740370.7550.225968
420.0693620.70740.240463
430.0551920.56280.287374
440.0351630.35860.360314
450.0155150.15820.437292
460.0123530.1260.449996
470.0195930.19980.421008
480.0317230.32350.373478


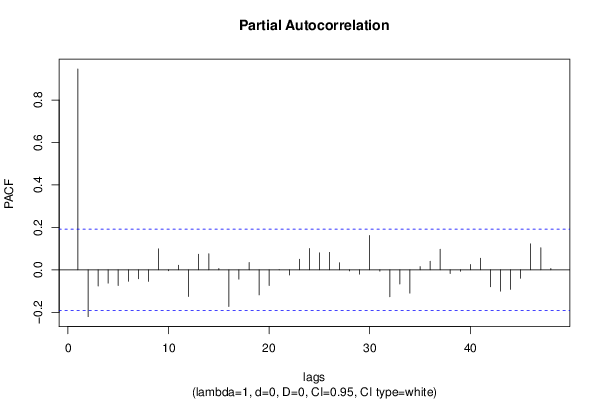
Partial Autocorrelation Function
Time lag kPACF(k)T-STATP-value
10.9465589.6530
2-0.220591-2.24960.013291
3-0.076432-0.77950.218741
4-0.062623-0.63860.262234
5-0.073714-0.75170.226953
6-0.053684-0.54750.292613
7-0.042109-0.42940.334251
8-0.054322-0.5540.290393
90.0989921.00950.157532
10-0.004538-0.04630.481589
110.0218740.22310.411959
12-0.125476-1.27960.101766
130.0736860.75140.22704
140.0759170.77420.220282
150.0065810.06710.473311
16-0.172495-1.75910.04075
17-0.043941-0.44810.327502
180.0344880.35170.362884
19-0.118186-1.20530.115417
20-0.074134-0.7560.225673
21-0.000101-0.0010.499591
22-0.024599-0.25090.401208
230.0501320.51120.305131
240.1007931.02790.153193
250.0798670.81450.208613
260.0823130.83940.201576
270.0331160.33770.368128
28-0.005085-0.05190.479371
29-0.020242-0.20640.418429
300.1617091.64910.051071
31-0.006063-0.06180.475406
32-0.126968-1.29480.099124
33-0.067065-0.68390.247769
34-0.109919-1.1210.132444
350.0151360.15440.438812
360.0405540.41360.340018
370.0967020.98620.163168
38-0.017063-0.1740.431099
39-0.006876-0.07010.472117
400.0255870.26090.397327
410.0545190.5560.289708
42-0.079592-0.81170.209413
43-0.100386-1.02370.154167
44-0.092163-0.93990.174729
45-0.039544-0.40330.343788
460.1224261.24850.107325
470.104221.06280.145159
480.006170.06290.474976

\begin{tabular}{lllllllll}
\hline
Partial Autocorrelation Function \tabularnewline
Time lag k & PACF(k) & T-STAT & P-value \tabularnewline
1 & 0.946558 & 9.653 & 0 \tabularnewline
2 & -0.220591 & -2.2496 & 0.013291 \tabularnewline
3 & -0.076432 & -0.7795 & 0.218741 \tabularnewline
4 & -0.062623 & -0.6386 & 0.262234 \tabularnewline
5 & -0.073714 & -0.7517 & 0.226953 \tabularnewline
6 & -0.053684 & -0.5475 & 0.292613 \tabularnewline
7 & -0.042109 & -0.4294 & 0.334251 \tabularnewline
8 & -0.054322 & -0.554 & 0.290393 \tabularnewline
9 & 0.098992 & 1.0095 & 0.157532 \tabularnewline
10 & -0.004538 & -0.0463 & 0.481589 \tabularnewline
11 & 0.021874 & 0.2231 & 0.411959 \tabularnewline
12 & -0.125476 & -1.2796 & 0.101766 \tabularnewline
13 & 0.073686 & 0.7514 & 0.22704 \tabularnewline
14 & 0.075917 & 0.7742 & 0.220282 \tabularnewline
15 & 0.006581 & 0.0671 & 0.473311 \tabularnewline
16 & -0.172495 & -1.7591 & 0.04075 \tabularnewline
17 & -0.043941 & -0.4481 & 0.327502 \tabularnewline
18 & 0.034488 & 0.3517 & 0.362884 \tabularnewline
19 & -0.118186 & -1.2053 & 0.115417 \tabularnewline
20 & -0.074134 & -0.756 & 0.225673 \tabularnewline
21 & -0.000101 & -0.001 & 0.499591 \tabularnewline
22 & -0.024599 & -0.2509 & 0.401208 \tabularnewline
23 & 0.050132 & 0.5112 & 0.305131 \tabularnewline
24 & 0.100793 & 1.0279 & 0.153193 \tabularnewline
25 & 0.079867 & 0.8145 & 0.208613 \tabularnewline
26 & 0.082313 & 0.8394 & 0.201576 \tabularnewline
27 & 0.033116 & 0.3377 & 0.368128 \tabularnewline
28 & -0.005085 & -0.0519 & 0.479371 \tabularnewline
29 & -0.020242 & -0.2064 & 0.418429 \tabularnewline
30 & 0.161709 & 1.6491 & 0.051071 \tabularnewline
31 & -0.006063 & -0.0618 & 0.475406 \tabularnewline
32 & -0.126968 & -1.2948 & 0.099124 \tabularnewline
33 & -0.067065 & -0.6839 & 0.247769 \tabularnewline
34 & -0.109919 & -1.121 & 0.132444 \tabularnewline
35 & 0.015136 & 0.1544 & 0.438812 \tabularnewline
36 & 0.040554 & 0.4136 & 0.340018 \tabularnewline
37 & 0.096702 & 0.9862 & 0.163168 \tabularnewline
38 & -0.017063 & -0.174 & 0.431099 \tabularnewline
39 & -0.006876 & -0.0701 & 0.472117 \tabularnewline
40 & 0.025587 & 0.2609 & 0.397327 \tabularnewline
41 & 0.054519 & 0.556 & 0.289708 \tabularnewline
42 & -0.079592 & -0.8117 & 0.209413 \tabularnewline
43 & -0.100386 & -1.0237 & 0.154167 \tabularnewline
44 & -0.092163 & -0.9399 & 0.174729 \tabularnewline
45 & -0.039544 & -0.4033 & 0.343788 \tabularnewline
46 & 0.122426 & 1.2485 & 0.107325 \tabularnewline
47 & 0.10422 & 1.0628 & 0.145159 \tabularnewline
48 & 0.00617 & 0.0629 & 0.474976 \tabularnewline
\hline
\end{tabular}
%Source: https://freestatistics.org/blog/index.php?pk=244083&T=2

[TABLE]
[ROW][C]Partial Autocorrelation Function[/C][/ROW]
[ROW][C]Time lag k[/C][C]PACF(k)[/C][C]T-STAT[/C][C]P-value[/C][/ROW]
[ROW][C]1[/C][C]0.946558[/C][C]9.653[/C][C]0[/C][/ROW]
[ROW][C]2[/C][C]-0.220591[/C][C]-2.2496[/C][C]0.013291[/C][/ROW]
[ROW][C]3[/C][C]-0.076432[/C][C]-0.7795[/C][C]0.218741[/C][/ROW]
[ROW][C]4[/C][C]-0.062623[/C][C]-0.6386[/C][C]0.262234[/C][/ROW]
[ROW][C]5[/C][C]-0.073714[/C][C]-0.7517[/C][C]0.226953[/C][/ROW]
[ROW][C]6[/C][C]-0.053684[/C][C]-0.5475[/C][C]0.292613[/C][/ROW]
[ROW][C]7[/C][C]-0.042109[/C][C]-0.4294[/C][C]0.334251[/C][/ROW]
[ROW][C]8[/C][C]-0.054322[/C][C]-0.554[/C][C]0.290393[/C][/ROW]
[ROW][C]9[/C][C]0.098992[/C][C]1.0095[/C][C]0.157532[/C][/ROW]
[ROW][C]10[/C][C]-0.004538[/C][C]-0.0463[/C][C]0.481589[/C][/ROW]
[ROW][C]11[/C][C]0.021874[/C][C]0.2231[/C][C]0.411959[/C][/ROW]
[ROW][C]12[/C][C]-0.125476[/C][C]-1.2796[/C][C]0.101766[/C][/ROW]
[ROW][C]13[/C][C]0.073686[/C][C]0.7514[/C][C]0.22704[/C][/ROW]
[ROW][C]14[/C][C]0.075917[/C][C]0.7742[/C][C]0.220282[/C][/ROW]
[ROW][C]15[/C][C]0.006581[/C][C]0.0671[/C][C]0.473311[/C][/ROW]
[ROW][C]16[/C][C]-0.172495[/C][C]-1.7591[/C][C]0.04075[/C][/ROW]
[ROW][C]17[/C][C]-0.043941[/C][C]-0.4481[/C][C]0.327502[/C][/ROW]
[ROW][C]18[/C][C]0.034488[/C][C]0.3517[/C][C]0.362884[/C][/ROW]
[ROW][C]19[/C][C]-0.118186[/C][C]-1.2053[/C][C]0.115417[/C][/ROW]
[ROW][C]20[/C][C]-0.074134[/C][C]-0.756[/C][C]0.225673[/C][/ROW]
[ROW][C]21[/C][C]-0.000101[/C][C]-0.001[/C][C]0.499591[/C][/ROW]
[ROW][C]22[/C][C]-0.024599[/C][C]-0.2509[/C][C]0.401208[/C][/ROW]
[ROW][C]23[/C][C]0.050132[/C][C]0.5112[/C][C]0.305131[/C][/ROW]
[ROW][C]24[/C][C]0.100793[/C][C]1.0279[/C][C]0.153193[/C][/ROW]
[ROW][C]25[/C][C]0.079867[/C][C]0.8145[/C][C]0.208613[/C][/ROW]
[ROW][C]26[/C][C]0.082313[/C][C]0.8394[/C][C]0.201576[/C][/ROW]
[ROW][C]27[/C][C]0.033116[/C][C]0.3377[/C][C]0.368128[/C][/ROW]
[ROW][C]28[/C][C]-0.005085[/C][C]-0.0519[/C][C]0.479371[/C][/ROW]
[ROW][C]29[/C][C]-0.020242[/C][C]-0.2064[/C][C]0.418429[/C][/ROW]
[ROW][C]30[/C][C]0.161709[/C][C]1.6491[/C][C]0.051071[/C][/ROW]
[ROW][C]31[/C][C]-0.006063[/C][C]-0.0618[/C][C]0.475406[/C][/ROW]
[ROW][C]32[/C][C]-0.126968[/C][C]-1.2948[/C][C]0.099124[/C][/ROW]
[ROW][C]33[/C][C]-0.067065[/C][C]-0.6839[/C][C]0.247769[/C][/ROW]
[ROW][C]34[/C][C]-0.109919[/C][C]-1.121[/C][C]0.132444[/C][/ROW]
[ROW][C]35[/C][C]0.015136[/C][C]0.1544[/C][C]0.438812[/C][/ROW]
[ROW][C]36[/C][C]0.040554[/C][C]0.4136[/C][C]0.340018[/C][/ROW]
[ROW][C]37[/C][C]0.096702[/C][C]0.9862[/C][C]0.163168[/C][/ROW]
[ROW][C]38[/C][C]-0.017063[/C][C]-0.174[/C][C]0.431099[/C][/ROW]
[ROW][C]39[/C][C]-0.006876[/C][C]-0.0701[/C][C]0.472117[/C][/ROW]
[ROW][C]40[/C][C]0.025587[/C][C]0.2609[/C][C]0.397327[/C][/ROW]
[ROW][C]41[/C][C]0.054519[/C][C]0.556[/C][C]0.289708[/C][/ROW]
[ROW][C]42[/C][C]-0.079592[/C][C]-0.8117[/C][C]0.209413[/C][/ROW]
[ROW][C]43[/C][C]-0.100386[/C][C]-1.0237[/C][C]0.154167[/C][/ROW]
[ROW][C]44[/C][C]-0.092163[/C][C]-0.9399[/C][C]0.174729[/C][/ROW]
[ROW][C]45[/C][C]-0.039544[/C][C]-0.4033[/C][C]0.343788[/C][/ROW]
[ROW][C]46[/C][C]0.122426[/C][C]1.2485[/C][C]0.107325[/C][/ROW]
[ROW][C]47[/C][C]0.10422[/C][C]1.0628[/C][C]0.145159[/C][/ROW]
[ROW][C]48[/C][C]0.00617[/C][C]0.0629[/C][C]0.474976[/C][/ROW]
[/TABLE]
Source: https://freestatistics.org/blog/index.php?pk=244083&T=2

Globally Unique Identifier (entire table): ba.freestatistics.org/blog/index.php?pk=244083&T=2

As an alternative you can also use a QR Code:  

The GUIDs for individual cells are displayed in the table below:

Partial Autocorrelation Function
Time lag kPACF(k)T-STATP-value
10.9465589.6530
2-0.220591-2.24960.013291
3-0.076432-0.77950.218741
4-0.062623-0.63860.262234
5-0.073714-0.75170.226953
6-0.053684-0.54750.292613
7-0.042109-0.42940.334251
8-0.054322-0.5540.290393
90.0989921.00950.157532
10-0.004538-0.04630.481589
110.0218740.22310.411959
12-0.125476-1.27960.101766
130.0736860.75140.22704
140.0759170.77420.220282
150.0065810.06710.473311
16-0.172495-1.75910.04075
17-0.043941-0.44810.327502
180.0344880.35170.362884
19-0.118186-1.20530.115417
20-0.074134-0.7560.225673
21-0.000101-0.0010.499591
22-0.024599-0.25090.401208
230.0501320.51120.305131
240.1007931.02790.153193
250.0798670.81450.208613
260.0823130.83940.201576
270.0331160.33770.368128
28-0.005085-0.05190.479371
29-0.020242-0.20640.418429
300.1617091.64910.051071
31-0.006063-0.06180.475406
32-0.126968-1.29480.099124
33-0.067065-0.68390.247769
34-0.109919-1.1210.132444
350.0151360.15440.438812
360.0405540.41360.340018
370.0967020.98620.163168
38-0.017063-0.1740.431099
39-0.006876-0.07010.472117
400.0255870.26090.397327
410.0545190.5560.289708
42-0.079592-0.81170.209413
43-0.100386-1.02370.154167
44-0.092163-0.93990.174729
45-0.039544-0.40330.343788
460.1224261.24850.107325
470.104221.06280.145159
480.006170.06290.474976


Parameters (Session):
par1 = 48 ; par2 = 1 ; par3 = 0 ; par4 = 0 ; par5 = 12 ; par6 = White Noise ; par7 = 0.95 ;
Parameters (R input):
par1 = 48 ; par2 = 1 ; par3 = 0 ; par4 = 0 ; par5 = 12 ; par6 = White Noise ; par7 = 0.95 ; par8 = ;
R code (references can be found in the software module):
if (par1 == 'Default') {
par1 = 10*log10(length(x))
} else {
par1 <- as.numeric(par1)
}
par2 <- as.numeric(par2)
par3 <- as.numeric(par3)
par4 <- as.numeric(par4)
par5 <- as.numeric(par5)
if (par6 == 'White Noise') par6 <- 'white' else par6 <- 'ma'
par7 <- as.numeric(par7)
if (par8 != '') par8 <- as.numeric(par8)
ox <- x
if (par8 == '') {
if (par2 == 0) {
x <- log(x)
} else {
x <- (x ^ par2 - 1) / par2
}
} else {
x <- log(x,base=par8)
}
if (par3 > 0) x <- diff(x,lag=1,difference=par3)
if (par4 > 0) x <- diff(x,lag=par5,difference=par4)
bitmap(file='picts.png')
op <- par(mfrow=c(2,1))
plot(ox,type='l',main='Original Time Series',xlab='time',ylab='value')
if (par8=='') {
mytitle <- paste('Working Time Series (lambda=',par2,', d=',par3,', D=',par4,')',sep='')
mysub <- paste('(lambda=',par2,', d=',par3,', D=',par4,', CI=', par7, ', CI type=',par6,')',sep='')
} else {
mytitle <- paste('Working Time Series (base=',par8,', d=',par3,', D=',par4,')',sep='')
mysub <- paste('(base=',par8,', d=',par3,', D=',par4,', CI=', par7, ', CI type=',par6,')',sep='')
}
plot(x,type='l', main=mytitle,xlab='time',ylab='value')
par(op)
dev.off()
bitmap(file='pic1.png')
racf <- acf(x, par1, main='Autocorrelation', xlab='time lag', ylab='ACF', ci.type=par6, ci=par7, sub=mysub)
dev.off()
bitmap(file='pic2.png')
rpacf <- pacf(x,par1,main='Partial Autocorrelation',xlab='lags',ylab='PACF',sub=mysub)
dev.off()
(myacf <- c(racf$acf))
(mypacf <- c(rpacf$acf))
lengthx <- length(x)
sqrtn <- sqrt(lengthx)
load(file='createtable')
a<-table.start()
a<-table.row.start(a)
a<-table.element(a,'Autocorrelation Function',4,TRUE)
a<-table.row.end(a)
a<-table.row.start(a)
a<-table.element(a,'Time lag k',header=TRUE)
a<-table.element(a,hyperlink('basics.htm','ACF(k)','click here for more information about the Autocorrelation Function'),header=TRUE)
a<-table.element(a,'T-STAT',header=TRUE)
a<-table.element(a,'P-value',header=TRUE)
a<-table.row.end(a)
for (i in 2:(par1+1)) {
a<-table.row.start(a)
a<-table.element(a,i-1,header=TRUE)
a<-table.element(a,round(myacf[i],6))
mytstat <- myacf[i]*sqrtn
a<-table.element(a,round(mytstat,4))
a<-table.element(a,round(1-pt(abs(mytstat),lengthx),6))
a<-table.row.end(a)
}
a<-table.end(a)
table.save(a,file='mytable.tab')
a<-table.start()
a<-table.row.start(a)
a<-table.element(a,'Partial Autocorrelation Function',4,TRUE)
a<-table.row.end(a)
a<-table.row.start(a)
a<-table.element(a,'Time lag k',header=TRUE)
a<-table.element(a,hyperlink('basics.htm','PACF(k)','click here for more information about the Partial Autocorrelation Function'),header=TRUE)
a<-table.element(a,'T-STAT',header=TRUE)
a<-table.element(a,'P-value',header=TRUE)
a<-table.row.end(a)
for (i in 1:par1) {
a<-table.row.start(a)
a<-table.element(a,i,header=TRUE)
a<-table.element(a,round(mypacf[i],6))
mytstat <- mypacf[i]*sqrtn
a<-table.element(a,round(mytstat,4))
a<-table.element(a,round(1-pt(abs(mytstat),lengthx),6))
a<-table.row.end(a)
}
a<-table.end(a)
table.save(a,file='mytable1.tab')