Free Statistics

of Irreproducible Research!

Author's title

Author*Unverified author*
R Software Modulerwasp_autocorrelation.wasp
Title produced by software(Partial) Autocorrelation Function
Date of computationMon, 20 Oct 2014 15:28:07 +0100
Cite this page as followsStatistical Computations at FreeStatistics.org, Office for Research Development and Education, URL https://freestatistics.org/blog/index.php?v=date/2014/Oct/20/t1413815413cugz3wi0393r5mc.htm/, Retrieved Sat, 11 May 2024 18:20:28 +0000
Statistical Computations at FreeStatistics.org, Office for Research Development and Education, URL https://freestatistics.org/blog/index.php?pk=244046, Retrieved Sat, 11 May 2024 18:20:28 +0000
QR Codes:

Original text written by user:
IsPrivate?No (this computation is public)
User-defined keywords
Estimated Impact62
Family? (F = Feedback message, R = changed R code, M = changed R Module, P = changed Parameters, D = changed Data)
-       [(Partial) Autocorrelation Function] [] [2014-10-20 14:28:07] [25af208440423f5cc2d7fa35cacd4ca5] [Current]
Feedback Forum

Post a new message
Dataseries X:
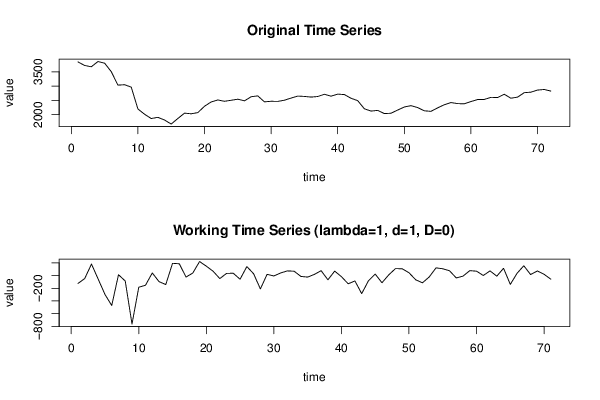
3844.49
3720.98
3674.4
3857.62
3801.06
3504.37
3032.6
3047.03
2962.34
2197.82
2014.45
1862.83
1905.41
1810.99
1670.07
1864.44
2052.02
2029.6
2070.83
2293.41
2443.27
2513.17
2466.92
2502.66
2539.91
2482.6
2626.15
2656.32
2446.66
2467.38
2462.32
2504.58
2579.39
2649.24
2636.87
2613.94
2634.01
2711.94
2646.43
2717.79
2701.54
2572.98
2488.92
2204.91
2123.99
2149.1
2036.71
2048.32
2159.56
2267.79
2313.55
2247.3
2134.43
2114
2236.94
2345.39
2422.4
2385.96
2378.17
2457.13
2527.67
2530.03
2604.92
2596.8
2713.2
2574.82
2611.98
2768.46
2785.61
2859.27
2880.53
2824.5


Summary of computational transaction
Raw Inputview raw input (R code)
Raw Outputview raw output of R engine
Computing time2 seconds
R Server'Herman Ole Andreas Wold' @ wold.wessa.net

\begin{tabular}{lllllllll}
\hline
Summary of computational transaction \tabularnewline
Raw Input & view raw input (R code)  \tabularnewline
Raw Output & view raw output of R engine  \tabularnewline
Computing time & 2 seconds \tabularnewline
R Server & 'Herman Ole Andreas Wold' @ wold.wessa.net \tabularnewline
\hline
\end{tabular}
%Source: https://freestatistics.org/blog/index.php?pk=244046&T=0

[TABLE]
[ROW][C]Summary of computational transaction[/C][/ROW]
[ROW][C]Raw Input[/C][C]view raw input (R code) [/C][/ROW]
[ROW][C]Raw Output[/C][C]view raw output of R engine [/C][/ROW]
[ROW][C]Computing time[/C][C]2 seconds[/C][/ROW]
[ROW][C]R Server[/C][C]'Herman Ole Andreas Wold' @ wold.wessa.net[/C][/ROW]
[/TABLE]
Source: https://freestatistics.org/blog/index.php?pk=244046&T=0

Globally Unique Identifier (entire table): ba.freestatistics.org/blog/index.php?pk=244046&T=0

As an alternative you can also use a QR Code:  

The GUIDs for individual cells are displayed in the table below:

Summary of computational transaction
Raw Inputview raw input (R code)
Raw Outputview raw output of R engine
Computing time2 seconds
R Server'Herman Ole Andreas Wold' @ wold.wessa.net


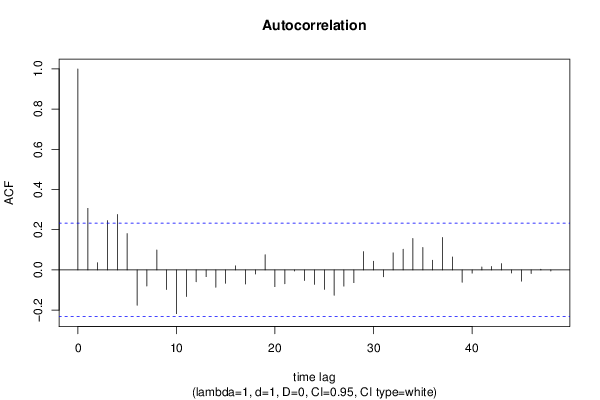
Autocorrelation Function
Time lag kACF(k)T-STATP-value
10.3062062.58010.005973
20.0354650.29880.382971
30.2452452.06650.021217
40.2754482.3210.011583
50.1805141.5210.066346
6-0.175568-1.47940.071734
7-0.079926-0.67350.251419
80.0993890.83750.20257
9-0.097192-0.8190.207776
10-0.21746-1.83230.035547
11-0.132024-1.11250.134848
12-0.059075-0.49780.310091
13-0.033603-0.28310.388946
14-0.08618-0.72620.235062
15-0.066299-0.55860.289082
160.0201090.16940.432964
17-0.069779-0.5880.27921
18-0.020598-0.17360.431351
190.0754740.6360.263425
20-0.083336-0.70220.242425
21-0.069245-0.58350.280714
22-0.005287-0.04460.482294
23-0.052594-0.44320.329496
24-0.072111-0.60760.272689
25-0.096772-0.81540.20878
26-0.126098-1.06250.145799
27-0.080751-0.68040.249225
28-0.063386-0.53410.297471
290.0909510.76640.222999
300.0430980.36320.358785
31-0.033922-0.28580.38792
320.0847120.71380.238847
330.1029120.86710.194391
340.1567531.32080.095401
350.1114370.9390.17546
360.0479690.40420.343643
370.1616751.36230.088706
380.0642340.54120.295018
39-0.061203-0.51570.30383
40-0.016146-0.1360.446085
410.0143210.12070.452147
420.0166140.140.444533
430.0313130.26380.396332
44-0.015835-0.13340.447118
45-0.05587-0.47080.319626
46-0.018116-0.15260.439556
470.0029840.02510.490006
48-0.005811-0.0490.480544

\begin{tabular}{lllllllll}
\hline
Autocorrelation Function \tabularnewline
Time lag k & ACF(k) & T-STAT & P-value \tabularnewline
1 & 0.306206 & 2.5801 & 0.005973 \tabularnewline
2 & 0.035465 & 0.2988 & 0.382971 \tabularnewline
3 & 0.245245 & 2.0665 & 0.021217 \tabularnewline
4 & 0.275448 & 2.321 & 0.011583 \tabularnewline
5 & 0.180514 & 1.521 & 0.066346 \tabularnewline
6 & -0.175568 & -1.4794 & 0.071734 \tabularnewline
7 & -0.079926 & -0.6735 & 0.251419 \tabularnewline
8 & 0.099389 & 0.8375 & 0.20257 \tabularnewline
9 & -0.097192 & -0.819 & 0.207776 \tabularnewline
10 & -0.21746 & -1.8323 & 0.035547 \tabularnewline
11 & -0.132024 & -1.1125 & 0.134848 \tabularnewline
12 & -0.059075 & -0.4978 & 0.310091 \tabularnewline
13 & -0.033603 & -0.2831 & 0.388946 \tabularnewline
14 & -0.08618 & -0.7262 & 0.235062 \tabularnewline
15 & -0.066299 & -0.5586 & 0.289082 \tabularnewline
16 & 0.020109 & 0.1694 & 0.432964 \tabularnewline
17 & -0.069779 & -0.588 & 0.27921 \tabularnewline
18 & -0.020598 & -0.1736 & 0.431351 \tabularnewline
19 & 0.075474 & 0.636 & 0.263425 \tabularnewline
20 & -0.083336 & -0.7022 & 0.242425 \tabularnewline
21 & -0.069245 & -0.5835 & 0.280714 \tabularnewline
22 & -0.005287 & -0.0446 & 0.482294 \tabularnewline
23 & -0.052594 & -0.4432 & 0.329496 \tabularnewline
24 & -0.072111 & -0.6076 & 0.272689 \tabularnewline
25 & -0.096772 & -0.8154 & 0.20878 \tabularnewline
26 & -0.126098 & -1.0625 & 0.145799 \tabularnewline
27 & -0.080751 & -0.6804 & 0.249225 \tabularnewline
28 & -0.063386 & -0.5341 & 0.297471 \tabularnewline
29 & 0.090951 & 0.7664 & 0.222999 \tabularnewline
30 & 0.043098 & 0.3632 & 0.358785 \tabularnewline
31 & -0.033922 & -0.2858 & 0.38792 \tabularnewline
32 & 0.084712 & 0.7138 & 0.238847 \tabularnewline
33 & 0.102912 & 0.8671 & 0.194391 \tabularnewline
34 & 0.156753 & 1.3208 & 0.095401 \tabularnewline
35 & 0.111437 & 0.939 & 0.17546 \tabularnewline
36 & 0.047969 & 0.4042 & 0.343643 \tabularnewline
37 & 0.161675 & 1.3623 & 0.088706 \tabularnewline
38 & 0.064234 & 0.5412 & 0.295018 \tabularnewline
39 & -0.061203 & -0.5157 & 0.30383 \tabularnewline
40 & -0.016146 & -0.136 & 0.446085 \tabularnewline
41 & 0.014321 & 0.1207 & 0.452147 \tabularnewline
42 & 0.016614 & 0.14 & 0.444533 \tabularnewline
43 & 0.031313 & 0.2638 & 0.396332 \tabularnewline
44 & -0.015835 & -0.1334 & 0.447118 \tabularnewline
45 & -0.05587 & -0.4708 & 0.319626 \tabularnewline
46 & -0.018116 & -0.1526 & 0.439556 \tabularnewline
47 & 0.002984 & 0.0251 & 0.490006 \tabularnewline
48 & -0.005811 & -0.049 & 0.480544 \tabularnewline
\hline
\end{tabular}
%Source: https://freestatistics.org/blog/index.php?pk=244046&T=1

[TABLE]
[ROW][C]Autocorrelation Function[/C][/ROW]
[ROW][C]Time lag k[/C][C]ACF(k)[/C][C]T-STAT[/C][C]P-value[/C][/ROW]
[ROW][C]1[/C][C]0.306206[/C][C]2.5801[/C][C]0.005973[/C][/ROW]
[ROW][C]2[/C][C]0.035465[/C][C]0.2988[/C][C]0.382971[/C][/ROW]
[ROW][C]3[/C][C]0.245245[/C][C]2.0665[/C][C]0.021217[/C][/ROW]
[ROW][C]4[/C][C]0.275448[/C][C]2.321[/C][C]0.011583[/C][/ROW]
[ROW][C]5[/C][C]0.180514[/C][C]1.521[/C][C]0.066346[/C][/ROW]
[ROW][C]6[/C][C]-0.175568[/C][C]-1.4794[/C][C]0.071734[/C][/ROW]
[ROW][C]7[/C][C]-0.079926[/C][C]-0.6735[/C][C]0.251419[/C][/ROW]
[ROW][C]8[/C][C]0.099389[/C][C]0.8375[/C][C]0.20257[/C][/ROW]
[ROW][C]9[/C][C]-0.097192[/C][C]-0.819[/C][C]0.207776[/C][/ROW]
[ROW][C]10[/C][C]-0.21746[/C][C]-1.8323[/C][C]0.035547[/C][/ROW]
[ROW][C]11[/C][C]-0.132024[/C][C]-1.1125[/C][C]0.134848[/C][/ROW]
[ROW][C]12[/C][C]-0.059075[/C][C]-0.4978[/C][C]0.310091[/C][/ROW]
[ROW][C]13[/C][C]-0.033603[/C][C]-0.2831[/C][C]0.388946[/C][/ROW]
[ROW][C]14[/C][C]-0.08618[/C][C]-0.7262[/C][C]0.235062[/C][/ROW]
[ROW][C]15[/C][C]-0.066299[/C][C]-0.5586[/C][C]0.289082[/C][/ROW]
[ROW][C]16[/C][C]0.020109[/C][C]0.1694[/C][C]0.432964[/C][/ROW]
[ROW][C]17[/C][C]-0.069779[/C][C]-0.588[/C][C]0.27921[/C][/ROW]
[ROW][C]18[/C][C]-0.020598[/C][C]-0.1736[/C][C]0.431351[/C][/ROW]
[ROW][C]19[/C][C]0.075474[/C][C]0.636[/C][C]0.263425[/C][/ROW]
[ROW][C]20[/C][C]-0.083336[/C][C]-0.7022[/C][C]0.242425[/C][/ROW]
[ROW][C]21[/C][C]-0.069245[/C][C]-0.5835[/C][C]0.280714[/C][/ROW]
[ROW][C]22[/C][C]-0.005287[/C][C]-0.0446[/C][C]0.482294[/C][/ROW]
[ROW][C]23[/C][C]-0.052594[/C][C]-0.4432[/C][C]0.329496[/C][/ROW]
[ROW][C]24[/C][C]-0.072111[/C][C]-0.6076[/C][C]0.272689[/C][/ROW]
[ROW][C]25[/C][C]-0.096772[/C][C]-0.8154[/C][C]0.20878[/C][/ROW]
[ROW][C]26[/C][C]-0.126098[/C][C]-1.0625[/C][C]0.145799[/C][/ROW]
[ROW][C]27[/C][C]-0.080751[/C][C]-0.6804[/C][C]0.249225[/C][/ROW]
[ROW][C]28[/C][C]-0.063386[/C][C]-0.5341[/C][C]0.297471[/C][/ROW]
[ROW][C]29[/C][C]0.090951[/C][C]0.7664[/C][C]0.222999[/C][/ROW]
[ROW][C]30[/C][C]0.043098[/C][C]0.3632[/C][C]0.358785[/C][/ROW]
[ROW][C]31[/C][C]-0.033922[/C][C]-0.2858[/C][C]0.38792[/C][/ROW]
[ROW][C]32[/C][C]0.084712[/C][C]0.7138[/C][C]0.238847[/C][/ROW]
[ROW][C]33[/C][C]0.102912[/C][C]0.8671[/C][C]0.194391[/C][/ROW]
[ROW][C]34[/C][C]0.156753[/C][C]1.3208[/C][C]0.095401[/C][/ROW]
[ROW][C]35[/C][C]0.111437[/C][C]0.939[/C][C]0.17546[/C][/ROW]
[ROW][C]36[/C][C]0.047969[/C][C]0.4042[/C][C]0.343643[/C][/ROW]
[ROW][C]37[/C][C]0.161675[/C][C]1.3623[/C][C]0.088706[/C][/ROW]
[ROW][C]38[/C][C]0.064234[/C][C]0.5412[/C][C]0.295018[/C][/ROW]
[ROW][C]39[/C][C]-0.061203[/C][C]-0.5157[/C][C]0.30383[/C][/ROW]
[ROW][C]40[/C][C]-0.016146[/C][C]-0.136[/C][C]0.446085[/C][/ROW]
[ROW][C]41[/C][C]0.014321[/C][C]0.1207[/C][C]0.452147[/C][/ROW]
[ROW][C]42[/C][C]0.016614[/C][C]0.14[/C][C]0.444533[/C][/ROW]
[ROW][C]43[/C][C]0.031313[/C][C]0.2638[/C][C]0.396332[/C][/ROW]
[ROW][C]44[/C][C]-0.015835[/C][C]-0.1334[/C][C]0.447118[/C][/ROW]
[ROW][C]45[/C][C]-0.05587[/C][C]-0.4708[/C][C]0.319626[/C][/ROW]
[ROW][C]46[/C][C]-0.018116[/C][C]-0.1526[/C][C]0.439556[/C][/ROW]
[ROW][C]47[/C][C]0.002984[/C][C]0.0251[/C][C]0.490006[/C][/ROW]
[ROW][C]48[/C][C]-0.005811[/C][C]-0.049[/C][C]0.480544[/C][/ROW]
[/TABLE]
Source: https://freestatistics.org/blog/index.php?pk=244046&T=1

Globally Unique Identifier (entire table): ba.freestatistics.org/blog/index.php?pk=244046&T=1

As an alternative you can also use a QR Code:  

The GUIDs for individual cells are displayed in the table below:

Autocorrelation Function
Time lag kACF(k)T-STATP-value
10.3062062.58010.005973
20.0354650.29880.382971
30.2452452.06650.021217
40.2754482.3210.011583
50.1805141.5210.066346
6-0.175568-1.47940.071734
7-0.079926-0.67350.251419
80.0993890.83750.20257
9-0.097192-0.8190.207776
10-0.21746-1.83230.035547
11-0.132024-1.11250.134848
12-0.059075-0.49780.310091
13-0.033603-0.28310.388946
14-0.08618-0.72620.235062
15-0.066299-0.55860.289082
160.0201090.16940.432964
17-0.069779-0.5880.27921
18-0.020598-0.17360.431351
190.0754740.6360.263425
20-0.083336-0.70220.242425
21-0.069245-0.58350.280714
22-0.005287-0.04460.482294
23-0.052594-0.44320.329496
24-0.072111-0.60760.272689
25-0.096772-0.81540.20878
26-0.126098-1.06250.145799
27-0.080751-0.68040.249225
28-0.063386-0.53410.297471
290.0909510.76640.222999
300.0430980.36320.358785
31-0.033922-0.28580.38792
320.0847120.71380.238847
330.1029120.86710.194391
340.1567531.32080.095401
350.1114370.9390.17546
360.0479690.40420.343643
370.1616751.36230.088706
380.0642340.54120.295018
39-0.061203-0.51570.30383
40-0.016146-0.1360.446085
410.0143210.12070.452147
420.0166140.140.444533
430.0313130.26380.396332
44-0.015835-0.13340.447118
45-0.05587-0.47080.319626
46-0.018116-0.15260.439556
470.0029840.02510.490006
48-0.005811-0.0490.480544


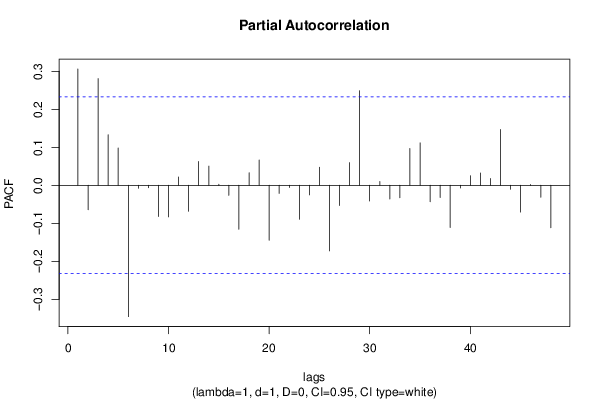
Partial Autocorrelation Function
Time lag kPACF(k)T-STATP-value
10.3062062.58010.005973
2-0.064329-0.5420.294741
30.2807622.36570.010364
40.1330941.12150.132933
50.0980930.82650.205632
6-0.34567-2.91270.002394
7-0.007608-0.06410.474533
8-0.006309-0.05320.478877
9-0.082078-0.69160.245722
10-0.083127-0.70040.242971
110.0218130.18380.427346
12-0.068153-0.57430.283802
130.0628990.530.298884
140.0504260.42490.336097
150.0030.02530.48995
16-0.026455-0.22290.41212
17-0.115872-0.97640.166103
180.033160.27940.39037
190.0666630.56170.288039
20-0.144636-1.21870.113492
21-0.021343-0.17980.428897
22-0.005975-0.05030.479994
23-0.089356-0.75290.226991
24-0.025216-0.21250.416174
250.0476670.40160.344575
26-0.172561-1.4540.075172
27-0.053118-0.44760.327909
280.0597570.50350.308078
290.2489832.0980.019734
30-0.041329-0.34820.364344
310.01010.08510.46621
32-0.036184-0.30490.38067
33-0.032803-0.27640.391519
340.0970310.81760.208161
350.1116860.94110.174928
36-0.043388-0.36560.357879
37-0.032302-0.27220.393137
38-0.110869-0.93420.176684
39-0.007047-0.05940.476407
400.025040.2110.416749
410.0324890.27380.392534
420.0179070.15090.440247
430.1467471.23650.110171
44-0.010227-0.08620.465786
45-0.070534-0.59430.277091
460.0022310.01880.492528
47-0.031513-0.26550.395685
48-0.111757-0.94170.174775

\begin{tabular}{lllllllll}
\hline
Partial Autocorrelation Function \tabularnewline
Time lag k & PACF(k) & T-STAT & P-value \tabularnewline
1 & 0.306206 & 2.5801 & 0.005973 \tabularnewline
2 & -0.064329 & -0.542 & 0.294741 \tabularnewline
3 & 0.280762 & 2.3657 & 0.010364 \tabularnewline
4 & 0.133094 & 1.1215 & 0.132933 \tabularnewline
5 & 0.098093 & 0.8265 & 0.205632 \tabularnewline
6 & -0.34567 & -2.9127 & 0.002394 \tabularnewline
7 & -0.007608 & -0.0641 & 0.474533 \tabularnewline
8 & -0.006309 & -0.0532 & 0.478877 \tabularnewline
9 & -0.082078 & -0.6916 & 0.245722 \tabularnewline
10 & -0.083127 & -0.7004 & 0.242971 \tabularnewline
11 & 0.021813 & 0.1838 & 0.427346 \tabularnewline
12 & -0.068153 & -0.5743 & 0.283802 \tabularnewline
13 & 0.062899 & 0.53 & 0.298884 \tabularnewline
14 & 0.050426 & 0.4249 & 0.336097 \tabularnewline
15 & 0.003 & 0.0253 & 0.48995 \tabularnewline
16 & -0.026455 & -0.2229 & 0.41212 \tabularnewline
17 & -0.115872 & -0.9764 & 0.166103 \tabularnewline
18 & 0.03316 & 0.2794 & 0.39037 \tabularnewline
19 & 0.066663 & 0.5617 & 0.288039 \tabularnewline
20 & -0.144636 & -1.2187 & 0.113492 \tabularnewline
21 & -0.021343 & -0.1798 & 0.428897 \tabularnewline
22 & -0.005975 & -0.0503 & 0.479994 \tabularnewline
23 & -0.089356 & -0.7529 & 0.226991 \tabularnewline
24 & -0.025216 & -0.2125 & 0.416174 \tabularnewline
25 & 0.047667 & 0.4016 & 0.344575 \tabularnewline
26 & -0.172561 & -1.454 & 0.075172 \tabularnewline
27 & -0.053118 & -0.4476 & 0.327909 \tabularnewline
28 & 0.059757 & 0.5035 & 0.308078 \tabularnewline
29 & 0.248983 & 2.098 & 0.019734 \tabularnewline
30 & -0.041329 & -0.3482 & 0.364344 \tabularnewline
31 & 0.0101 & 0.0851 & 0.46621 \tabularnewline
32 & -0.036184 & -0.3049 & 0.38067 \tabularnewline
33 & -0.032803 & -0.2764 & 0.391519 \tabularnewline
34 & 0.097031 & 0.8176 & 0.208161 \tabularnewline
35 & 0.111686 & 0.9411 & 0.174928 \tabularnewline
36 & -0.043388 & -0.3656 & 0.357879 \tabularnewline
37 & -0.032302 & -0.2722 & 0.393137 \tabularnewline
38 & -0.110869 & -0.9342 & 0.176684 \tabularnewline
39 & -0.007047 & -0.0594 & 0.476407 \tabularnewline
40 & 0.02504 & 0.211 & 0.416749 \tabularnewline
41 & 0.032489 & 0.2738 & 0.392534 \tabularnewline
42 & 0.017907 & 0.1509 & 0.440247 \tabularnewline
43 & 0.146747 & 1.2365 & 0.110171 \tabularnewline
44 & -0.010227 & -0.0862 & 0.465786 \tabularnewline
45 & -0.070534 & -0.5943 & 0.277091 \tabularnewline
46 & 0.002231 & 0.0188 & 0.492528 \tabularnewline
47 & -0.031513 & -0.2655 & 0.395685 \tabularnewline
48 & -0.111757 & -0.9417 & 0.174775 \tabularnewline
\hline
\end{tabular}
%Source: https://freestatistics.org/blog/index.php?pk=244046&T=2

[TABLE]
[ROW][C]Partial Autocorrelation Function[/C][/ROW]
[ROW][C]Time lag k[/C][C]PACF(k)[/C][C]T-STAT[/C][C]P-value[/C][/ROW]
[ROW][C]1[/C][C]0.306206[/C][C]2.5801[/C][C]0.005973[/C][/ROW]
[ROW][C]2[/C][C]-0.064329[/C][C]-0.542[/C][C]0.294741[/C][/ROW]
[ROW][C]3[/C][C]0.280762[/C][C]2.3657[/C][C]0.010364[/C][/ROW]
[ROW][C]4[/C][C]0.133094[/C][C]1.1215[/C][C]0.132933[/C][/ROW]
[ROW][C]5[/C][C]0.098093[/C][C]0.8265[/C][C]0.205632[/C][/ROW]
[ROW][C]6[/C][C]-0.34567[/C][C]-2.9127[/C][C]0.002394[/C][/ROW]
[ROW][C]7[/C][C]-0.007608[/C][C]-0.0641[/C][C]0.474533[/C][/ROW]
[ROW][C]8[/C][C]-0.006309[/C][C]-0.0532[/C][C]0.478877[/C][/ROW]
[ROW][C]9[/C][C]-0.082078[/C][C]-0.6916[/C][C]0.245722[/C][/ROW]
[ROW][C]10[/C][C]-0.083127[/C][C]-0.7004[/C][C]0.242971[/C][/ROW]
[ROW][C]11[/C][C]0.021813[/C][C]0.1838[/C][C]0.427346[/C][/ROW]
[ROW][C]12[/C][C]-0.068153[/C][C]-0.5743[/C][C]0.283802[/C][/ROW]
[ROW][C]13[/C][C]0.062899[/C][C]0.53[/C][C]0.298884[/C][/ROW]
[ROW][C]14[/C][C]0.050426[/C][C]0.4249[/C][C]0.336097[/C][/ROW]
[ROW][C]15[/C][C]0.003[/C][C]0.0253[/C][C]0.48995[/C][/ROW]
[ROW][C]16[/C][C]-0.026455[/C][C]-0.2229[/C][C]0.41212[/C][/ROW]
[ROW][C]17[/C][C]-0.115872[/C][C]-0.9764[/C][C]0.166103[/C][/ROW]
[ROW][C]18[/C][C]0.03316[/C][C]0.2794[/C][C]0.39037[/C][/ROW]
[ROW][C]19[/C][C]0.066663[/C][C]0.5617[/C][C]0.288039[/C][/ROW]
[ROW][C]20[/C][C]-0.144636[/C][C]-1.2187[/C][C]0.113492[/C][/ROW]
[ROW][C]21[/C][C]-0.021343[/C][C]-0.1798[/C][C]0.428897[/C][/ROW]
[ROW][C]22[/C][C]-0.005975[/C][C]-0.0503[/C][C]0.479994[/C][/ROW]
[ROW][C]23[/C][C]-0.089356[/C][C]-0.7529[/C][C]0.226991[/C][/ROW]
[ROW][C]24[/C][C]-0.025216[/C][C]-0.2125[/C][C]0.416174[/C][/ROW]
[ROW][C]25[/C][C]0.047667[/C][C]0.4016[/C][C]0.344575[/C][/ROW]
[ROW][C]26[/C][C]-0.172561[/C][C]-1.454[/C][C]0.075172[/C][/ROW]
[ROW][C]27[/C][C]-0.053118[/C][C]-0.4476[/C][C]0.327909[/C][/ROW]
[ROW][C]28[/C][C]0.059757[/C][C]0.5035[/C][C]0.308078[/C][/ROW]
[ROW][C]29[/C][C]0.248983[/C][C]2.098[/C][C]0.019734[/C][/ROW]
[ROW][C]30[/C][C]-0.041329[/C][C]-0.3482[/C][C]0.364344[/C][/ROW]
[ROW][C]31[/C][C]0.0101[/C][C]0.0851[/C][C]0.46621[/C][/ROW]
[ROW][C]32[/C][C]-0.036184[/C][C]-0.3049[/C][C]0.38067[/C][/ROW]
[ROW][C]33[/C][C]-0.032803[/C][C]-0.2764[/C][C]0.391519[/C][/ROW]
[ROW][C]34[/C][C]0.097031[/C][C]0.8176[/C][C]0.208161[/C][/ROW]
[ROW][C]35[/C][C]0.111686[/C][C]0.9411[/C][C]0.174928[/C][/ROW]
[ROW][C]36[/C][C]-0.043388[/C][C]-0.3656[/C][C]0.357879[/C][/ROW]
[ROW][C]37[/C][C]-0.032302[/C][C]-0.2722[/C][C]0.393137[/C][/ROW]
[ROW][C]38[/C][C]-0.110869[/C][C]-0.9342[/C][C]0.176684[/C][/ROW]
[ROW][C]39[/C][C]-0.007047[/C][C]-0.0594[/C][C]0.476407[/C][/ROW]
[ROW][C]40[/C][C]0.02504[/C][C]0.211[/C][C]0.416749[/C][/ROW]
[ROW][C]41[/C][C]0.032489[/C][C]0.2738[/C][C]0.392534[/C][/ROW]
[ROW][C]42[/C][C]0.017907[/C][C]0.1509[/C][C]0.440247[/C][/ROW]
[ROW][C]43[/C][C]0.146747[/C][C]1.2365[/C][C]0.110171[/C][/ROW]
[ROW][C]44[/C][C]-0.010227[/C][C]-0.0862[/C][C]0.465786[/C][/ROW]
[ROW][C]45[/C][C]-0.070534[/C][C]-0.5943[/C][C]0.277091[/C][/ROW]
[ROW][C]46[/C][C]0.002231[/C][C]0.0188[/C][C]0.492528[/C][/ROW]
[ROW][C]47[/C][C]-0.031513[/C][C]-0.2655[/C][C]0.395685[/C][/ROW]
[ROW][C]48[/C][C]-0.111757[/C][C]-0.9417[/C][C]0.174775[/C][/ROW]
[/TABLE]
Source: https://freestatistics.org/blog/index.php?pk=244046&T=2

Globally Unique Identifier (entire table): ba.freestatistics.org/blog/index.php?pk=244046&T=2

As an alternative you can also use a QR Code:  

The GUIDs for individual cells are displayed in the table below:

Partial Autocorrelation Function
Time lag kPACF(k)T-STATP-value
10.3062062.58010.005973
2-0.064329-0.5420.294741
30.2807622.36570.010364
40.1330941.12150.132933
50.0980930.82650.205632
6-0.34567-2.91270.002394
7-0.007608-0.06410.474533
8-0.006309-0.05320.478877
9-0.082078-0.69160.245722
10-0.083127-0.70040.242971
110.0218130.18380.427346
12-0.068153-0.57430.283802
130.0628990.530.298884
140.0504260.42490.336097
150.0030.02530.48995
16-0.026455-0.22290.41212
17-0.115872-0.97640.166103
180.033160.27940.39037
190.0666630.56170.288039
20-0.144636-1.21870.113492
21-0.021343-0.17980.428897
22-0.005975-0.05030.479994
23-0.089356-0.75290.226991
24-0.025216-0.21250.416174
250.0476670.40160.344575
26-0.172561-1.4540.075172
27-0.053118-0.44760.327909
280.0597570.50350.308078
290.2489832.0980.019734
30-0.041329-0.34820.364344
310.01010.08510.46621
32-0.036184-0.30490.38067
33-0.032803-0.27640.391519
340.0970310.81760.208161
350.1116860.94110.174928
36-0.043388-0.36560.357879
37-0.032302-0.27220.393137
38-0.110869-0.93420.176684
39-0.007047-0.05940.476407
400.025040.2110.416749
410.0324890.27380.392534
420.0179070.15090.440247
430.1467471.23650.110171
44-0.010227-0.08620.465786
45-0.070534-0.59430.277091
460.0022310.01880.492528
47-0.031513-0.26550.395685
48-0.111757-0.94170.174775


Parameters (Session):
par1 = 48 ; par2 = 1 ; par3 = 1 ; par4 = 0 ; par5 = 12 ; par6 = White Noise ; par7 = 0.95 ;
Parameters (R input):
par1 = 48 ; par2 = 1 ; par3 = 1 ; par4 = 0 ; par5 = 12 ; par6 = White Noise ; par7 = 0.95 ; par8 = ;
R code (references can be found in the software module):
if (par1 == 'Default') {
par1 = 10*log10(length(x))
} else {
par1 <- as.numeric(par1)
}
par2 <- as.numeric(par2)
par3 <- as.numeric(par3)
par4 <- as.numeric(par4)
par5 <- as.numeric(par5)
if (par6 == 'White Noise') par6 <- 'white' else par6 <- 'ma'
par7 <- as.numeric(par7)
if (par8 != '') par8 <- as.numeric(par8)
ox <- x
if (par8 == '') {
if (par2 == 0) {
x <- log(x)
} else {
x <- (x ^ par2 - 1) / par2
}
} else {
x <- log(x,base=par8)
}
if (par3 > 0) x <- diff(x,lag=1,difference=par3)
if (par4 > 0) x <- diff(x,lag=par5,difference=par4)
bitmap(file='picts.png')
op <- par(mfrow=c(2,1))
plot(ox,type='l',main='Original Time Series',xlab='time',ylab='value')
if (par8=='') {
mytitle <- paste('Working Time Series (lambda=',par2,', d=',par3,', D=',par4,')',sep='')
mysub <- paste('(lambda=',par2,', d=',par3,', D=',par4,', CI=', par7, ', CI type=',par6,')',sep='')
} else {
mytitle <- paste('Working Time Series (base=',par8,', d=',par3,', D=',par4,')',sep='')
mysub <- paste('(base=',par8,', d=',par3,', D=',par4,', CI=', par7, ', CI type=',par6,')',sep='')
}
plot(x,type='l', main=mytitle,xlab='time',ylab='value')
par(op)
dev.off()
bitmap(file='pic1.png')
racf <- acf(x, par1, main='Autocorrelation', xlab='time lag', ylab='ACF', ci.type=par6, ci=par7, sub=mysub)
dev.off()
bitmap(file='pic2.png')
rpacf <- pacf(x,par1,main='Partial Autocorrelation',xlab='lags',ylab='PACF',sub=mysub)
dev.off()
(myacf <- c(racf$acf))
(mypacf <- c(rpacf$acf))
lengthx <- length(x)
sqrtn <- sqrt(lengthx)
load(file='createtable')
a<-table.start()
a<-table.row.start(a)
a<-table.element(a,'Autocorrelation Function',4,TRUE)
a<-table.row.end(a)
a<-table.row.start(a)
a<-table.element(a,'Time lag k',header=TRUE)
a<-table.element(a,hyperlink('basics.htm','ACF(k)','click here for more information about the Autocorrelation Function'),header=TRUE)
a<-table.element(a,'T-STAT',header=TRUE)
a<-table.element(a,'P-value',header=TRUE)
a<-table.row.end(a)
for (i in 2:(par1+1)) {
a<-table.row.start(a)
a<-table.element(a,i-1,header=TRUE)
a<-table.element(a,round(myacf[i],6))
mytstat <- myacf[i]*sqrtn
a<-table.element(a,round(mytstat,4))
a<-table.element(a,round(1-pt(abs(mytstat),lengthx),6))
a<-table.row.end(a)
}
a<-table.end(a)
table.save(a,file='mytable.tab')
a<-table.start()
a<-table.row.start(a)
a<-table.element(a,'Partial Autocorrelation Function',4,TRUE)
a<-table.row.end(a)
a<-table.row.start(a)
a<-table.element(a,'Time lag k',header=TRUE)
a<-table.element(a,hyperlink('basics.htm','PACF(k)','click here for more information about the Partial Autocorrelation Function'),header=TRUE)
a<-table.element(a,'T-STAT',header=TRUE)
a<-table.element(a,'P-value',header=TRUE)
a<-table.row.end(a)
for (i in 1:par1) {
a<-table.row.start(a)
a<-table.element(a,i,header=TRUE)
a<-table.element(a,round(mypacf[i],6))
mytstat <- mypacf[i]*sqrtn
a<-table.element(a,round(mytstat,4))
a<-table.element(a,round(1-pt(abs(mytstat),lengthx),6))
a<-table.row.end(a)
}
a<-table.end(a)
table.save(a,file='mytable1.tab')