Free Statistics

of Irreproducible Research!

Author's title

Author*Unverified author*
R Software Modulerwasp_autocorrelation.wasp
Title produced by software(Partial) Autocorrelation Function
Date of computationMon, 20 Oct 2014 15:23:42 +0100
Cite this page as followsStatistical Computations at FreeStatistics.org, Office for Research Development and Education, URL https://freestatistics.org/blog/index.php?v=date/2014/Oct/20/t1413815147mr5k73flzj2aot3.htm/, Retrieved Sat, 11 May 2024 09:27:40 +0000
Statistical Computations at FreeStatistics.org, Office for Research Development and Education, URL https://freestatistics.org/blog/index.php?pk=244041, Retrieved Sat, 11 May 2024 09:27:40 +0000
QR Codes:

Original text written by user:
IsPrivate?No (this computation is public)
User-defined keywords
Estimated Impact60
Family? (F = Feedback message, R = changed R code, M = changed R Module, P = changed Parameters, D = changed Data)
-       [(Partial) Autocorrelation Function] [] [2014-10-20 14:23:42] [25af208440423f5cc2d7fa35cacd4ca5] [Current]
Feedback Forum

Post a new message
Dataseries X:
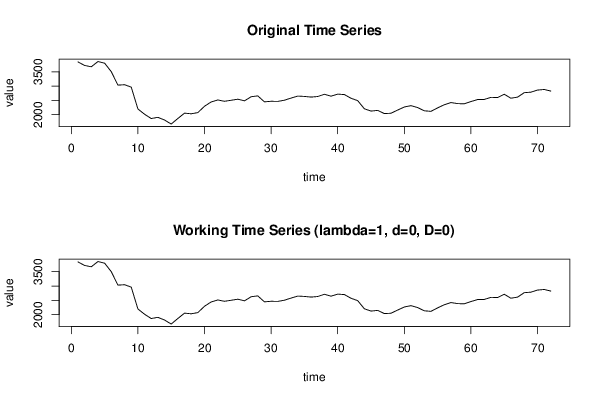
3844,49
3720,98
3674,4
3857,62
3801,06
3504,37
3032,6
3047,03
2962,34
2197,82
2014,45
1862,83
1905,41
1810,99
1670,07
1864,44
2052,02
2029,6
2070,83
2293,41
2443,27
2513,17
2466,92
2502,66
2539,91
2482,6
2626,15
2656,32
2446,66
2467,38
2462,32
2504,58
2579,39
2649,24
2636,87
2613,94
2634,01
2711,94
2646,43
2717,79
2701,54
2572,98
2488,92
2204,91
2123,99
2149,1
2036,71
2048,32
2159,56
2267,79
2313,55
2247,3
2134,43
2114
2236,94
2345,39
2422,4
2385,96
2378,17
2457,13
2527,67
2530,03
2604,92
2596,8
2713,2
2574,82
2611,98
2768,46
2785,61
2859,27
2880,53
2824,5


Summary of computational transaction
Raw Inputview raw input (R code)
Raw Outputview raw output of R engine
Computing time2 seconds
R Server'Gwilym Jenkins' @ jenkins.wessa.net

\begin{tabular}{lllllllll}
\hline
Summary of computational transaction \tabularnewline
Raw Input & view raw input (R code)  \tabularnewline
Raw Output & view raw output of R engine  \tabularnewline
Computing time & 2 seconds \tabularnewline
R Server & 'Gwilym Jenkins' @ jenkins.wessa.net \tabularnewline
\hline
\end{tabular}
%Source: https://freestatistics.org/blog/index.php?pk=244041&T=0

[TABLE]
[ROW][C]Summary of computational transaction[/C][/ROW]
[ROW][C]Raw Input[/C][C]view raw input (R code) [/C][/ROW]
[ROW][C]Raw Output[/C][C]view raw output of R engine [/C][/ROW]
[ROW][C]Computing time[/C][C]2 seconds[/C][/ROW]
[ROW][C]R Server[/C][C]'Gwilym Jenkins' @ jenkins.wessa.net[/C][/ROW]
[/TABLE]
Source: https://freestatistics.org/blog/index.php?pk=244041&T=0

Globally Unique Identifier (entire table): ba.freestatistics.org/blog/index.php?pk=244041&T=0

As an alternative you can also use a QR Code:  

The GUIDs for individual cells are displayed in the table below:

Summary of computational transaction
Raw Inputview raw input (R code)
Raw Outputview raw output of R engine
Computing time2 seconds
R Server'Gwilym Jenkins' @ jenkins.wessa.net


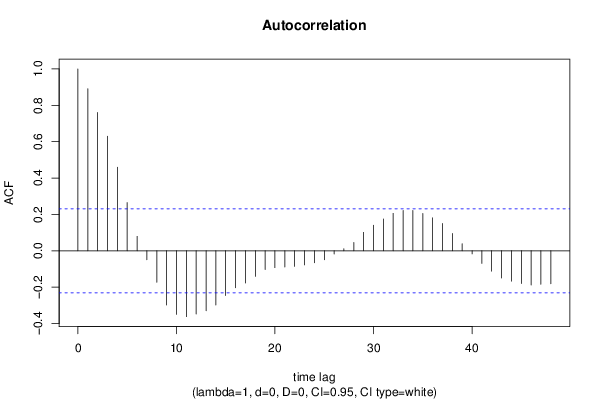
Autocorrelation Function
Time lag kACF(k)T-STATP-value
10.8915327.56490
20.7607426.45510
30.6299045.34491e-06
40.45933.89730.000108
50.2649922.24850.013802
60.0794050.67380.251307
7-0.048695-0.41320.340349
8-0.172911-1.46720.073338
9-0.298324-2.53140.006773
10-0.349654-2.96690.00204
11-0.361941-3.07120.001504
12-0.347681-2.95020.002141
13-0.329386-2.79490.003325
14-0.297964-2.52830.006827
15-0.245696-2.08480.020317
16-0.20342-1.72610.044311
17-0.177435-1.50560.068274
18-0.14056-1.19270.118453
19-0.102992-0.87390.192535
20-0.092494-0.78480.217562
21-0.088711-0.75270.227031
22-0.085505-0.72550.235237
23-0.077511-0.65770.256412
24-0.065833-0.55860.289079
25-0.048725-0.41340.340254
26-0.017578-0.14920.440924
270.0113640.09640.461726
280.0455290.38630.350196
290.1015930.8620.195762
300.1411271.19750.117519
310.1748911.4840.071087
320.2059171.74730.042428
330.2215261.87970.032097
340.2217811.88190.031948
350.2056791.74520.042604
360.1812681.53810.064203
370.1502121.27460.103275
380.0953350.80890.210606
390.0387530.32880.371619
40-0.017001-0.14430.442849
41-0.06909-0.58620.279772
42-0.111692-0.94770.173217
43-0.149581-1.26920.104222
44-0.166748-1.41490.080704
45-0.179498-1.52310.066058
46-0.188323-1.5980.057214
47-0.183427-1.55640.061995
48-0.181037-1.53610.064443

\begin{tabular}{lllllllll}
\hline
Autocorrelation Function \tabularnewline
Time lag k & ACF(k) & T-STAT & P-value \tabularnewline
1 & 0.891532 & 7.5649 & 0 \tabularnewline
2 & 0.760742 & 6.4551 & 0 \tabularnewline
3 & 0.629904 & 5.3449 & 1e-06 \tabularnewline
4 & 0.4593 & 3.8973 & 0.000108 \tabularnewline
5 & 0.264992 & 2.2485 & 0.013802 \tabularnewline
6 & 0.079405 & 0.6738 & 0.251307 \tabularnewline
7 & -0.048695 & -0.4132 & 0.340349 \tabularnewline
8 & -0.172911 & -1.4672 & 0.073338 \tabularnewline
9 & -0.298324 & -2.5314 & 0.006773 \tabularnewline
10 & -0.349654 & -2.9669 & 0.00204 \tabularnewline
11 & -0.361941 & -3.0712 & 0.001504 \tabularnewline
12 & -0.347681 & -2.9502 & 0.002141 \tabularnewline
13 & -0.329386 & -2.7949 & 0.003325 \tabularnewline
14 & -0.297964 & -2.5283 & 0.006827 \tabularnewline
15 & -0.245696 & -2.0848 & 0.020317 \tabularnewline
16 & -0.20342 & -1.7261 & 0.044311 \tabularnewline
17 & -0.177435 & -1.5056 & 0.068274 \tabularnewline
18 & -0.14056 & -1.1927 & 0.118453 \tabularnewline
19 & -0.102992 & -0.8739 & 0.192535 \tabularnewline
20 & -0.092494 & -0.7848 & 0.217562 \tabularnewline
21 & -0.088711 & -0.7527 & 0.227031 \tabularnewline
22 & -0.085505 & -0.7255 & 0.235237 \tabularnewline
23 & -0.077511 & -0.6577 & 0.256412 \tabularnewline
24 & -0.065833 & -0.5586 & 0.289079 \tabularnewline
25 & -0.048725 & -0.4134 & 0.340254 \tabularnewline
26 & -0.017578 & -0.1492 & 0.440924 \tabularnewline
27 & 0.011364 & 0.0964 & 0.461726 \tabularnewline
28 & 0.045529 & 0.3863 & 0.350196 \tabularnewline
29 & 0.101593 & 0.862 & 0.195762 \tabularnewline
30 & 0.141127 & 1.1975 & 0.117519 \tabularnewline
31 & 0.174891 & 1.484 & 0.071087 \tabularnewline
32 & 0.205917 & 1.7473 & 0.042428 \tabularnewline
33 & 0.221526 & 1.8797 & 0.032097 \tabularnewline
34 & 0.221781 & 1.8819 & 0.031948 \tabularnewline
35 & 0.205679 & 1.7452 & 0.042604 \tabularnewline
36 & 0.181268 & 1.5381 & 0.064203 \tabularnewline
37 & 0.150212 & 1.2746 & 0.103275 \tabularnewline
38 & 0.095335 & 0.8089 & 0.210606 \tabularnewline
39 & 0.038753 & 0.3288 & 0.371619 \tabularnewline
40 & -0.017001 & -0.1443 & 0.442849 \tabularnewline
41 & -0.06909 & -0.5862 & 0.279772 \tabularnewline
42 & -0.111692 & -0.9477 & 0.173217 \tabularnewline
43 & -0.149581 & -1.2692 & 0.104222 \tabularnewline
44 & -0.166748 & -1.4149 & 0.080704 \tabularnewline
45 & -0.179498 & -1.5231 & 0.066058 \tabularnewline
46 & -0.188323 & -1.598 & 0.057214 \tabularnewline
47 & -0.183427 & -1.5564 & 0.061995 \tabularnewline
48 & -0.181037 & -1.5361 & 0.064443 \tabularnewline
\hline
\end{tabular}
%Source: https://freestatistics.org/blog/index.php?pk=244041&T=1

[TABLE]
[ROW][C]Autocorrelation Function[/C][/ROW]
[ROW][C]Time lag k[/C][C]ACF(k)[/C][C]T-STAT[/C][C]P-value[/C][/ROW]
[ROW][C]1[/C][C]0.891532[/C][C]7.5649[/C][C]0[/C][/ROW]
[ROW][C]2[/C][C]0.760742[/C][C]6.4551[/C][C]0[/C][/ROW]
[ROW][C]3[/C][C]0.629904[/C][C]5.3449[/C][C]1e-06[/C][/ROW]
[ROW][C]4[/C][C]0.4593[/C][C]3.8973[/C][C]0.000108[/C][/ROW]
[ROW][C]5[/C][C]0.264992[/C][C]2.2485[/C][C]0.013802[/C][/ROW]
[ROW][C]6[/C][C]0.079405[/C][C]0.6738[/C][C]0.251307[/C][/ROW]
[ROW][C]7[/C][C]-0.048695[/C][C]-0.4132[/C][C]0.340349[/C][/ROW]
[ROW][C]8[/C][C]-0.172911[/C][C]-1.4672[/C][C]0.073338[/C][/ROW]
[ROW][C]9[/C][C]-0.298324[/C][C]-2.5314[/C][C]0.006773[/C][/ROW]
[ROW][C]10[/C][C]-0.349654[/C][C]-2.9669[/C][C]0.00204[/C][/ROW]
[ROW][C]11[/C][C]-0.361941[/C][C]-3.0712[/C][C]0.001504[/C][/ROW]
[ROW][C]12[/C][C]-0.347681[/C][C]-2.9502[/C][C]0.002141[/C][/ROW]
[ROW][C]13[/C][C]-0.329386[/C][C]-2.7949[/C][C]0.003325[/C][/ROW]
[ROW][C]14[/C][C]-0.297964[/C][C]-2.5283[/C][C]0.006827[/C][/ROW]
[ROW][C]15[/C][C]-0.245696[/C][C]-2.0848[/C][C]0.020317[/C][/ROW]
[ROW][C]16[/C][C]-0.20342[/C][C]-1.7261[/C][C]0.044311[/C][/ROW]
[ROW][C]17[/C][C]-0.177435[/C][C]-1.5056[/C][C]0.068274[/C][/ROW]
[ROW][C]18[/C][C]-0.14056[/C][C]-1.1927[/C][C]0.118453[/C][/ROW]
[ROW][C]19[/C][C]-0.102992[/C][C]-0.8739[/C][C]0.192535[/C][/ROW]
[ROW][C]20[/C][C]-0.092494[/C][C]-0.7848[/C][C]0.217562[/C][/ROW]
[ROW][C]21[/C][C]-0.088711[/C][C]-0.7527[/C][C]0.227031[/C][/ROW]
[ROW][C]22[/C][C]-0.085505[/C][C]-0.7255[/C][C]0.235237[/C][/ROW]
[ROW][C]23[/C][C]-0.077511[/C][C]-0.6577[/C][C]0.256412[/C][/ROW]
[ROW][C]24[/C][C]-0.065833[/C][C]-0.5586[/C][C]0.289079[/C][/ROW]
[ROW][C]25[/C][C]-0.048725[/C][C]-0.4134[/C][C]0.340254[/C][/ROW]
[ROW][C]26[/C][C]-0.017578[/C][C]-0.1492[/C][C]0.440924[/C][/ROW]
[ROW][C]27[/C][C]0.011364[/C][C]0.0964[/C][C]0.461726[/C][/ROW]
[ROW][C]28[/C][C]0.045529[/C][C]0.3863[/C][C]0.350196[/C][/ROW]
[ROW][C]29[/C][C]0.101593[/C][C]0.862[/C][C]0.195762[/C][/ROW]
[ROW][C]30[/C][C]0.141127[/C][C]1.1975[/C][C]0.117519[/C][/ROW]
[ROW][C]31[/C][C]0.174891[/C][C]1.484[/C][C]0.071087[/C][/ROW]
[ROW][C]32[/C][C]0.205917[/C][C]1.7473[/C][C]0.042428[/C][/ROW]
[ROW][C]33[/C][C]0.221526[/C][C]1.8797[/C][C]0.032097[/C][/ROW]
[ROW][C]34[/C][C]0.221781[/C][C]1.8819[/C][C]0.031948[/C][/ROW]
[ROW][C]35[/C][C]0.205679[/C][C]1.7452[/C][C]0.042604[/C][/ROW]
[ROW][C]36[/C][C]0.181268[/C][C]1.5381[/C][C]0.064203[/C][/ROW]
[ROW][C]37[/C][C]0.150212[/C][C]1.2746[/C][C]0.103275[/C][/ROW]
[ROW][C]38[/C][C]0.095335[/C][C]0.8089[/C][C]0.210606[/C][/ROW]
[ROW][C]39[/C][C]0.038753[/C][C]0.3288[/C][C]0.371619[/C][/ROW]
[ROW][C]40[/C][C]-0.017001[/C][C]-0.1443[/C][C]0.442849[/C][/ROW]
[ROW][C]41[/C][C]-0.06909[/C][C]-0.5862[/C][C]0.279772[/C][/ROW]
[ROW][C]42[/C][C]-0.111692[/C][C]-0.9477[/C][C]0.173217[/C][/ROW]
[ROW][C]43[/C][C]-0.149581[/C][C]-1.2692[/C][C]0.104222[/C][/ROW]
[ROW][C]44[/C][C]-0.166748[/C][C]-1.4149[/C][C]0.080704[/C][/ROW]
[ROW][C]45[/C][C]-0.179498[/C][C]-1.5231[/C][C]0.066058[/C][/ROW]
[ROW][C]46[/C][C]-0.188323[/C][C]-1.598[/C][C]0.057214[/C][/ROW]
[ROW][C]47[/C][C]-0.183427[/C][C]-1.5564[/C][C]0.061995[/C][/ROW]
[ROW][C]48[/C][C]-0.181037[/C][C]-1.5361[/C][C]0.064443[/C][/ROW]
[/TABLE]
Source: https://freestatistics.org/blog/index.php?pk=244041&T=1

Globally Unique Identifier (entire table): ba.freestatistics.org/blog/index.php?pk=244041&T=1

As an alternative you can also use a QR Code:  

The GUIDs for individual cells are displayed in the table below:

Autocorrelation Function
Time lag kACF(k)T-STATP-value
10.8915327.56490
20.7607426.45510
30.6299045.34491e-06
40.45933.89730.000108
50.2649922.24850.013802
60.0794050.67380.251307
7-0.048695-0.41320.340349
8-0.172911-1.46720.073338
9-0.298324-2.53140.006773
10-0.349654-2.96690.00204
11-0.361941-3.07120.001504
12-0.347681-2.95020.002141
13-0.329386-2.79490.003325
14-0.297964-2.52830.006827
15-0.245696-2.08480.020317
16-0.20342-1.72610.044311
17-0.177435-1.50560.068274
18-0.14056-1.19270.118453
19-0.102992-0.87390.192535
20-0.092494-0.78480.217562
21-0.088711-0.75270.227031
22-0.085505-0.72550.235237
23-0.077511-0.65770.256412
24-0.065833-0.55860.289079
25-0.048725-0.41340.340254
26-0.017578-0.14920.440924
270.0113640.09640.461726
280.0455290.38630.350196
290.1015930.8620.195762
300.1411271.19750.117519
310.1748911.4840.071087
320.2059171.74730.042428
330.2215261.87970.032097
340.2217811.88190.031948
350.2056791.74520.042604
360.1812681.53810.064203
370.1502121.27460.103275
380.0953350.80890.210606
390.0387530.32880.371619
40-0.017001-0.14430.442849
41-0.06909-0.58620.279772
42-0.111692-0.94770.173217
43-0.149581-1.26920.104222
44-0.166748-1.41490.080704
45-0.179498-1.52310.066058
46-0.188323-1.5980.057214
47-0.183427-1.55640.061995
48-0.181037-1.53610.064443


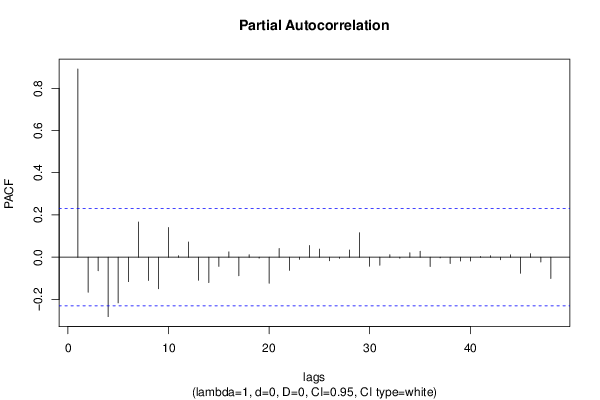
Partial Autocorrelation Function
Time lag kPACF(k)T-STATP-value
10.8915327.56490
2-0.16614-1.40970.08146
3-0.064576-0.54790.292711
4-0.281536-2.38890.00976
5-0.216303-1.83540.035289
6-0.115807-0.98270.164535
70.1666531.41410.080821
8-0.110543-0.9380.175692
9-0.149551-1.2690.104267
100.1410561.19690.117636
110.0065890.05590.477786
120.0719170.61020.271813
13-0.109434-0.92860.178104
14-0.120288-1.02070.155412
15-0.043445-0.36860.356737
160.0251560.21350.415787
17-0.087684-0.7440.229641
180.0119730.10160.45968
19-0.004303-0.03650.485488
20-0.123636-1.04910.148824
210.0415830.35280.362618
22-0.062561-0.53090.298578
23-0.010291-0.08730.46533
240.0555510.47140.319402
250.0384910.32660.372457
26-0.016925-0.14360.443104
27-0.005664-0.04810.480901
280.0339790.28830.386966
290.116110.98520.163906
30-0.042811-0.36330.358737
31-0.038483-0.32650.372481
320.0118270.10040.460169
33-0.004789-0.04060.48385
340.0212230.18010.428797
350.0278590.23640.406901
36-0.044328-0.37610.353962
37-0.003236-0.02750.489084
38-0.029813-0.2530.400507
39-0.017869-0.15160.439954
40-0.018163-0.15410.438973
410.0034970.02970.488206
420.0067730.05750.477164
43-0.011765-0.09980.460379
440.0111850.09490.462325
45-0.076131-0.6460.260169
460.0162450.13780.445376
47-0.022864-0.1940.423357
48-0.100632-0.85390.197998

\begin{tabular}{lllllllll}
\hline
Partial Autocorrelation Function \tabularnewline
Time lag k & PACF(k) & T-STAT & P-value \tabularnewline
1 & 0.891532 & 7.5649 & 0 \tabularnewline
2 & -0.16614 & -1.4097 & 0.08146 \tabularnewline
3 & -0.064576 & -0.5479 & 0.292711 \tabularnewline
4 & -0.281536 & -2.3889 & 0.00976 \tabularnewline
5 & -0.216303 & -1.8354 & 0.035289 \tabularnewline
6 & -0.115807 & -0.9827 & 0.164535 \tabularnewline
7 & 0.166653 & 1.4141 & 0.080821 \tabularnewline
8 & -0.110543 & -0.938 & 0.175692 \tabularnewline
9 & -0.149551 & -1.269 & 0.104267 \tabularnewline
10 & 0.141056 & 1.1969 & 0.117636 \tabularnewline
11 & 0.006589 & 0.0559 & 0.477786 \tabularnewline
12 & 0.071917 & 0.6102 & 0.271813 \tabularnewline
13 & -0.109434 & -0.9286 & 0.178104 \tabularnewline
14 & -0.120288 & -1.0207 & 0.155412 \tabularnewline
15 & -0.043445 & -0.3686 & 0.356737 \tabularnewline
16 & 0.025156 & 0.2135 & 0.415787 \tabularnewline
17 & -0.087684 & -0.744 & 0.229641 \tabularnewline
18 & 0.011973 & 0.1016 & 0.45968 \tabularnewline
19 & -0.004303 & -0.0365 & 0.485488 \tabularnewline
20 & -0.123636 & -1.0491 & 0.148824 \tabularnewline
21 & 0.041583 & 0.3528 & 0.362618 \tabularnewline
22 & -0.062561 & -0.5309 & 0.298578 \tabularnewline
23 & -0.010291 & -0.0873 & 0.46533 \tabularnewline
24 & 0.055551 & 0.4714 & 0.319402 \tabularnewline
25 & 0.038491 & 0.3266 & 0.372457 \tabularnewline
26 & -0.016925 & -0.1436 & 0.443104 \tabularnewline
27 & -0.005664 & -0.0481 & 0.480901 \tabularnewline
28 & 0.033979 & 0.2883 & 0.386966 \tabularnewline
29 & 0.11611 & 0.9852 & 0.163906 \tabularnewline
30 & -0.042811 & -0.3633 & 0.358737 \tabularnewline
31 & -0.038483 & -0.3265 & 0.372481 \tabularnewline
32 & 0.011827 & 0.1004 & 0.460169 \tabularnewline
33 & -0.004789 & -0.0406 & 0.48385 \tabularnewline
34 & 0.021223 & 0.1801 & 0.428797 \tabularnewline
35 & 0.027859 & 0.2364 & 0.406901 \tabularnewline
36 & -0.044328 & -0.3761 & 0.353962 \tabularnewline
37 & -0.003236 & -0.0275 & 0.489084 \tabularnewline
38 & -0.029813 & -0.253 & 0.400507 \tabularnewline
39 & -0.017869 & -0.1516 & 0.439954 \tabularnewline
40 & -0.018163 & -0.1541 & 0.438973 \tabularnewline
41 & 0.003497 & 0.0297 & 0.488206 \tabularnewline
42 & 0.006773 & 0.0575 & 0.477164 \tabularnewline
43 & -0.011765 & -0.0998 & 0.460379 \tabularnewline
44 & 0.011185 & 0.0949 & 0.462325 \tabularnewline
45 & -0.076131 & -0.646 & 0.260169 \tabularnewline
46 & 0.016245 & 0.1378 & 0.445376 \tabularnewline
47 & -0.022864 & -0.194 & 0.423357 \tabularnewline
48 & -0.100632 & -0.8539 & 0.197998 \tabularnewline
\hline
\end{tabular}
%Source: https://freestatistics.org/blog/index.php?pk=244041&T=2

[TABLE]
[ROW][C]Partial Autocorrelation Function[/C][/ROW]
[ROW][C]Time lag k[/C][C]PACF(k)[/C][C]T-STAT[/C][C]P-value[/C][/ROW]
[ROW][C]1[/C][C]0.891532[/C][C]7.5649[/C][C]0[/C][/ROW]
[ROW][C]2[/C][C]-0.16614[/C][C]-1.4097[/C][C]0.08146[/C][/ROW]
[ROW][C]3[/C][C]-0.064576[/C][C]-0.5479[/C][C]0.292711[/C][/ROW]
[ROW][C]4[/C][C]-0.281536[/C][C]-2.3889[/C][C]0.00976[/C][/ROW]
[ROW][C]5[/C][C]-0.216303[/C][C]-1.8354[/C][C]0.035289[/C][/ROW]
[ROW][C]6[/C][C]-0.115807[/C][C]-0.9827[/C][C]0.164535[/C][/ROW]
[ROW][C]7[/C][C]0.166653[/C][C]1.4141[/C][C]0.080821[/C][/ROW]
[ROW][C]8[/C][C]-0.110543[/C][C]-0.938[/C][C]0.175692[/C][/ROW]
[ROW][C]9[/C][C]-0.149551[/C][C]-1.269[/C][C]0.104267[/C][/ROW]
[ROW][C]10[/C][C]0.141056[/C][C]1.1969[/C][C]0.117636[/C][/ROW]
[ROW][C]11[/C][C]0.006589[/C][C]0.0559[/C][C]0.477786[/C][/ROW]
[ROW][C]12[/C][C]0.071917[/C][C]0.6102[/C][C]0.271813[/C][/ROW]
[ROW][C]13[/C][C]-0.109434[/C][C]-0.9286[/C][C]0.178104[/C][/ROW]
[ROW][C]14[/C][C]-0.120288[/C][C]-1.0207[/C][C]0.155412[/C][/ROW]
[ROW][C]15[/C][C]-0.043445[/C][C]-0.3686[/C][C]0.356737[/C][/ROW]
[ROW][C]16[/C][C]0.025156[/C][C]0.2135[/C][C]0.415787[/C][/ROW]
[ROW][C]17[/C][C]-0.087684[/C][C]-0.744[/C][C]0.229641[/C][/ROW]
[ROW][C]18[/C][C]0.011973[/C][C]0.1016[/C][C]0.45968[/C][/ROW]
[ROW][C]19[/C][C]-0.004303[/C][C]-0.0365[/C][C]0.485488[/C][/ROW]
[ROW][C]20[/C][C]-0.123636[/C][C]-1.0491[/C][C]0.148824[/C][/ROW]
[ROW][C]21[/C][C]0.041583[/C][C]0.3528[/C][C]0.362618[/C][/ROW]
[ROW][C]22[/C][C]-0.062561[/C][C]-0.5309[/C][C]0.298578[/C][/ROW]
[ROW][C]23[/C][C]-0.010291[/C][C]-0.0873[/C][C]0.46533[/C][/ROW]
[ROW][C]24[/C][C]0.055551[/C][C]0.4714[/C][C]0.319402[/C][/ROW]
[ROW][C]25[/C][C]0.038491[/C][C]0.3266[/C][C]0.372457[/C][/ROW]
[ROW][C]26[/C][C]-0.016925[/C][C]-0.1436[/C][C]0.443104[/C][/ROW]
[ROW][C]27[/C][C]-0.005664[/C][C]-0.0481[/C][C]0.480901[/C][/ROW]
[ROW][C]28[/C][C]0.033979[/C][C]0.2883[/C][C]0.386966[/C][/ROW]
[ROW][C]29[/C][C]0.11611[/C][C]0.9852[/C][C]0.163906[/C][/ROW]
[ROW][C]30[/C][C]-0.042811[/C][C]-0.3633[/C][C]0.358737[/C][/ROW]
[ROW][C]31[/C][C]-0.038483[/C][C]-0.3265[/C][C]0.372481[/C][/ROW]
[ROW][C]32[/C][C]0.011827[/C][C]0.1004[/C][C]0.460169[/C][/ROW]
[ROW][C]33[/C][C]-0.004789[/C][C]-0.0406[/C][C]0.48385[/C][/ROW]
[ROW][C]34[/C][C]0.021223[/C][C]0.1801[/C][C]0.428797[/C][/ROW]
[ROW][C]35[/C][C]0.027859[/C][C]0.2364[/C][C]0.406901[/C][/ROW]
[ROW][C]36[/C][C]-0.044328[/C][C]-0.3761[/C][C]0.353962[/C][/ROW]
[ROW][C]37[/C][C]-0.003236[/C][C]-0.0275[/C][C]0.489084[/C][/ROW]
[ROW][C]38[/C][C]-0.029813[/C][C]-0.253[/C][C]0.400507[/C][/ROW]
[ROW][C]39[/C][C]-0.017869[/C][C]-0.1516[/C][C]0.439954[/C][/ROW]
[ROW][C]40[/C][C]-0.018163[/C][C]-0.1541[/C][C]0.438973[/C][/ROW]
[ROW][C]41[/C][C]0.003497[/C][C]0.0297[/C][C]0.488206[/C][/ROW]
[ROW][C]42[/C][C]0.006773[/C][C]0.0575[/C][C]0.477164[/C][/ROW]
[ROW][C]43[/C][C]-0.011765[/C][C]-0.0998[/C][C]0.460379[/C][/ROW]
[ROW][C]44[/C][C]0.011185[/C][C]0.0949[/C][C]0.462325[/C][/ROW]
[ROW][C]45[/C][C]-0.076131[/C][C]-0.646[/C][C]0.260169[/C][/ROW]
[ROW][C]46[/C][C]0.016245[/C][C]0.1378[/C][C]0.445376[/C][/ROW]
[ROW][C]47[/C][C]-0.022864[/C][C]-0.194[/C][C]0.423357[/C][/ROW]
[ROW][C]48[/C][C]-0.100632[/C][C]-0.8539[/C][C]0.197998[/C][/ROW]
[/TABLE]
Source: https://freestatistics.org/blog/index.php?pk=244041&T=2

Globally Unique Identifier (entire table): ba.freestatistics.org/blog/index.php?pk=244041&T=2

As an alternative you can also use a QR Code:  

The GUIDs for individual cells are displayed in the table below:

Partial Autocorrelation Function
Time lag kPACF(k)T-STATP-value
10.8915327.56490
2-0.16614-1.40970.08146
3-0.064576-0.54790.292711
4-0.281536-2.38890.00976
5-0.216303-1.83540.035289
6-0.115807-0.98270.164535
70.1666531.41410.080821
8-0.110543-0.9380.175692
9-0.149551-1.2690.104267
100.1410561.19690.117636
110.0065890.05590.477786
120.0719170.61020.271813
13-0.109434-0.92860.178104
14-0.120288-1.02070.155412
15-0.043445-0.36860.356737
160.0251560.21350.415787
17-0.087684-0.7440.229641
180.0119730.10160.45968
19-0.004303-0.03650.485488
20-0.123636-1.04910.148824
210.0415830.35280.362618
22-0.062561-0.53090.298578
23-0.010291-0.08730.46533
240.0555510.47140.319402
250.0384910.32660.372457
26-0.016925-0.14360.443104
27-0.005664-0.04810.480901
280.0339790.28830.386966
290.116110.98520.163906
30-0.042811-0.36330.358737
31-0.038483-0.32650.372481
320.0118270.10040.460169
33-0.004789-0.04060.48385
340.0212230.18010.428797
350.0278590.23640.406901
36-0.044328-0.37610.353962
37-0.003236-0.02750.489084
38-0.029813-0.2530.400507
39-0.017869-0.15160.439954
40-0.018163-0.15410.438973
410.0034970.02970.488206
420.0067730.05750.477164
43-0.011765-0.09980.460379
440.0111850.09490.462325
45-0.076131-0.6460.260169
460.0162450.13780.445376
47-0.022864-0.1940.423357
48-0.100632-0.85390.197998


Parameters (Session):
par1 = 48 ; par2 = 1 ; par3 = 0 ; par4 = 0 ; par5 = 12 ; par6 = White Noise ; par7 = 0.95 ;
Parameters (R input):
par1 = 48 ; par2 = 1 ; par3 = 0 ; par4 = 0 ; par5 = 12 ; par6 = White Noise ; par7 = 0.95 ; par8 = ;
R code (references can be found in the software module):
if (par1 == 'Default') {
par1 = 10*log10(length(x))
} else {
par1 <- as.numeric(par1)
}
par2 <- as.numeric(par2)
par3 <- as.numeric(par3)
par4 <- as.numeric(par4)
par5 <- as.numeric(par5)
if (par6 == 'White Noise') par6 <- 'white' else par6 <- 'ma'
par7 <- as.numeric(par7)
if (par8 != '') par8 <- as.numeric(par8)
ox <- x
if (par8 == '') {
if (par2 == 0) {
x <- log(x)
} else {
x <- (x ^ par2 - 1) / par2
}
} else {
x <- log(x,base=par8)
}
if (par3 > 0) x <- diff(x,lag=1,difference=par3)
if (par4 > 0) x <- diff(x,lag=par5,difference=par4)
bitmap(file='picts.png')
op <- par(mfrow=c(2,1))
plot(ox,type='l',main='Original Time Series',xlab='time',ylab='value')
if (par8=='') {
mytitle <- paste('Working Time Series (lambda=',par2,', d=',par3,', D=',par4,')',sep='')
mysub <- paste('(lambda=',par2,', d=',par3,', D=',par4,', CI=', par7, ', CI type=',par6,')',sep='')
} else {
mytitle <- paste('Working Time Series (base=',par8,', d=',par3,', D=',par4,')',sep='')
mysub <- paste('(base=',par8,', d=',par3,', D=',par4,', CI=', par7, ', CI type=',par6,')',sep='')
}
plot(x,type='l', main=mytitle,xlab='time',ylab='value')
par(op)
dev.off()
bitmap(file='pic1.png')
racf <- acf(x, par1, main='Autocorrelation', xlab='time lag', ylab='ACF', ci.type=par6, ci=par7, sub=mysub)
dev.off()
bitmap(file='pic2.png')
rpacf <- pacf(x,par1,main='Partial Autocorrelation',xlab='lags',ylab='PACF',sub=mysub)
dev.off()
(myacf <- c(racf$acf))
(mypacf <- c(rpacf$acf))
lengthx <- length(x)
sqrtn <- sqrt(lengthx)
load(file='createtable')
a<-table.start()
a<-table.row.start(a)
a<-table.element(a,'Autocorrelation Function',4,TRUE)
a<-table.row.end(a)
a<-table.row.start(a)
a<-table.element(a,'Time lag k',header=TRUE)
a<-table.element(a,hyperlink('basics.htm','ACF(k)','click here for more information about the Autocorrelation Function'),header=TRUE)
a<-table.element(a,'T-STAT',header=TRUE)
a<-table.element(a,'P-value',header=TRUE)
a<-table.row.end(a)
for (i in 2:(par1+1)) {
a<-table.row.start(a)
a<-table.element(a,i-1,header=TRUE)
a<-table.element(a,round(myacf[i],6))
mytstat <- myacf[i]*sqrtn
a<-table.element(a,round(mytstat,4))
a<-table.element(a,round(1-pt(abs(mytstat),lengthx),6))
a<-table.row.end(a)
}
a<-table.end(a)
table.save(a,file='mytable.tab')
a<-table.start()
a<-table.row.start(a)
a<-table.element(a,'Partial Autocorrelation Function',4,TRUE)
a<-table.row.end(a)
a<-table.row.start(a)
a<-table.element(a,'Time lag k',header=TRUE)
a<-table.element(a,hyperlink('basics.htm','PACF(k)','click here for more information about the Partial Autocorrelation Function'),header=TRUE)
a<-table.element(a,'T-STAT',header=TRUE)
a<-table.element(a,'P-value',header=TRUE)
a<-table.row.end(a)
for (i in 1:par1) {
a<-table.row.start(a)
a<-table.element(a,i,header=TRUE)
a<-table.element(a,round(mypacf[i],6))
mytstat <- mypacf[i]*sqrtn
a<-table.element(a,round(mytstat,4))
a<-table.element(a,round(1-pt(abs(mytstat),lengthx),6))
a<-table.row.end(a)
}
a<-table.end(a)
table.save(a,file='mytable1.tab')