Free Statistics

of Irreproducible Research!

Author's title

Author*Unverified author*
R Software Modulerwasp_autocorrelation.wasp
Title produced by software(Partial) Autocorrelation Function
Date of computationSun, 19 Oct 2014 22:02:04 +0100
Cite this page as followsStatistical Computations at FreeStatistics.org, Office for Research Development and Education, URL https://freestatistics.org/blog/index.php?v=date/2014/Oct/19/t141375256997q54i3y3c4kujr.htm/, Retrieved Sun, 12 May 2024 01:00:04 +0000
Statistical Computations at FreeStatistics.org, Office for Research Development and Education, URL https://freestatistics.org/blog/index.php?pk=243794, Retrieved Sun, 12 May 2024 01:00:04 +0000
QR Codes:

Original text written by user:
IsPrivate?No (this computation is public)
User-defined keywords
Estimated Impact72
Family? (F = Feedback message, R = changed R code, M = changed R Module, P = changed Parameters, D = changed Data)
-       [(Partial) Autocorrelation Function] [] [2014-10-19 21:02:04] [12470bd120139be5e23c611c04d9c0dc] [Current]
Feedback Forum

Post a new message
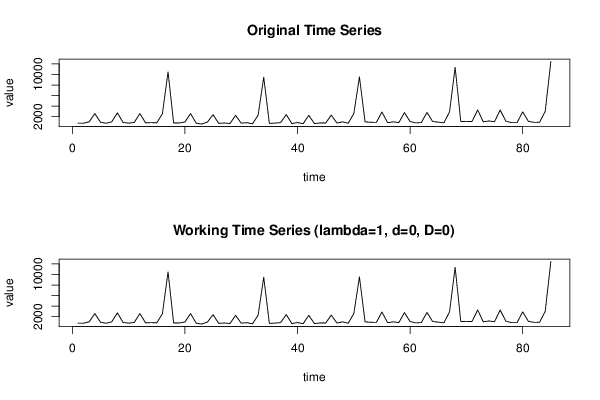
Dataseries X:
790
766
1040
2596
949
758
1023
2730
921
775
907
2603
835
871
836
2542
10471
789
811
996
2596
778
603
990
2371
735
800
706
2241
766
870
647
2283
9491
726
784
884
2394
696
893
674
2263
703
799
793
2295
799
1022
758
2579
9531
1021
944
915
2880
864
1022
891
2777
1087
822
890
2799
1092
967
833
2892
11348
1104
1063
1103
3270
1039
1185
1047
3271
1155
878
879
2912
1133
920
943
2996
12449


Summary of computational transaction
Raw Inputview raw input (R code)
Raw Outputview raw output of R engine
Computing time2 seconds
R Server'Sir Maurice George Kendall' @ kendall.wessa.net

\begin{tabular}{lllllllll}
\hline
Summary of computational transaction \tabularnewline
Raw Input & view raw input (R code)  \tabularnewline
Raw Output & view raw output of R engine  \tabularnewline
Computing time & 2 seconds \tabularnewline
R Server & 'Sir Maurice George Kendall' @ kendall.wessa.net \tabularnewline
\hline
\end{tabular}
%Source: https://freestatistics.org/blog/index.php?pk=243794&T=0

[TABLE]
[ROW][C]Summary of computational transaction[/C][/ROW]
[ROW][C]Raw Input[/C][C]view raw input (R code) [/C][/ROW]
[ROW][C]Raw Output[/C][C]view raw output of R engine [/C][/ROW]
[ROW][C]Computing time[/C][C]2 seconds[/C][/ROW]
[ROW][C]R Server[/C][C]'Sir Maurice George Kendall' @ kendall.wessa.net[/C][/ROW]
[/TABLE]
Source: https://freestatistics.org/blog/index.php?pk=243794&T=0

Globally Unique Identifier (entire table): ba.freestatistics.org/blog/index.php?pk=243794&T=0

As an alternative you can also use a QR Code:  

The GUIDs for individual cells are displayed in the table below:

Summary of computational transaction
Raw Inputview raw input (R code)
Raw Outputview raw output of R engine
Computing time2 seconds
R Server'Sir Maurice George Kendall' @ kendall.wessa.net


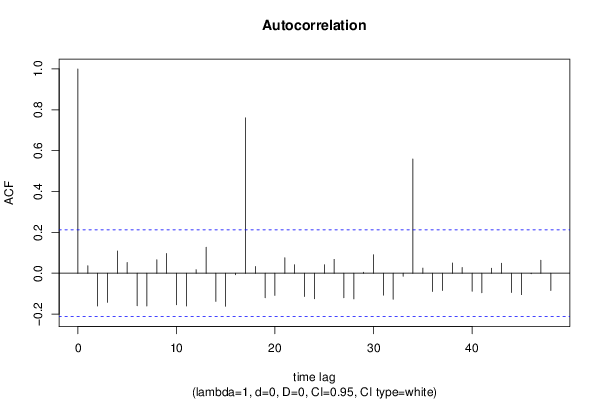
Autocorrelation Function
Time lag kACF(k)T-STATP-value
10.0369140.34030.367223
2-0.160144-1.47650.071759
3-0.142854-1.3170.095682
40.1090451.00530.158793
50.0529420.48810.313367
6-0.158936-1.46530.073262
7-0.160772-1.48220.070986
80.0663840.6120.271075
90.0962790.88760.188617
10-0.154026-1.42010.079625
11-0.160282-1.47770.071589
120.0174850.16120.436158
130.1274861.17540.121565
14-0.137883-1.27120.10356
15-0.161706-1.49090.06985
16-0.00792-0.0730.47098
170.7606187.01260
180.0328170.30260.381483
19-0.120009-1.10640.135831
20-0.108499-1.00030.159999
210.0760050.70070.242693
220.0415990.38350.351144
23-0.114153-1.05240.147791
24-0.125149-1.15380.125905
250.0417250.38470.350715
260.067980.62670.266254
27-0.120285-1.1090.135284
28-0.125713-1.1590.124848
290.0047440.04370.482609
300.0908980.8380.20218
31-0.107354-0.98980.162552
32-0.12714-1.17220.122202
33-0.014547-0.13410.446815
340.5595745.1591e-06
350.0249030.22960.40948
36-0.089754-0.82750.205139
37-0.084684-0.78080.218559
380.0503320.4640.321902
390.0276760.25520.399609
40-0.087997-0.81130.209733
41-0.095703-0.88230.190042
420.0246060.22690.41054
430.049180.45340.325701
44-0.094135-0.86790.193952
45-0.104823-0.96640.168288
46-0.002396-0.02210.491214
470.063540.58580.279778
48-0.084485-0.77890.219096

\begin{tabular}{lllllllll}
\hline
Autocorrelation Function \tabularnewline
Time lag k & ACF(k) & T-STAT & P-value \tabularnewline
1 & 0.036914 & 0.3403 & 0.367223 \tabularnewline
2 & -0.160144 & -1.4765 & 0.071759 \tabularnewline
3 & -0.142854 & -1.317 & 0.095682 \tabularnewline
4 & 0.109045 & 1.0053 & 0.158793 \tabularnewline
5 & 0.052942 & 0.4881 & 0.313367 \tabularnewline
6 & -0.158936 & -1.4653 & 0.073262 \tabularnewline
7 & -0.160772 & -1.4822 & 0.070986 \tabularnewline
8 & 0.066384 & 0.612 & 0.271075 \tabularnewline
9 & 0.096279 & 0.8876 & 0.188617 \tabularnewline
10 & -0.154026 & -1.4201 & 0.079625 \tabularnewline
11 & -0.160282 & -1.4777 & 0.071589 \tabularnewline
12 & 0.017485 & 0.1612 & 0.436158 \tabularnewline
13 & 0.127486 & 1.1754 & 0.121565 \tabularnewline
14 & -0.137883 & -1.2712 & 0.10356 \tabularnewline
15 & -0.161706 & -1.4909 & 0.06985 \tabularnewline
16 & -0.00792 & -0.073 & 0.47098 \tabularnewline
17 & 0.760618 & 7.0126 & 0 \tabularnewline
18 & 0.032817 & 0.3026 & 0.381483 \tabularnewline
19 & -0.120009 & -1.1064 & 0.135831 \tabularnewline
20 & -0.108499 & -1.0003 & 0.159999 \tabularnewline
21 & 0.076005 & 0.7007 & 0.242693 \tabularnewline
22 & 0.041599 & 0.3835 & 0.351144 \tabularnewline
23 & -0.114153 & -1.0524 & 0.147791 \tabularnewline
24 & -0.125149 & -1.1538 & 0.125905 \tabularnewline
25 & 0.041725 & 0.3847 & 0.350715 \tabularnewline
26 & 0.06798 & 0.6267 & 0.266254 \tabularnewline
27 & -0.120285 & -1.109 & 0.135284 \tabularnewline
28 & -0.125713 & -1.159 & 0.124848 \tabularnewline
29 & 0.004744 & 0.0437 & 0.482609 \tabularnewline
30 & 0.090898 & 0.838 & 0.20218 \tabularnewline
31 & -0.107354 & -0.9898 & 0.162552 \tabularnewline
32 & -0.12714 & -1.1722 & 0.122202 \tabularnewline
33 & -0.014547 & -0.1341 & 0.446815 \tabularnewline
34 & 0.559574 & 5.159 & 1e-06 \tabularnewline
35 & 0.024903 & 0.2296 & 0.40948 \tabularnewline
36 & -0.089754 & -0.8275 & 0.205139 \tabularnewline
37 & -0.084684 & -0.7808 & 0.218559 \tabularnewline
38 & 0.050332 & 0.464 & 0.321902 \tabularnewline
39 & 0.027676 & 0.2552 & 0.399609 \tabularnewline
40 & -0.087997 & -0.8113 & 0.209733 \tabularnewline
41 & -0.095703 & -0.8823 & 0.190042 \tabularnewline
42 & 0.024606 & 0.2269 & 0.41054 \tabularnewline
43 & 0.04918 & 0.4534 & 0.325701 \tabularnewline
44 & -0.094135 & -0.8679 & 0.193952 \tabularnewline
45 & -0.104823 & -0.9664 & 0.168288 \tabularnewline
46 & -0.002396 & -0.0221 & 0.491214 \tabularnewline
47 & 0.06354 & 0.5858 & 0.279778 \tabularnewline
48 & -0.084485 & -0.7789 & 0.219096 \tabularnewline
\hline
\end{tabular}
%Source: https://freestatistics.org/blog/index.php?pk=243794&T=1

[TABLE]
[ROW][C]Autocorrelation Function[/C][/ROW]
[ROW][C]Time lag k[/C][C]ACF(k)[/C][C]T-STAT[/C][C]P-value[/C][/ROW]
[ROW][C]1[/C][C]0.036914[/C][C]0.3403[/C][C]0.367223[/C][/ROW]
[ROW][C]2[/C][C]-0.160144[/C][C]-1.4765[/C][C]0.071759[/C][/ROW]
[ROW][C]3[/C][C]-0.142854[/C][C]-1.317[/C][C]0.095682[/C][/ROW]
[ROW][C]4[/C][C]0.109045[/C][C]1.0053[/C][C]0.158793[/C][/ROW]
[ROW][C]5[/C][C]0.052942[/C][C]0.4881[/C][C]0.313367[/C][/ROW]
[ROW][C]6[/C][C]-0.158936[/C][C]-1.4653[/C][C]0.073262[/C][/ROW]
[ROW][C]7[/C][C]-0.160772[/C][C]-1.4822[/C][C]0.070986[/C][/ROW]
[ROW][C]8[/C][C]0.066384[/C][C]0.612[/C][C]0.271075[/C][/ROW]
[ROW][C]9[/C][C]0.096279[/C][C]0.8876[/C][C]0.188617[/C][/ROW]
[ROW][C]10[/C][C]-0.154026[/C][C]-1.4201[/C][C]0.079625[/C][/ROW]
[ROW][C]11[/C][C]-0.160282[/C][C]-1.4777[/C][C]0.071589[/C][/ROW]
[ROW][C]12[/C][C]0.017485[/C][C]0.1612[/C][C]0.436158[/C][/ROW]
[ROW][C]13[/C][C]0.127486[/C][C]1.1754[/C][C]0.121565[/C][/ROW]
[ROW][C]14[/C][C]-0.137883[/C][C]-1.2712[/C][C]0.10356[/C][/ROW]
[ROW][C]15[/C][C]-0.161706[/C][C]-1.4909[/C][C]0.06985[/C][/ROW]
[ROW][C]16[/C][C]-0.00792[/C][C]-0.073[/C][C]0.47098[/C][/ROW]
[ROW][C]17[/C][C]0.760618[/C][C]7.0126[/C][C]0[/C][/ROW]
[ROW][C]18[/C][C]0.032817[/C][C]0.3026[/C][C]0.381483[/C][/ROW]
[ROW][C]19[/C][C]-0.120009[/C][C]-1.1064[/C][C]0.135831[/C][/ROW]
[ROW][C]20[/C][C]-0.108499[/C][C]-1.0003[/C][C]0.159999[/C][/ROW]
[ROW][C]21[/C][C]0.076005[/C][C]0.7007[/C][C]0.242693[/C][/ROW]
[ROW][C]22[/C][C]0.041599[/C][C]0.3835[/C][C]0.351144[/C][/ROW]
[ROW][C]23[/C][C]-0.114153[/C][C]-1.0524[/C][C]0.147791[/C][/ROW]
[ROW][C]24[/C][C]-0.125149[/C][C]-1.1538[/C][C]0.125905[/C][/ROW]
[ROW][C]25[/C][C]0.041725[/C][C]0.3847[/C][C]0.350715[/C][/ROW]
[ROW][C]26[/C][C]0.06798[/C][C]0.6267[/C][C]0.266254[/C][/ROW]
[ROW][C]27[/C][C]-0.120285[/C][C]-1.109[/C][C]0.135284[/C][/ROW]
[ROW][C]28[/C][C]-0.125713[/C][C]-1.159[/C][C]0.124848[/C][/ROW]
[ROW][C]29[/C][C]0.004744[/C][C]0.0437[/C][C]0.482609[/C][/ROW]
[ROW][C]30[/C][C]0.090898[/C][C]0.838[/C][C]0.20218[/C][/ROW]
[ROW][C]31[/C][C]-0.107354[/C][C]-0.9898[/C][C]0.162552[/C][/ROW]
[ROW][C]32[/C][C]-0.12714[/C][C]-1.1722[/C][C]0.122202[/C][/ROW]
[ROW][C]33[/C][C]-0.014547[/C][C]-0.1341[/C][C]0.446815[/C][/ROW]
[ROW][C]34[/C][C]0.559574[/C][C]5.159[/C][C]1e-06[/C][/ROW]
[ROW][C]35[/C][C]0.024903[/C][C]0.2296[/C][C]0.40948[/C][/ROW]
[ROW][C]36[/C][C]-0.089754[/C][C]-0.8275[/C][C]0.205139[/C][/ROW]
[ROW][C]37[/C][C]-0.084684[/C][C]-0.7808[/C][C]0.218559[/C][/ROW]
[ROW][C]38[/C][C]0.050332[/C][C]0.464[/C][C]0.321902[/C][/ROW]
[ROW][C]39[/C][C]0.027676[/C][C]0.2552[/C][C]0.399609[/C][/ROW]
[ROW][C]40[/C][C]-0.087997[/C][C]-0.8113[/C][C]0.209733[/C][/ROW]
[ROW][C]41[/C][C]-0.095703[/C][C]-0.8823[/C][C]0.190042[/C][/ROW]
[ROW][C]42[/C][C]0.024606[/C][C]0.2269[/C][C]0.41054[/C][/ROW]
[ROW][C]43[/C][C]0.04918[/C][C]0.4534[/C][C]0.325701[/C][/ROW]
[ROW][C]44[/C][C]-0.094135[/C][C]-0.8679[/C][C]0.193952[/C][/ROW]
[ROW][C]45[/C][C]-0.104823[/C][C]-0.9664[/C][C]0.168288[/C][/ROW]
[ROW][C]46[/C][C]-0.002396[/C][C]-0.0221[/C][C]0.491214[/C][/ROW]
[ROW][C]47[/C][C]0.06354[/C][C]0.5858[/C][C]0.279778[/C][/ROW]
[ROW][C]48[/C][C]-0.084485[/C][C]-0.7789[/C][C]0.219096[/C][/ROW]
[/TABLE]
Source: https://freestatistics.org/blog/index.php?pk=243794&T=1

Globally Unique Identifier (entire table): ba.freestatistics.org/blog/index.php?pk=243794&T=1

As an alternative you can also use a QR Code:  

The GUIDs for individual cells are displayed in the table below:

Autocorrelation Function
Time lag kACF(k)T-STATP-value
10.0369140.34030.367223
2-0.160144-1.47650.071759
3-0.142854-1.3170.095682
40.1090451.00530.158793
50.0529420.48810.313367
6-0.158936-1.46530.073262
7-0.160772-1.48220.070986
80.0663840.6120.271075
90.0962790.88760.188617
10-0.154026-1.42010.079625
11-0.160282-1.47770.071589
120.0174850.16120.436158
130.1274861.17540.121565
14-0.137883-1.27120.10356
15-0.161706-1.49090.06985
16-0.00792-0.0730.47098
170.7606187.01260
180.0328170.30260.381483
19-0.120009-1.10640.135831
20-0.108499-1.00030.159999
210.0760050.70070.242693
220.0415990.38350.351144
23-0.114153-1.05240.147791
24-0.125149-1.15380.125905
250.0417250.38470.350715
260.067980.62670.266254
27-0.120285-1.1090.135284
28-0.125713-1.1590.124848
290.0047440.04370.482609
300.0908980.8380.20218
31-0.107354-0.98980.162552
32-0.12714-1.17220.122202
33-0.014547-0.13410.446815
340.5595745.1591e-06
350.0249030.22960.40948
36-0.089754-0.82750.205139
37-0.084684-0.78080.218559
380.0503320.4640.321902
390.0276760.25520.399609
40-0.087997-0.81130.209733
41-0.095703-0.88230.190042
420.0246060.22690.41054
430.049180.45340.325701
44-0.094135-0.86790.193952
45-0.104823-0.96640.168288
46-0.002396-0.02210.491214
470.063540.58580.279778
48-0.084485-0.77890.219096


Partial Autocorrelation Function
Time lag kPACF(k)T-STATP-value
10.0369140.34030.367223
2-0.161727-1.4910.069826
3-0.13369-1.23260.110569
40.0963590.88840.188421
50.0040020.03690.485326
6-0.157949-1.45620.074508
7-0.123239-1.13620.129531
80.0329730.3040.380937
90.0081720.07530.47006
10-0.175585-1.61880.054596
11-0.111012-1.02350.154492
12-0.02824-0.26040.397609
13-0.003934-0.03630.485574
14-0.200802-1.85130.0338
15-0.129714-1.19590.117531
16-0.072678-0.67010.252319
170.7099846.54570
18-0.098805-0.91090.182452
190.0772350.71210.239186
200.047190.43510.332308
21-0.06103-0.56270.287572
22-0.080362-0.74090.230397
230.0935830.86280.19534
240.0256930.23690.406662
25-0.028375-0.26160.397129
26-0.089823-0.82810.204959
270.0724960.66840.252852
280.0011580.01070.495754
29-0.00342-0.03150.487459
30-0.082798-0.76340.223683
310.0842460.77670.219742
32-0.009734-0.08970.46435
330.0196440.18110.428357
34-0.030026-0.27680.391294
350.0403060.37160.355558
36-0.062174-0.57320.284005
37-0.01936-0.17850.429382
38-0.001238-0.01140.495458
390.0222760.20540.418887
40-0.070016-0.64550.260167
410.0058430.05390.478583
42-0.016987-0.15660.43796
430.0195430.18020.428721
44-0.047414-0.43710.331562
45-0.002921-0.02690.489288
46-0.016251-0.14980.440627
47-0.003012-0.02780.488955
48-0.040413-0.37260.355191

\begin{tabular}{lllllllll}
\hline
Partial Autocorrelation Function \tabularnewline
Time lag k & PACF(k) & T-STAT & P-value \tabularnewline
1 & 0.036914 & 0.3403 & 0.367223 \tabularnewline
2 & -0.161727 & -1.491 & 0.069826 \tabularnewline
3 & -0.13369 & -1.2326 & 0.110569 \tabularnewline
4 & 0.096359 & 0.8884 & 0.188421 \tabularnewline
5 & 0.004002 & 0.0369 & 0.485326 \tabularnewline
6 & -0.157949 & -1.4562 & 0.074508 \tabularnewline
7 & -0.123239 & -1.1362 & 0.129531 \tabularnewline
8 & 0.032973 & 0.304 & 0.380937 \tabularnewline
9 & 0.008172 & 0.0753 & 0.47006 \tabularnewline
10 & -0.175585 & -1.6188 & 0.054596 \tabularnewline
11 & -0.111012 & -1.0235 & 0.154492 \tabularnewline
12 & -0.02824 & -0.2604 & 0.397609 \tabularnewline
13 & -0.003934 & -0.0363 & 0.485574 \tabularnewline
14 & -0.200802 & -1.8513 & 0.0338 \tabularnewline
15 & -0.129714 & -1.1959 & 0.117531 \tabularnewline
16 & -0.072678 & -0.6701 & 0.252319 \tabularnewline
17 & 0.709984 & 6.5457 & 0 \tabularnewline
18 & -0.098805 & -0.9109 & 0.182452 \tabularnewline
19 & 0.077235 & 0.7121 & 0.239186 \tabularnewline
20 & 0.04719 & 0.4351 & 0.332308 \tabularnewline
21 & -0.06103 & -0.5627 & 0.287572 \tabularnewline
22 & -0.080362 & -0.7409 & 0.230397 \tabularnewline
23 & 0.093583 & 0.8628 & 0.19534 \tabularnewline
24 & 0.025693 & 0.2369 & 0.406662 \tabularnewline
25 & -0.028375 & -0.2616 & 0.397129 \tabularnewline
26 & -0.089823 & -0.8281 & 0.204959 \tabularnewline
27 & 0.072496 & 0.6684 & 0.252852 \tabularnewline
28 & 0.001158 & 0.0107 & 0.495754 \tabularnewline
29 & -0.00342 & -0.0315 & 0.487459 \tabularnewline
30 & -0.082798 & -0.7634 & 0.223683 \tabularnewline
31 & 0.084246 & 0.7767 & 0.219742 \tabularnewline
32 & -0.009734 & -0.0897 & 0.46435 \tabularnewline
33 & 0.019644 & 0.1811 & 0.428357 \tabularnewline
34 & -0.030026 & -0.2768 & 0.391294 \tabularnewline
35 & 0.040306 & 0.3716 & 0.355558 \tabularnewline
36 & -0.062174 & -0.5732 & 0.284005 \tabularnewline
37 & -0.01936 & -0.1785 & 0.429382 \tabularnewline
38 & -0.001238 & -0.0114 & 0.495458 \tabularnewline
39 & 0.022276 & 0.2054 & 0.418887 \tabularnewline
40 & -0.070016 & -0.6455 & 0.260167 \tabularnewline
41 & 0.005843 & 0.0539 & 0.478583 \tabularnewline
42 & -0.016987 & -0.1566 & 0.43796 \tabularnewline
43 & 0.019543 & 0.1802 & 0.428721 \tabularnewline
44 & -0.047414 & -0.4371 & 0.331562 \tabularnewline
45 & -0.002921 & -0.0269 & 0.489288 \tabularnewline
46 & -0.016251 & -0.1498 & 0.440627 \tabularnewline
47 & -0.003012 & -0.0278 & 0.488955 \tabularnewline
48 & -0.040413 & -0.3726 & 0.355191 \tabularnewline
\hline
\end{tabular}
%Source: https://freestatistics.org/blog/index.php?pk=243794&T=2

[TABLE]
[ROW][C]Partial Autocorrelation Function[/C][/ROW]
[ROW][C]Time lag k[/C][C]PACF(k)[/C][C]T-STAT[/C][C]P-value[/C][/ROW]
[ROW][C]1[/C][C]0.036914[/C][C]0.3403[/C][C]0.367223[/C][/ROW]
[ROW][C]2[/C][C]-0.161727[/C][C]-1.491[/C][C]0.069826[/C][/ROW]
[ROW][C]3[/C][C]-0.13369[/C][C]-1.2326[/C][C]0.110569[/C][/ROW]
[ROW][C]4[/C][C]0.096359[/C][C]0.8884[/C][C]0.188421[/C][/ROW]
[ROW][C]5[/C][C]0.004002[/C][C]0.0369[/C][C]0.485326[/C][/ROW]
[ROW][C]6[/C][C]-0.157949[/C][C]-1.4562[/C][C]0.074508[/C][/ROW]
[ROW][C]7[/C][C]-0.123239[/C][C]-1.1362[/C][C]0.129531[/C][/ROW]
[ROW][C]8[/C][C]0.032973[/C][C]0.304[/C][C]0.380937[/C][/ROW]
[ROW][C]9[/C][C]0.008172[/C][C]0.0753[/C][C]0.47006[/C][/ROW]
[ROW][C]10[/C][C]-0.175585[/C][C]-1.6188[/C][C]0.054596[/C][/ROW]
[ROW][C]11[/C][C]-0.111012[/C][C]-1.0235[/C][C]0.154492[/C][/ROW]
[ROW][C]12[/C][C]-0.02824[/C][C]-0.2604[/C][C]0.397609[/C][/ROW]
[ROW][C]13[/C][C]-0.003934[/C][C]-0.0363[/C][C]0.485574[/C][/ROW]
[ROW][C]14[/C][C]-0.200802[/C][C]-1.8513[/C][C]0.0338[/C][/ROW]
[ROW][C]15[/C][C]-0.129714[/C][C]-1.1959[/C][C]0.117531[/C][/ROW]
[ROW][C]16[/C][C]-0.072678[/C][C]-0.6701[/C][C]0.252319[/C][/ROW]
[ROW][C]17[/C][C]0.709984[/C][C]6.5457[/C][C]0[/C][/ROW]
[ROW][C]18[/C][C]-0.098805[/C][C]-0.9109[/C][C]0.182452[/C][/ROW]
[ROW][C]19[/C][C]0.077235[/C][C]0.7121[/C][C]0.239186[/C][/ROW]
[ROW][C]20[/C][C]0.04719[/C][C]0.4351[/C][C]0.332308[/C][/ROW]
[ROW][C]21[/C][C]-0.06103[/C][C]-0.5627[/C][C]0.287572[/C][/ROW]
[ROW][C]22[/C][C]-0.080362[/C][C]-0.7409[/C][C]0.230397[/C][/ROW]
[ROW][C]23[/C][C]0.093583[/C][C]0.8628[/C][C]0.19534[/C][/ROW]
[ROW][C]24[/C][C]0.025693[/C][C]0.2369[/C][C]0.406662[/C][/ROW]
[ROW][C]25[/C][C]-0.028375[/C][C]-0.2616[/C][C]0.397129[/C][/ROW]
[ROW][C]26[/C][C]-0.089823[/C][C]-0.8281[/C][C]0.204959[/C][/ROW]
[ROW][C]27[/C][C]0.072496[/C][C]0.6684[/C][C]0.252852[/C][/ROW]
[ROW][C]28[/C][C]0.001158[/C][C]0.0107[/C][C]0.495754[/C][/ROW]
[ROW][C]29[/C][C]-0.00342[/C][C]-0.0315[/C][C]0.487459[/C][/ROW]
[ROW][C]30[/C][C]-0.082798[/C][C]-0.7634[/C][C]0.223683[/C][/ROW]
[ROW][C]31[/C][C]0.084246[/C][C]0.7767[/C][C]0.219742[/C][/ROW]
[ROW][C]32[/C][C]-0.009734[/C][C]-0.0897[/C][C]0.46435[/C][/ROW]
[ROW][C]33[/C][C]0.019644[/C][C]0.1811[/C][C]0.428357[/C][/ROW]
[ROW][C]34[/C][C]-0.030026[/C][C]-0.2768[/C][C]0.391294[/C][/ROW]
[ROW][C]35[/C][C]0.040306[/C][C]0.3716[/C][C]0.355558[/C][/ROW]
[ROW][C]36[/C][C]-0.062174[/C][C]-0.5732[/C][C]0.284005[/C][/ROW]
[ROW][C]37[/C][C]-0.01936[/C][C]-0.1785[/C][C]0.429382[/C][/ROW]
[ROW][C]38[/C][C]-0.001238[/C][C]-0.0114[/C][C]0.495458[/C][/ROW]
[ROW][C]39[/C][C]0.022276[/C][C]0.2054[/C][C]0.418887[/C][/ROW]
[ROW][C]40[/C][C]-0.070016[/C][C]-0.6455[/C][C]0.260167[/C][/ROW]
[ROW][C]41[/C][C]0.005843[/C][C]0.0539[/C][C]0.478583[/C][/ROW]
[ROW][C]42[/C][C]-0.016987[/C][C]-0.1566[/C][C]0.43796[/C][/ROW]
[ROW][C]43[/C][C]0.019543[/C][C]0.1802[/C][C]0.428721[/C][/ROW]
[ROW][C]44[/C][C]-0.047414[/C][C]-0.4371[/C][C]0.331562[/C][/ROW]
[ROW][C]45[/C][C]-0.002921[/C][C]-0.0269[/C][C]0.489288[/C][/ROW]
[ROW][C]46[/C][C]-0.016251[/C][C]-0.1498[/C][C]0.440627[/C][/ROW]
[ROW][C]47[/C][C]-0.003012[/C][C]-0.0278[/C][C]0.488955[/C][/ROW]
[ROW][C]48[/C][C]-0.040413[/C][C]-0.3726[/C][C]0.355191[/C][/ROW]
[/TABLE]
Source: https://freestatistics.org/blog/index.php?pk=243794&T=2

Globally Unique Identifier (entire table): ba.freestatistics.org/blog/index.php?pk=243794&T=2

As an alternative you can also use a QR Code:  

The GUIDs for individual cells are displayed in the table below:

Partial Autocorrelation Function
Time lag kPACF(k)T-STATP-value
10.0369140.34030.367223
2-0.161727-1.4910.069826
3-0.13369-1.23260.110569
40.0963590.88840.188421
50.0040020.03690.485326
6-0.157949-1.45620.074508
7-0.123239-1.13620.129531
80.0329730.3040.380937
90.0081720.07530.47006
10-0.175585-1.61880.054596
11-0.111012-1.02350.154492
12-0.02824-0.26040.397609
13-0.003934-0.03630.485574
14-0.200802-1.85130.0338
15-0.129714-1.19590.117531
16-0.072678-0.67010.252319
170.7099846.54570
18-0.098805-0.91090.182452
190.0772350.71210.239186
200.047190.43510.332308
21-0.06103-0.56270.287572
22-0.080362-0.74090.230397
230.0935830.86280.19534
240.0256930.23690.406662
25-0.028375-0.26160.397129
26-0.089823-0.82810.204959
270.0724960.66840.252852
280.0011580.01070.495754
29-0.00342-0.03150.487459
30-0.082798-0.76340.223683
310.0842460.77670.219742
32-0.009734-0.08970.46435
330.0196440.18110.428357
34-0.030026-0.27680.391294
350.0403060.37160.355558
36-0.062174-0.57320.284005
37-0.01936-0.17850.429382
38-0.001238-0.01140.495458
390.0222760.20540.418887
40-0.070016-0.64550.260167
410.0058430.05390.478583
42-0.016987-0.15660.43796
430.0195430.18020.428721
44-0.047414-0.43710.331562
45-0.002921-0.02690.489288
46-0.016251-0.14980.440627
47-0.003012-0.02780.488955
48-0.040413-0.37260.355191


Parameters (Session):
par1 = 48 ; par2 = 1 ; par3 = 0 ; par4 = 0 ; par5 = 12 ; par6 = White Noise ; par7 = 0.95 ;
Parameters (R input):
par1 = 48 ; par2 = 1 ; par3 = 0 ; par4 = 0 ; par5 = 12 ; par6 = White Noise ; par7 = 0.95 ; par8 = ;
R code (references can be found in the software module):
if (par1 == 'Default') {
par1 = 10*log10(length(x))
} else {
par1 <- as.numeric(par1)
}
par2 <- as.numeric(par2)
par3 <- as.numeric(par3)
par4 <- as.numeric(par4)
par5 <- as.numeric(par5)
if (par6 == 'White Noise') par6 <- 'white' else par6 <- 'ma'
par7 <- as.numeric(par7)
if (par8 != '') par8 <- as.numeric(par8)
ox <- x
if (par8 == '') {
if (par2 == 0) {
x <- log(x)
} else {
x <- (x ^ par2 - 1) / par2
}
} else {
x <- log(x,base=par8)
}
if (par3 > 0) x <- diff(x,lag=1,difference=par3)
if (par4 > 0) x <- diff(x,lag=par5,difference=par4)
bitmap(file='picts.png')
op <- par(mfrow=c(2,1))
plot(ox,type='l',main='Original Time Series',xlab='time',ylab='value')
if (par8=='') {
mytitle <- paste('Working Time Series (lambda=',par2,', d=',par3,', D=',par4,')',sep='')
mysub <- paste('(lambda=',par2,', d=',par3,', D=',par4,', CI=', par7, ', CI type=',par6,')',sep='')
} else {
mytitle <- paste('Working Time Series (base=',par8,', d=',par3,', D=',par4,')',sep='')
mysub <- paste('(base=',par8,', d=',par3,', D=',par4,', CI=', par7, ', CI type=',par6,')',sep='')
}
plot(x,type='l', main=mytitle,xlab='time',ylab='value')
par(op)
dev.off()
bitmap(file='pic1.png')
racf <- acf(x, par1, main='Autocorrelation', xlab='time lag', ylab='ACF', ci.type=par6, ci=par7, sub=mysub)
dev.off()
bitmap(file='pic2.png')
rpacf <- pacf(x,par1,main='Partial Autocorrelation',xlab='lags',ylab='PACF',sub=mysub)
dev.off()
(myacf <- c(racf$acf))
(mypacf <- c(rpacf$acf))
lengthx <- length(x)
sqrtn <- sqrt(lengthx)
load(file='createtable')
a<-table.start()
a<-table.row.start(a)
a<-table.element(a,'Autocorrelation Function',4,TRUE)
a<-table.row.end(a)
a<-table.row.start(a)
a<-table.element(a,'Time lag k',header=TRUE)
a<-table.element(a,hyperlink('basics.htm','ACF(k)','click here for more information about the Autocorrelation Function'),header=TRUE)
a<-table.element(a,'T-STAT',header=TRUE)
a<-table.element(a,'P-value',header=TRUE)
a<-table.row.end(a)
for (i in 2:(par1+1)) {
a<-table.row.start(a)
a<-table.element(a,i-1,header=TRUE)
a<-table.element(a,round(myacf[i],6))
mytstat <- myacf[i]*sqrtn
a<-table.element(a,round(mytstat,4))
a<-table.element(a,round(1-pt(abs(mytstat),lengthx),6))
a<-table.row.end(a)
}
a<-table.end(a)
table.save(a,file='mytable.tab')
a<-table.start()
a<-table.row.start(a)
a<-table.element(a,'Partial Autocorrelation Function',4,TRUE)
a<-table.row.end(a)
a<-table.row.start(a)
a<-table.element(a,'Time lag k',header=TRUE)
a<-table.element(a,hyperlink('basics.htm','PACF(k)','click here for more information about the Partial Autocorrelation Function'),header=TRUE)
a<-table.element(a,'T-STAT',header=TRUE)
a<-table.element(a,'P-value',header=TRUE)
a<-table.row.end(a)
for (i in 1:par1) {
a<-table.row.start(a)
a<-table.element(a,i,header=TRUE)
a<-table.element(a,round(mypacf[i],6))
mytstat <- mypacf[i]*sqrtn
a<-table.element(a,round(mytstat,4))
a<-table.element(a,round(1-pt(abs(mytstat),lengthx),6))
a<-table.row.end(a)
}
a<-table.end(a)
table.save(a,file='mytable1.tab')