Free Statistics

of Irreproducible Research!

Author's title

Author*Unverified author*
R Software Modulerwasp_autocorrelation.wasp
Title produced by software(Partial) Autocorrelation Function
Date of computationSun, 19 Oct 2014 21:56:27 +0100
Cite this page as followsStatistical Computations at FreeStatistics.org, Office for Research Development and Education, URL https://freestatistics.org/blog/index.php?v=date/2014/Oct/19/t1413752246qef5uuxpwp6fn7b.htm/, Retrieved Sun, 12 May 2024 05:44:38 +0000
Statistical Computations at FreeStatistics.org, Office for Research Development and Education, URL https://freestatistics.org/blog/index.php?pk=243791, Retrieved Sun, 12 May 2024 05:44:38 +0000
QR Codes:

Original text written by user:
IsPrivate?No (this computation is public)
User-defined keywords
Estimated Impact65
Family? (F = Feedback message, R = changed R code, M = changed R Module, P = changed Parameters, D = changed Data)
-       [(Partial) Autocorrelation Function] [] [2014-10-19 20:56:27] [d1a83db1c928d515dd26931964d56abe] [Current]
Feedback Forum

Post a new message
Dataseries X:
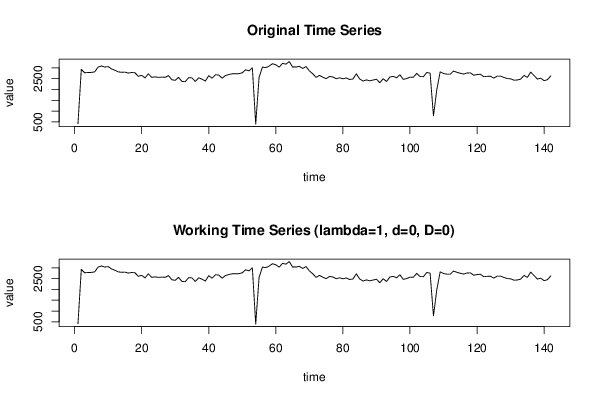
411
2930
2773
2785
2789
2815
3034
3089
3035
3061
2951
2891
2817
2793
2805
2757
2786
2773
2609
2653
2537
2727
2558
2585
2558
2574
2561
2639
2450
2422
2559
2372
2359
2548
2534
2370
2540
2474
2390
2640
2523
2681
2666
2522
2646
2691
2729
2727
2731
2772
2911
2860
3003
397
2550
3038
3011
3082
3192
3143
3033
3211
3170
3293
3039
3038
3067
2974
3059
2859
2727
2560
2652
2571
2499
2601
2577
2498
2539
2493
2533
2461
2488
2724
2486
2389
2442
2402
2436
2477
2311
2498
2369
2576
2604
2543
2679
2469
2503
2571
2565
2743
2598
2590
2787
2753
772
1992
2816
2739
2708
2708
2853
2794
2750
2713
2762
2769
2660
2691
2705
2591
2608
2610
2527
2616
2618
2555
2505
2492
2428
2439
2477
2650
2560
2803
2641
2483
2520
2406
2454
2629


Summary of computational transaction
Raw Inputview raw input (R code)
Raw Outputview raw output of R engine
Computing time2 seconds
R Server'Gertrude Mary Cox' @ cox.wessa.net

\begin{tabular}{lllllllll}
\hline
Summary of computational transaction \tabularnewline
Raw Input & view raw input (R code)  \tabularnewline
Raw Output & view raw output of R engine  \tabularnewline
Computing time & 2 seconds \tabularnewline
R Server & 'Gertrude Mary Cox' @ cox.wessa.net \tabularnewline
\hline
\end{tabular}
%Source: https://freestatistics.org/blog/index.php?pk=243791&T=0

[TABLE]
[ROW][C]Summary of computational transaction[/C][/ROW]
[ROW][C]Raw Input[/C][C]view raw input (R code) [/C][/ROW]
[ROW][C]Raw Output[/C][C]view raw output of R engine [/C][/ROW]
[ROW][C]Computing time[/C][C]2 seconds[/C][/ROW]
[ROW][C]R Server[/C][C]'Gertrude Mary Cox' @ cox.wessa.net[/C][/ROW]
[/TABLE]
Source: https://freestatistics.org/blog/index.php?pk=243791&T=0

Globally Unique Identifier (entire table): ba.freestatistics.org/blog/index.php?pk=243791&T=0

As an alternative you can also use a QR Code:  

The GUIDs for individual cells are displayed in the table below:

Summary of computational transaction
Raw Inputview raw input (R code)
Raw Outputview raw output of R engine
Computing time2 seconds
R Server'Gertrude Mary Cox' @ cox.wessa.net


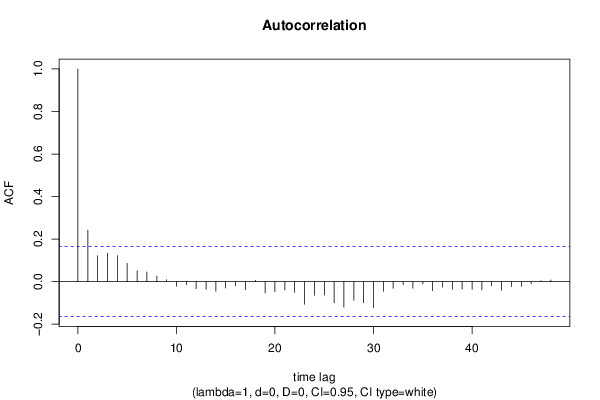
Autocorrelation Function
Time lag kACF(k)T-STATP-value
10.2420992.88490.002263
20.1219461.45320.074194
30.1338751.59530.056433
40.1224081.45870.073433
50.0861541.02660.153167
60.0514570.61320.270368
70.0453540.54040.294867
80.0259650.30940.378733
90.0091390.10890.456715
10-0.021604-0.25740.398606
11-0.014709-0.17530.430555
12-0.032846-0.39140.348044
13-0.035773-0.42630.335271
14-0.045102-0.53750.295898
15-0.030218-0.36010.359656
16-0.019007-0.22650.410571
17-0.03796-0.45230.325855
180.0061070.07280.471043
19-0.052641-0.62730.265737
20-0.047246-0.5630.287162
21-0.03933-0.46870.320014
22-0.049482-0.58960.278182
23-0.105624-1.25870.105111
24-0.064133-0.76420.222997
25-0.062726-0.74750.228007
26-0.099236-1.18250.119486
27-0.119833-1.4280.077747
28-0.087521-1.04290.149376
29-0.099567-1.18650.118707
30-0.122374-1.45830.073489
31-0.045654-0.5440.293639
32-0.03105-0.370.355967
33-0.013807-0.16450.434774
34-0.030542-0.36390.358219
35-0.010504-0.12520.450283
36-0.04215-0.50230.308127
37-0.025611-0.30520.380333
38-0.035726-0.42570.335478
39-0.034908-0.4160.339026
40-0.035995-0.42890.334312
41-0.039161-0.46670.320729
42-0.019171-0.22840.409814
43-0.040727-0.48530.3141
44-0.02301-0.27420.392168
45-0.021488-0.25610.399138
46-0.010007-0.11930.452623
470.0042580.05070.479803
480.0078080.0930.463

\begin{tabular}{lllllllll}
\hline
Autocorrelation Function \tabularnewline
Time lag k & ACF(k) & T-STAT & P-value \tabularnewline
1 & 0.242099 & 2.8849 & 0.002263 \tabularnewline
2 & 0.121946 & 1.4532 & 0.074194 \tabularnewline
3 & 0.133875 & 1.5953 & 0.056433 \tabularnewline
4 & 0.122408 & 1.4587 & 0.073433 \tabularnewline
5 & 0.086154 & 1.0266 & 0.153167 \tabularnewline
6 & 0.051457 & 0.6132 & 0.270368 \tabularnewline
7 & 0.045354 & 0.5404 & 0.294867 \tabularnewline
8 & 0.025965 & 0.3094 & 0.378733 \tabularnewline
9 & 0.009139 & 0.1089 & 0.456715 \tabularnewline
10 & -0.021604 & -0.2574 & 0.398606 \tabularnewline
11 & -0.014709 & -0.1753 & 0.430555 \tabularnewline
12 & -0.032846 & -0.3914 & 0.348044 \tabularnewline
13 & -0.035773 & -0.4263 & 0.335271 \tabularnewline
14 & -0.045102 & -0.5375 & 0.295898 \tabularnewline
15 & -0.030218 & -0.3601 & 0.359656 \tabularnewline
16 & -0.019007 & -0.2265 & 0.410571 \tabularnewline
17 & -0.03796 & -0.4523 & 0.325855 \tabularnewline
18 & 0.006107 & 0.0728 & 0.471043 \tabularnewline
19 & -0.052641 & -0.6273 & 0.265737 \tabularnewline
20 & -0.047246 & -0.563 & 0.287162 \tabularnewline
21 & -0.03933 & -0.4687 & 0.320014 \tabularnewline
22 & -0.049482 & -0.5896 & 0.278182 \tabularnewline
23 & -0.105624 & -1.2587 & 0.105111 \tabularnewline
24 & -0.064133 & -0.7642 & 0.222997 \tabularnewline
25 & -0.062726 & -0.7475 & 0.228007 \tabularnewline
26 & -0.099236 & -1.1825 & 0.119486 \tabularnewline
27 & -0.119833 & -1.428 & 0.077747 \tabularnewline
28 & -0.087521 & -1.0429 & 0.149376 \tabularnewline
29 & -0.099567 & -1.1865 & 0.118707 \tabularnewline
30 & -0.122374 & -1.4583 & 0.073489 \tabularnewline
31 & -0.045654 & -0.544 & 0.293639 \tabularnewline
32 & -0.03105 & -0.37 & 0.355967 \tabularnewline
33 & -0.013807 & -0.1645 & 0.434774 \tabularnewline
34 & -0.030542 & -0.3639 & 0.358219 \tabularnewline
35 & -0.010504 & -0.1252 & 0.450283 \tabularnewline
36 & -0.04215 & -0.5023 & 0.308127 \tabularnewline
37 & -0.025611 & -0.3052 & 0.380333 \tabularnewline
38 & -0.035726 & -0.4257 & 0.335478 \tabularnewline
39 & -0.034908 & -0.416 & 0.339026 \tabularnewline
40 & -0.035995 & -0.4289 & 0.334312 \tabularnewline
41 & -0.039161 & -0.4667 & 0.320729 \tabularnewline
42 & -0.019171 & -0.2284 & 0.409814 \tabularnewline
43 & -0.040727 & -0.4853 & 0.3141 \tabularnewline
44 & -0.02301 & -0.2742 & 0.392168 \tabularnewline
45 & -0.021488 & -0.2561 & 0.399138 \tabularnewline
46 & -0.010007 & -0.1193 & 0.452623 \tabularnewline
47 & 0.004258 & 0.0507 & 0.479803 \tabularnewline
48 & 0.007808 & 0.093 & 0.463 \tabularnewline
\hline
\end{tabular}
%Source: https://freestatistics.org/blog/index.php?pk=243791&T=1

[TABLE]
[ROW][C]Autocorrelation Function[/C][/ROW]
[ROW][C]Time lag k[/C][C]ACF(k)[/C][C]T-STAT[/C][C]P-value[/C][/ROW]
[ROW][C]1[/C][C]0.242099[/C][C]2.8849[/C][C]0.002263[/C][/ROW]
[ROW][C]2[/C][C]0.121946[/C][C]1.4532[/C][C]0.074194[/C][/ROW]
[ROW][C]3[/C][C]0.133875[/C][C]1.5953[/C][C]0.056433[/C][/ROW]
[ROW][C]4[/C][C]0.122408[/C][C]1.4587[/C][C]0.073433[/C][/ROW]
[ROW][C]5[/C][C]0.086154[/C][C]1.0266[/C][C]0.153167[/C][/ROW]
[ROW][C]6[/C][C]0.051457[/C][C]0.6132[/C][C]0.270368[/C][/ROW]
[ROW][C]7[/C][C]0.045354[/C][C]0.5404[/C][C]0.294867[/C][/ROW]
[ROW][C]8[/C][C]0.025965[/C][C]0.3094[/C][C]0.378733[/C][/ROW]
[ROW][C]9[/C][C]0.009139[/C][C]0.1089[/C][C]0.456715[/C][/ROW]
[ROW][C]10[/C][C]-0.021604[/C][C]-0.2574[/C][C]0.398606[/C][/ROW]
[ROW][C]11[/C][C]-0.014709[/C][C]-0.1753[/C][C]0.430555[/C][/ROW]
[ROW][C]12[/C][C]-0.032846[/C][C]-0.3914[/C][C]0.348044[/C][/ROW]
[ROW][C]13[/C][C]-0.035773[/C][C]-0.4263[/C][C]0.335271[/C][/ROW]
[ROW][C]14[/C][C]-0.045102[/C][C]-0.5375[/C][C]0.295898[/C][/ROW]
[ROW][C]15[/C][C]-0.030218[/C][C]-0.3601[/C][C]0.359656[/C][/ROW]
[ROW][C]16[/C][C]-0.019007[/C][C]-0.2265[/C][C]0.410571[/C][/ROW]
[ROW][C]17[/C][C]-0.03796[/C][C]-0.4523[/C][C]0.325855[/C][/ROW]
[ROW][C]18[/C][C]0.006107[/C][C]0.0728[/C][C]0.471043[/C][/ROW]
[ROW][C]19[/C][C]-0.052641[/C][C]-0.6273[/C][C]0.265737[/C][/ROW]
[ROW][C]20[/C][C]-0.047246[/C][C]-0.563[/C][C]0.287162[/C][/ROW]
[ROW][C]21[/C][C]-0.03933[/C][C]-0.4687[/C][C]0.320014[/C][/ROW]
[ROW][C]22[/C][C]-0.049482[/C][C]-0.5896[/C][C]0.278182[/C][/ROW]
[ROW][C]23[/C][C]-0.105624[/C][C]-1.2587[/C][C]0.105111[/C][/ROW]
[ROW][C]24[/C][C]-0.064133[/C][C]-0.7642[/C][C]0.222997[/C][/ROW]
[ROW][C]25[/C][C]-0.062726[/C][C]-0.7475[/C][C]0.228007[/C][/ROW]
[ROW][C]26[/C][C]-0.099236[/C][C]-1.1825[/C][C]0.119486[/C][/ROW]
[ROW][C]27[/C][C]-0.119833[/C][C]-1.428[/C][C]0.077747[/C][/ROW]
[ROW][C]28[/C][C]-0.087521[/C][C]-1.0429[/C][C]0.149376[/C][/ROW]
[ROW][C]29[/C][C]-0.099567[/C][C]-1.1865[/C][C]0.118707[/C][/ROW]
[ROW][C]30[/C][C]-0.122374[/C][C]-1.4583[/C][C]0.073489[/C][/ROW]
[ROW][C]31[/C][C]-0.045654[/C][C]-0.544[/C][C]0.293639[/C][/ROW]
[ROW][C]32[/C][C]-0.03105[/C][C]-0.37[/C][C]0.355967[/C][/ROW]
[ROW][C]33[/C][C]-0.013807[/C][C]-0.1645[/C][C]0.434774[/C][/ROW]
[ROW][C]34[/C][C]-0.030542[/C][C]-0.3639[/C][C]0.358219[/C][/ROW]
[ROW][C]35[/C][C]-0.010504[/C][C]-0.1252[/C][C]0.450283[/C][/ROW]
[ROW][C]36[/C][C]-0.04215[/C][C]-0.5023[/C][C]0.308127[/C][/ROW]
[ROW][C]37[/C][C]-0.025611[/C][C]-0.3052[/C][C]0.380333[/C][/ROW]
[ROW][C]38[/C][C]-0.035726[/C][C]-0.4257[/C][C]0.335478[/C][/ROW]
[ROW][C]39[/C][C]-0.034908[/C][C]-0.416[/C][C]0.339026[/C][/ROW]
[ROW][C]40[/C][C]-0.035995[/C][C]-0.4289[/C][C]0.334312[/C][/ROW]
[ROW][C]41[/C][C]-0.039161[/C][C]-0.4667[/C][C]0.320729[/C][/ROW]
[ROW][C]42[/C][C]-0.019171[/C][C]-0.2284[/C][C]0.409814[/C][/ROW]
[ROW][C]43[/C][C]-0.040727[/C][C]-0.4853[/C][C]0.3141[/C][/ROW]
[ROW][C]44[/C][C]-0.02301[/C][C]-0.2742[/C][C]0.392168[/C][/ROW]
[ROW][C]45[/C][C]-0.021488[/C][C]-0.2561[/C][C]0.399138[/C][/ROW]
[ROW][C]46[/C][C]-0.010007[/C][C]-0.1193[/C][C]0.452623[/C][/ROW]
[ROW][C]47[/C][C]0.004258[/C][C]0.0507[/C][C]0.479803[/C][/ROW]
[ROW][C]48[/C][C]0.007808[/C][C]0.093[/C][C]0.463[/C][/ROW]
[/TABLE]
Source: https://freestatistics.org/blog/index.php?pk=243791&T=1

Globally Unique Identifier (entire table): ba.freestatistics.org/blog/index.php?pk=243791&T=1

As an alternative you can also use a QR Code:  

The GUIDs for individual cells are displayed in the table below:

Autocorrelation Function
Time lag kACF(k)T-STATP-value
10.2420992.88490.002263
20.1219461.45320.074194
30.1338751.59530.056433
40.1224081.45870.073433
50.0861541.02660.153167
60.0514570.61320.270368
70.0453540.54040.294867
80.0259650.30940.378733
90.0091390.10890.456715
10-0.021604-0.25740.398606
11-0.014709-0.17530.430555
12-0.032846-0.39140.348044
13-0.035773-0.42630.335271
14-0.045102-0.53750.295898
15-0.030218-0.36010.359656
16-0.019007-0.22650.410571
17-0.03796-0.45230.325855
180.0061070.07280.471043
19-0.052641-0.62730.265737
20-0.047246-0.5630.287162
21-0.03933-0.46870.320014
22-0.049482-0.58960.278182
23-0.105624-1.25870.105111
24-0.064133-0.76420.222997
25-0.062726-0.74750.228007
26-0.099236-1.18250.119486
27-0.119833-1.4280.077747
28-0.087521-1.04290.149376
29-0.099567-1.18650.118707
30-0.122374-1.45830.073489
31-0.045654-0.5440.293639
32-0.03105-0.370.355967
33-0.013807-0.16450.434774
34-0.030542-0.36390.358219
35-0.010504-0.12520.450283
36-0.04215-0.50230.308127
37-0.025611-0.30520.380333
38-0.035726-0.42570.335478
39-0.034908-0.4160.339026
40-0.035995-0.42890.334312
41-0.039161-0.46670.320729
42-0.019171-0.22840.409814
43-0.040727-0.48530.3141
44-0.02301-0.27420.392168
45-0.021488-0.25610.399138
46-0.010007-0.11930.452623
470.0042580.05070.479803
480.0078080.0930.463


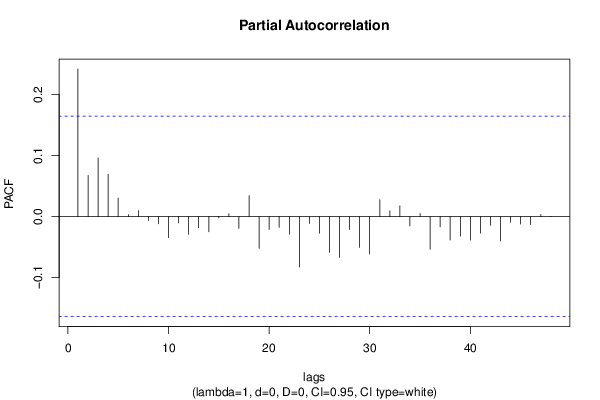
Partial Autocorrelation Function
Time lag kPACF(k)T-STATP-value
10.2420992.88490.002263
20.0672770.80170.212032
30.0960921.14510.127053
40.0691690.82420.205593
50.0301120.35880.360128
60.0030440.03630.485556
70.0093750.11170.455601
8-0.006801-0.0810.467759
9-0.011953-0.14240.443468
10-0.035059-0.41780.338371
11-0.010557-0.12580.450034
12-0.029123-0.3470.364539
13-0.018425-0.21960.413263
14-0.025214-0.30050.382133
15-0.002321-0.02770.488987
160.0045010.05360.478648
17-0.0194-0.23120.408756
180.0341070.40640.342519
19-0.052258-0.62270.267232
20-0.021228-0.2530.400333
21-0.017982-0.21430.415319
22-0.0291-0.34680.36464
23-0.082899-0.98790.162452
24-0.011477-0.13680.445703
25-0.027591-0.32880.371399
26-0.058816-0.70090.242264
27-0.067308-0.80210.211928
28-0.021464-0.25580.399246
29-0.050848-0.60590.272767
30-0.06165-0.73460.231885
310.0274070.32660.372227
320.0091380.10890.456721
330.0173680.2070.418166
34-0.015504-0.18470.426846
350.0046750.05570.477828
36-0.053885-0.64210.260917
37-0.01692-0.20160.420248
38-0.038712-0.46130.322642
39-0.032137-0.3830.351162
40-0.038734-0.46160.32255
41-0.027353-0.32590.372474
42-0.014355-0.17110.432208
43-0.040093-0.47780.316779
44-0.009407-0.11210.455454
45-0.012303-0.14660.441826
46-0.013161-0.15680.437802
470.0032690.0390.484489
48-0.000233-0.00280.498894

\begin{tabular}{lllllllll}
\hline
Partial Autocorrelation Function \tabularnewline
Time lag k & PACF(k) & T-STAT & P-value \tabularnewline
1 & 0.242099 & 2.8849 & 0.002263 \tabularnewline
2 & 0.067277 & 0.8017 & 0.212032 \tabularnewline
3 & 0.096092 & 1.1451 & 0.127053 \tabularnewline
4 & 0.069169 & 0.8242 & 0.205593 \tabularnewline
5 & 0.030112 & 0.3588 & 0.360128 \tabularnewline
6 & 0.003044 & 0.0363 & 0.485556 \tabularnewline
7 & 0.009375 & 0.1117 & 0.455601 \tabularnewline
8 & -0.006801 & -0.081 & 0.467759 \tabularnewline
9 & -0.011953 & -0.1424 & 0.443468 \tabularnewline
10 & -0.035059 & -0.4178 & 0.338371 \tabularnewline
11 & -0.010557 & -0.1258 & 0.450034 \tabularnewline
12 & -0.029123 & -0.347 & 0.364539 \tabularnewline
13 & -0.018425 & -0.2196 & 0.413263 \tabularnewline
14 & -0.025214 & -0.3005 & 0.382133 \tabularnewline
15 & -0.002321 & -0.0277 & 0.488987 \tabularnewline
16 & 0.004501 & 0.0536 & 0.478648 \tabularnewline
17 & -0.0194 & -0.2312 & 0.408756 \tabularnewline
18 & 0.034107 & 0.4064 & 0.342519 \tabularnewline
19 & -0.052258 & -0.6227 & 0.267232 \tabularnewline
20 & -0.021228 & -0.253 & 0.400333 \tabularnewline
21 & -0.017982 & -0.2143 & 0.415319 \tabularnewline
22 & -0.0291 & -0.3468 & 0.36464 \tabularnewline
23 & -0.082899 & -0.9879 & 0.162452 \tabularnewline
24 & -0.011477 & -0.1368 & 0.445703 \tabularnewline
25 & -0.027591 & -0.3288 & 0.371399 \tabularnewline
26 & -0.058816 & -0.7009 & 0.242264 \tabularnewline
27 & -0.067308 & -0.8021 & 0.211928 \tabularnewline
28 & -0.021464 & -0.2558 & 0.399246 \tabularnewline
29 & -0.050848 & -0.6059 & 0.272767 \tabularnewline
30 & -0.06165 & -0.7346 & 0.231885 \tabularnewline
31 & 0.027407 & 0.3266 & 0.372227 \tabularnewline
32 & 0.009138 & 0.1089 & 0.456721 \tabularnewline
33 & 0.017368 & 0.207 & 0.418166 \tabularnewline
34 & -0.015504 & -0.1847 & 0.426846 \tabularnewline
35 & 0.004675 & 0.0557 & 0.477828 \tabularnewline
36 & -0.053885 & -0.6421 & 0.260917 \tabularnewline
37 & -0.01692 & -0.2016 & 0.420248 \tabularnewline
38 & -0.038712 & -0.4613 & 0.322642 \tabularnewline
39 & -0.032137 & -0.383 & 0.351162 \tabularnewline
40 & -0.038734 & -0.4616 & 0.32255 \tabularnewline
41 & -0.027353 & -0.3259 & 0.372474 \tabularnewline
42 & -0.014355 & -0.1711 & 0.432208 \tabularnewline
43 & -0.040093 & -0.4778 & 0.316779 \tabularnewline
44 & -0.009407 & -0.1121 & 0.455454 \tabularnewline
45 & -0.012303 & -0.1466 & 0.441826 \tabularnewline
46 & -0.013161 & -0.1568 & 0.437802 \tabularnewline
47 & 0.003269 & 0.039 & 0.484489 \tabularnewline
48 & -0.000233 & -0.0028 & 0.498894 \tabularnewline
\hline
\end{tabular}
%Source: https://freestatistics.org/blog/index.php?pk=243791&T=2

[TABLE]
[ROW][C]Partial Autocorrelation Function[/C][/ROW]
[ROW][C]Time lag k[/C][C]PACF(k)[/C][C]T-STAT[/C][C]P-value[/C][/ROW]
[ROW][C]1[/C][C]0.242099[/C][C]2.8849[/C][C]0.002263[/C][/ROW]
[ROW][C]2[/C][C]0.067277[/C][C]0.8017[/C][C]0.212032[/C][/ROW]
[ROW][C]3[/C][C]0.096092[/C][C]1.1451[/C][C]0.127053[/C][/ROW]
[ROW][C]4[/C][C]0.069169[/C][C]0.8242[/C][C]0.205593[/C][/ROW]
[ROW][C]5[/C][C]0.030112[/C][C]0.3588[/C][C]0.360128[/C][/ROW]
[ROW][C]6[/C][C]0.003044[/C][C]0.0363[/C][C]0.485556[/C][/ROW]
[ROW][C]7[/C][C]0.009375[/C][C]0.1117[/C][C]0.455601[/C][/ROW]
[ROW][C]8[/C][C]-0.006801[/C][C]-0.081[/C][C]0.467759[/C][/ROW]
[ROW][C]9[/C][C]-0.011953[/C][C]-0.1424[/C][C]0.443468[/C][/ROW]
[ROW][C]10[/C][C]-0.035059[/C][C]-0.4178[/C][C]0.338371[/C][/ROW]
[ROW][C]11[/C][C]-0.010557[/C][C]-0.1258[/C][C]0.450034[/C][/ROW]
[ROW][C]12[/C][C]-0.029123[/C][C]-0.347[/C][C]0.364539[/C][/ROW]
[ROW][C]13[/C][C]-0.018425[/C][C]-0.2196[/C][C]0.413263[/C][/ROW]
[ROW][C]14[/C][C]-0.025214[/C][C]-0.3005[/C][C]0.382133[/C][/ROW]
[ROW][C]15[/C][C]-0.002321[/C][C]-0.0277[/C][C]0.488987[/C][/ROW]
[ROW][C]16[/C][C]0.004501[/C][C]0.0536[/C][C]0.478648[/C][/ROW]
[ROW][C]17[/C][C]-0.0194[/C][C]-0.2312[/C][C]0.408756[/C][/ROW]
[ROW][C]18[/C][C]0.034107[/C][C]0.4064[/C][C]0.342519[/C][/ROW]
[ROW][C]19[/C][C]-0.052258[/C][C]-0.6227[/C][C]0.267232[/C][/ROW]
[ROW][C]20[/C][C]-0.021228[/C][C]-0.253[/C][C]0.400333[/C][/ROW]
[ROW][C]21[/C][C]-0.017982[/C][C]-0.2143[/C][C]0.415319[/C][/ROW]
[ROW][C]22[/C][C]-0.0291[/C][C]-0.3468[/C][C]0.36464[/C][/ROW]
[ROW][C]23[/C][C]-0.082899[/C][C]-0.9879[/C][C]0.162452[/C][/ROW]
[ROW][C]24[/C][C]-0.011477[/C][C]-0.1368[/C][C]0.445703[/C][/ROW]
[ROW][C]25[/C][C]-0.027591[/C][C]-0.3288[/C][C]0.371399[/C][/ROW]
[ROW][C]26[/C][C]-0.058816[/C][C]-0.7009[/C][C]0.242264[/C][/ROW]
[ROW][C]27[/C][C]-0.067308[/C][C]-0.8021[/C][C]0.211928[/C][/ROW]
[ROW][C]28[/C][C]-0.021464[/C][C]-0.2558[/C][C]0.399246[/C][/ROW]
[ROW][C]29[/C][C]-0.050848[/C][C]-0.6059[/C][C]0.272767[/C][/ROW]
[ROW][C]30[/C][C]-0.06165[/C][C]-0.7346[/C][C]0.231885[/C][/ROW]
[ROW][C]31[/C][C]0.027407[/C][C]0.3266[/C][C]0.372227[/C][/ROW]
[ROW][C]32[/C][C]0.009138[/C][C]0.1089[/C][C]0.456721[/C][/ROW]
[ROW][C]33[/C][C]0.017368[/C][C]0.207[/C][C]0.418166[/C][/ROW]
[ROW][C]34[/C][C]-0.015504[/C][C]-0.1847[/C][C]0.426846[/C][/ROW]
[ROW][C]35[/C][C]0.004675[/C][C]0.0557[/C][C]0.477828[/C][/ROW]
[ROW][C]36[/C][C]-0.053885[/C][C]-0.6421[/C][C]0.260917[/C][/ROW]
[ROW][C]37[/C][C]-0.01692[/C][C]-0.2016[/C][C]0.420248[/C][/ROW]
[ROW][C]38[/C][C]-0.038712[/C][C]-0.4613[/C][C]0.322642[/C][/ROW]
[ROW][C]39[/C][C]-0.032137[/C][C]-0.383[/C][C]0.351162[/C][/ROW]
[ROW][C]40[/C][C]-0.038734[/C][C]-0.4616[/C][C]0.32255[/C][/ROW]
[ROW][C]41[/C][C]-0.027353[/C][C]-0.3259[/C][C]0.372474[/C][/ROW]
[ROW][C]42[/C][C]-0.014355[/C][C]-0.1711[/C][C]0.432208[/C][/ROW]
[ROW][C]43[/C][C]-0.040093[/C][C]-0.4778[/C][C]0.316779[/C][/ROW]
[ROW][C]44[/C][C]-0.009407[/C][C]-0.1121[/C][C]0.455454[/C][/ROW]
[ROW][C]45[/C][C]-0.012303[/C][C]-0.1466[/C][C]0.441826[/C][/ROW]
[ROW][C]46[/C][C]-0.013161[/C][C]-0.1568[/C][C]0.437802[/C][/ROW]
[ROW][C]47[/C][C]0.003269[/C][C]0.039[/C][C]0.484489[/C][/ROW]
[ROW][C]48[/C][C]-0.000233[/C][C]-0.0028[/C][C]0.498894[/C][/ROW]
[/TABLE]
Source: https://freestatistics.org/blog/index.php?pk=243791&T=2

Globally Unique Identifier (entire table): ba.freestatistics.org/blog/index.php?pk=243791&T=2

As an alternative you can also use a QR Code:  

The GUIDs for individual cells are displayed in the table below:

Partial Autocorrelation Function
Time lag kPACF(k)T-STATP-value
10.2420992.88490.002263
20.0672770.80170.212032
30.0960921.14510.127053
40.0691690.82420.205593
50.0301120.35880.360128
60.0030440.03630.485556
70.0093750.11170.455601
8-0.006801-0.0810.467759
9-0.011953-0.14240.443468
10-0.035059-0.41780.338371
11-0.010557-0.12580.450034
12-0.029123-0.3470.364539
13-0.018425-0.21960.413263
14-0.025214-0.30050.382133
15-0.002321-0.02770.488987
160.0045010.05360.478648
17-0.0194-0.23120.408756
180.0341070.40640.342519
19-0.052258-0.62270.267232
20-0.021228-0.2530.400333
21-0.017982-0.21430.415319
22-0.0291-0.34680.36464
23-0.082899-0.98790.162452
24-0.011477-0.13680.445703
25-0.027591-0.32880.371399
26-0.058816-0.70090.242264
27-0.067308-0.80210.211928
28-0.021464-0.25580.399246
29-0.050848-0.60590.272767
30-0.06165-0.73460.231885
310.0274070.32660.372227
320.0091380.10890.456721
330.0173680.2070.418166
34-0.015504-0.18470.426846
350.0046750.05570.477828
36-0.053885-0.64210.260917
37-0.01692-0.20160.420248
38-0.038712-0.46130.322642
39-0.032137-0.3830.351162
40-0.038734-0.46160.32255
41-0.027353-0.32590.372474
42-0.014355-0.17110.432208
43-0.040093-0.47780.316779
44-0.009407-0.11210.455454
45-0.012303-0.14660.441826
46-0.013161-0.15680.437802
470.0032690.0390.484489
48-0.000233-0.00280.498894


Parameters (Session):
par1 = 48 ; par2 = 1 ; par3 = 0 ; par4 = 0 ; par5 = 12 ; par6 = White Noise ; par7 = 0.95 ;
Parameters (R input):
par1 = 48 ; par2 = 1 ; par3 = 0 ; par4 = 0 ; par5 = 12 ; par6 = White Noise ; par7 = 0.95 ; par8 = ;
R code (references can be found in the software module):
if (par1 == 'Default') {
par1 = 10*log10(length(x))
} else {
par1 <- as.numeric(par1)
}
par2 <- as.numeric(par2)
par3 <- as.numeric(par3)
par4 <- as.numeric(par4)
par5 <- as.numeric(par5)
if (par6 == 'White Noise') par6 <- 'white' else par6 <- 'ma'
par7 <- as.numeric(par7)
if (par8 != '') par8 <- as.numeric(par8)
ox <- x
if (par8 == '') {
if (par2 == 0) {
x <- log(x)
} else {
x <- (x ^ par2 - 1) / par2
}
} else {
x <- log(x,base=par8)
}
if (par3 > 0) x <- diff(x,lag=1,difference=par3)
if (par4 > 0) x <- diff(x,lag=par5,difference=par4)
bitmap(file='picts.png')
op <- par(mfrow=c(2,1))
plot(ox,type='l',main='Original Time Series',xlab='time',ylab='value')
if (par8=='') {
mytitle <- paste('Working Time Series (lambda=',par2,', d=',par3,', D=',par4,')',sep='')
mysub <- paste('(lambda=',par2,', d=',par3,', D=',par4,', CI=', par7, ', CI type=',par6,')',sep='')
} else {
mytitle <- paste('Working Time Series (base=',par8,', d=',par3,', D=',par4,')',sep='')
mysub <- paste('(base=',par8,', d=',par3,', D=',par4,', CI=', par7, ', CI type=',par6,')',sep='')
}
plot(x,type='l', main=mytitle,xlab='time',ylab='value')
par(op)
dev.off()
bitmap(file='pic1.png')
racf <- acf(x, par1, main='Autocorrelation', xlab='time lag', ylab='ACF', ci.type=par6, ci=par7, sub=mysub)
dev.off()
bitmap(file='pic2.png')
rpacf <- pacf(x,par1,main='Partial Autocorrelation',xlab='lags',ylab='PACF',sub=mysub)
dev.off()
(myacf <- c(racf$acf))
(mypacf <- c(rpacf$acf))
lengthx <- length(x)
sqrtn <- sqrt(lengthx)
load(file='createtable')
a<-table.start()
a<-table.row.start(a)
a<-table.element(a,'Autocorrelation Function',4,TRUE)
a<-table.row.end(a)
a<-table.row.start(a)
a<-table.element(a,'Time lag k',header=TRUE)
a<-table.element(a,hyperlink('basics.htm','ACF(k)','click here for more information about the Autocorrelation Function'),header=TRUE)
a<-table.element(a,'T-STAT',header=TRUE)
a<-table.element(a,'P-value',header=TRUE)
a<-table.row.end(a)
for (i in 2:(par1+1)) {
a<-table.row.start(a)
a<-table.element(a,i-1,header=TRUE)
a<-table.element(a,round(myacf[i],6))
mytstat <- myacf[i]*sqrtn
a<-table.element(a,round(mytstat,4))
a<-table.element(a,round(1-pt(abs(mytstat),lengthx),6))
a<-table.row.end(a)
}
a<-table.end(a)
table.save(a,file='mytable.tab')
a<-table.start()
a<-table.row.start(a)
a<-table.element(a,'Partial Autocorrelation Function',4,TRUE)
a<-table.row.end(a)
a<-table.row.start(a)
a<-table.element(a,'Time lag k',header=TRUE)
a<-table.element(a,hyperlink('basics.htm','PACF(k)','click here for more information about the Partial Autocorrelation Function'),header=TRUE)
a<-table.element(a,'T-STAT',header=TRUE)
a<-table.element(a,'P-value',header=TRUE)
a<-table.row.end(a)
for (i in 1:par1) {
a<-table.row.start(a)
a<-table.element(a,i,header=TRUE)
a<-table.element(a,round(mypacf[i],6))
mytstat <- mypacf[i]*sqrtn
a<-table.element(a,round(mytstat,4))
a<-table.element(a,round(1-pt(abs(mytstat),lengthx),6))
a<-table.row.end(a)
}
a<-table.end(a)
table.save(a,file='mytable1.tab')