Free Statistics

of Irreproducible Research!

Author's title

Author*Unverified author*
R Software Modulerwasp_autocorrelation.wasp
Title produced by software(Partial) Autocorrelation Function
Date of computationSun, 19 Oct 2014 21:37:17 +0100
Cite this page as followsStatistical Computations at FreeStatistics.org, Office for Research Development and Education, URL https://freestatistics.org/blog/index.php?v=date/2014/Oct/19/t141375108721cs1hc63lvkqzc.htm/, Retrieved Sun, 12 May 2024 05:52:15 +0000
Statistical Computations at FreeStatistics.org, Office for Research Development and Education, URL https://freestatistics.org/blog/index.php?pk=243784, Retrieved Sun, 12 May 2024 05:52:15 +0000
QR Codes:

Original text written by user:
IsPrivate?No (this computation is public)
User-defined keywords
Estimated Impact63
Family? (F = Feedback message, R = changed R code, M = changed R Module, P = changed Parameters, D = changed Data)
-       [(Partial) Autocorrelation Function] [] [2014-10-19 20:37:17] [ce030e64aa9efcfbf032d2aff4cc4bf0] [Current]
Feedback Forum

Post a new message
Dataseries X:
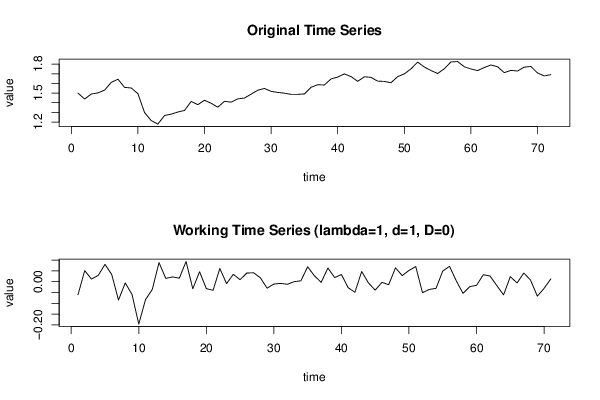
1,5
1,439
1,49
1,502
1,531
1,611
1,644
1,559
1,553
1,494
1,298
1,215
1,179
1,267
1,282
1,304
1,32
1,413
1,38
1,426
1,394
1,354
1,415
1,406
1,44
1,449
1,489
1,53
1,548
1,518
1,507
1,499
1,487
1,487
1,491
1,56
1,587
1,584
1,647
1,666
1,699
1,671
1,622
1,669
1,663
1,624
1,621
1,607
1,671
1,699
1,751
1,821
1,77
1,734
1,703
1,752
1,823
1,827
1,773
1,75
1,733
1,765
1,791
1,773
1,712
1,735
1,729
1,769
1,776
1,709
1,678
1,691


Summary of computational transaction
Raw Inputview raw input (R code)
Raw Outputview raw output of R engine
Computing time2 seconds
R Server'Gertrude Mary Cox' @ cox.wessa.net

\begin{tabular}{lllllllll}
\hline
Summary of computational transaction \tabularnewline
Raw Input & view raw input (R code)  \tabularnewline
Raw Output & view raw output of R engine  \tabularnewline
Computing time & 2 seconds \tabularnewline
R Server & 'Gertrude Mary Cox' @ cox.wessa.net \tabularnewline
\hline
\end{tabular}
%Source: https://freestatistics.org/blog/index.php?pk=243784&T=0

[TABLE]
[ROW][C]Summary of computational transaction[/C][/ROW]
[ROW][C]Raw Input[/C][C]view raw input (R code) [/C][/ROW]
[ROW][C]Raw Output[/C][C]view raw output of R engine [/C][/ROW]
[ROW][C]Computing time[/C][C]2 seconds[/C][/ROW]
[ROW][C]R Server[/C][C]'Gertrude Mary Cox' @ cox.wessa.net[/C][/ROW]
[/TABLE]
Source: https://freestatistics.org/blog/index.php?pk=243784&T=0

Globally Unique Identifier (entire table): ba.freestatistics.org/blog/index.php?pk=243784&T=0

As an alternative you can also use a QR Code:  

The GUIDs for individual cells are displayed in the table below:

Summary of computational transaction
Raw Inputview raw input (R code)
Raw Outputview raw output of R engine
Computing time2 seconds
R Server'Gertrude Mary Cox' @ cox.wessa.net


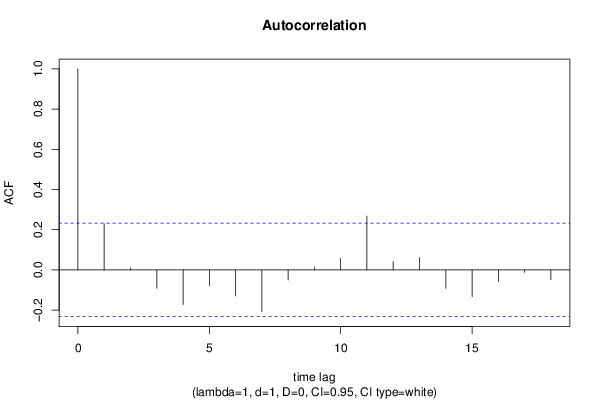
Autocorrelation Function
Time lag kACF(k)T-STATP-value
10.2299141.93730.028345
20.009330.07860.46878
3-0.091546-0.77140.22152
4-0.172234-1.45130.075554
5-0.079288-0.66810.25312
6-0.129235-1.0890.139928
7-0.20818-1.75420.041859
8-0.050075-0.42190.337172
90.013930.11740.453446
100.0577930.4870.313889
110.2675942.25480.013616
120.0422660.35610.361397
130.061410.51740.303226
14-0.091405-0.77020.221872
15-0.132786-1.11890.133482
16-0.057815-0.48720.313824
17-0.011554-0.09740.461358
18-0.049128-0.4140.340076

\begin{tabular}{lllllllll}
\hline
Autocorrelation Function \tabularnewline
Time lag k & ACF(k) & T-STAT & P-value \tabularnewline
1 & 0.229914 & 1.9373 & 0.028345 \tabularnewline
2 & 0.00933 & 0.0786 & 0.46878 \tabularnewline
3 & -0.091546 & -0.7714 & 0.22152 \tabularnewline
4 & -0.172234 & -1.4513 & 0.075554 \tabularnewline
5 & -0.079288 & -0.6681 & 0.25312 \tabularnewline
6 & -0.129235 & -1.089 & 0.139928 \tabularnewline
7 & -0.20818 & -1.7542 & 0.041859 \tabularnewline
8 & -0.050075 & -0.4219 & 0.337172 \tabularnewline
9 & 0.01393 & 0.1174 & 0.453446 \tabularnewline
10 & 0.057793 & 0.487 & 0.313889 \tabularnewline
11 & 0.267594 & 2.2548 & 0.013616 \tabularnewline
12 & 0.042266 & 0.3561 & 0.361397 \tabularnewline
13 & 0.06141 & 0.5174 & 0.303226 \tabularnewline
14 & -0.091405 & -0.7702 & 0.221872 \tabularnewline
15 & -0.132786 & -1.1189 & 0.133482 \tabularnewline
16 & -0.057815 & -0.4872 & 0.313824 \tabularnewline
17 & -0.011554 & -0.0974 & 0.461358 \tabularnewline
18 & -0.049128 & -0.414 & 0.340076 \tabularnewline
\hline
\end{tabular}
%Source: https://freestatistics.org/blog/index.php?pk=243784&T=1

[TABLE]
[ROW][C]Autocorrelation Function[/C][/ROW]
[ROW][C]Time lag k[/C][C]ACF(k)[/C][C]T-STAT[/C][C]P-value[/C][/ROW]
[ROW][C]1[/C][C]0.229914[/C][C]1.9373[/C][C]0.028345[/C][/ROW]
[ROW][C]2[/C][C]0.00933[/C][C]0.0786[/C][C]0.46878[/C][/ROW]
[ROW][C]3[/C][C]-0.091546[/C][C]-0.7714[/C][C]0.22152[/C][/ROW]
[ROW][C]4[/C][C]-0.172234[/C][C]-1.4513[/C][C]0.075554[/C][/ROW]
[ROW][C]5[/C][C]-0.079288[/C][C]-0.6681[/C][C]0.25312[/C][/ROW]
[ROW][C]6[/C][C]-0.129235[/C][C]-1.089[/C][C]0.139928[/C][/ROW]
[ROW][C]7[/C][C]-0.20818[/C][C]-1.7542[/C][C]0.041859[/C][/ROW]
[ROW][C]8[/C][C]-0.050075[/C][C]-0.4219[/C][C]0.337172[/C][/ROW]
[ROW][C]9[/C][C]0.01393[/C][C]0.1174[/C][C]0.453446[/C][/ROW]
[ROW][C]10[/C][C]0.057793[/C][C]0.487[/C][C]0.313889[/C][/ROW]
[ROW][C]11[/C][C]0.267594[/C][C]2.2548[/C][C]0.013616[/C][/ROW]
[ROW][C]12[/C][C]0.042266[/C][C]0.3561[/C][C]0.361397[/C][/ROW]
[ROW][C]13[/C][C]0.06141[/C][C]0.5174[/C][C]0.303226[/C][/ROW]
[ROW][C]14[/C][C]-0.091405[/C][C]-0.7702[/C][C]0.221872[/C][/ROW]
[ROW][C]15[/C][C]-0.132786[/C][C]-1.1189[/C][C]0.133482[/C][/ROW]
[ROW][C]16[/C][C]-0.057815[/C][C]-0.4872[/C][C]0.313824[/C][/ROW]
[ROW][C]17[/C][C]-0.011554[/C][C]-0.0974[/C][C]0.461358[/C][/ROW]
[ROW][C]18[/C][C]-0.049128[/C][C]-0.414[/C][C]0.340076[/C][/ROW]
[/TABLE]
Source: https://freestatistics.org/blog/index.php?pk=243784&T=1

Globally Unique Identifier (entire table): ba.freestatistics.org/blog/index.php?pk=243784&T=1

As an alternative you can also use a QR Code:  

The GUIDs for individual cells are displayed in the table below:

Autocorrelation Function
Time lag kACF(k)T-STATP-value
10.2299141.93730.028345
20.009330.07860.46878
3-0.091546-0.77140.22152
4-0.172234-1.45130.075554
5-0.079288-0.66810.25312
6-0.129235-1.0890.139928
7-0.20818-1.75420.041859
8-0.050075-0.42190.337172
90.013930.11740.453446
100.0577930.4870.313889
110.2675942.25480.013616
120.0422660.35610.361397
130.061410.51740.303226
14-0.091405-0.77020.221872
15-0.132786-1.11890.133482
16-0.057815-0.48720.313824
17-0.011554-0.09740.461358
18-0.049128-0.4140.340076


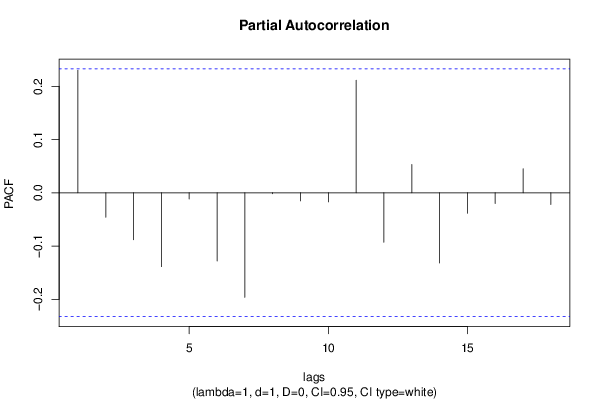
Partial Autocorrelation Function
Time lag kPACF(k)T-STATP-value
10.2299141.93730.028345
2-0.04596-0.38730.349859
3-0.088054-0.7420.230281
4-0.138742-1.16910.123145
5-0.011786-0.09930.460586
6-0.127953-1.07810.142309
7-0.19635-1.65450.051223
8-0.00179-0.01510.494004
9-0.015195-0.1280.449242
10-0.017108-0.14420.442894
110.2114351.78160.039547
12-0.09298-0.78350.217979
130.0530120.44670.328232
14-0.131798-1.11060.135254
15-0.038303-0.32270.373918
16-0.020058-0.1690.433133
170.0453310.3820.351814
18-0.022015-0.18550.426681

\begin{tabular}{lllllllll}
\hline
Partial Autocorrelation Function \tabularnewline
Time lag k & PACF(k) & T-STAT & P-value \tabularnewline
1 & 0.229914 & 1.9373 & 0.028345 \tabularnewline
2 & -0.04596 & -0.3873 & 0.349859 \tabularnewline
3 & -0.088054 & -0.742 & 0.230281 \tabularnewline
4 & -0.138742 & -1.1691 & 0.123145 \tabularnewline
5 & -0.011786 & -0.0993 & 0.460586 \tabularnewline
6 & -0.127953 & -1.0781 & 0.142309 \tabularnewline
7 & -0.19635 & -1.6545 & 0.051223 \tabularnewline
8 & -0.00179 & -0.0151 & 0.494004 \tabularnewline
9 & -0.015195 & -0.128 & 0.449242 \tabularnewline
10 & -0.017108 & -0.1442 & 0.442894 \tabularnewline
11 & 0.211435 & 1.7816 & 0.039547 \tabularnewline
12 & -0.09298 & -0.7835 & 0.217979 \tabularnewline
13 & 0.053012 & 0.4467 & 0.328232 \tabularnewline
14 & -0.131798 & -1.1106 & 0.135254 \tabularnewline
15 & -0.038303 & -0.3227 & 0.373918 \tabularnewline
16 & -0.020058 & -0.169 & 0.433133 \tabularnewline
17 & 0.045331 & 0.382 & 0.351814 \tabularnewline
18 & -0.022015 & -0.1855 & 0.426681 \tabularnewline
\hline
\end{tabular}
%Source: https://freestatistics.org/blog/index.php?pk=243784&T=2

[TABLE]
[ROW][C]Partial Autocorrelation Function[/C][/ROW]
[ROW][C]Time lag k[/C][C]PACF(k)[/C][C]T-STAT[/C][C]P-value[/C][/ROW]
[ROW][C]1[/C][C]0.229914[/C][C]1.9373[/C][C]0.028345[/C][/ROW]
[ROW][C]2[/C][C]-0.04596[/C][C]-0.3873[/C][C]0.349859[/C][/ROW]
[ROW][C]3[/C][C]-0.088054[/C][C]-0.742[/C][C]0.230281[/C][/ROW]
[ROW][C]4[/C][C]-0.138742[/C][C]-1.1691[/C][C]0.123145[/C][/ROW]
[ROW][C]5[/C][C]-0.011786[/C][C]-0.0993[/C][C]0.460586[/C][/ROW]
[ROW][C]6[/C][C]-0.127953[/C][C]-1.0781[/C][C]0.142309[/C][/ROW]
[ROW][C]7[/C][C]-0.19635[/C][C]-1.6545[/C][C]0.051223[/C][/ROW]
[ROW][C]8[/C][C]-0.00179[/C][C]-0.0151[/C][C]0.494004[/C][/ROW]
[ROW][C]9[/C][C]-0.015195[/C][C]-0.128[/C][C]0.449242[/C][/ROW]
[ROW][C]10[/C][C]-0.017108[/C][C]-0.1442[/C][C]0.442894[/C][/ROW]
[ROW][C]11[/C][C]0.211435[/C][C]1.7816[/C][C]0.039547[/C][/ROW]
[ROW][C]12[/C][C]-0.09298[/C][C]-0.7835[/C][C]0.217979[/C][/ROW]
[ROW][C]13[/C][C]0.053012[/C][C]0.4467[/C][C]0.328232[/C][/ROW]
[ROW][C]14[/C][C]-0.131798[/C][C]-1.1106[/C][C]0.135254[/C][/ROW]
[ROW][C]15[/C][C]-0.038303[/C][C]-0.3227[/C][C]0.373918[/C][/ROW]
[ROW][C]16[/C][C]-0.020058[/C][C]-0.169[/C][C]0.433133[/C][/ROW]
[ROW][C]17[/C][C]0.045331[/C][C]0.382[/C][C]0.351814[/C][/ROW]
[ROW][C]18[/C][C]-0.022015[/C][C]-0.1855[/C][C]0.426681[/C][/ROW]
[/TABLE]
Source: https://freestatistics.org/blog/index.php?pk=243784&T=2

Globally Unique Identifier (entire table): ba.freestatistics.org/blog/index.php?pk=243784&T=2

As an alternative you can also use a QR Code:  

The GUIDs for individual cells are displayed in the table below:

Partial Autocorrelation Function
Time lag kPACF(k)T-STATP-value
10.2299141.93730.028345
2-0.04596-0.38730.349859
3-0.088054-0.7420.230281
4-0.138742-1.16910.123145
5-0.011786-0.09930.460586
6-0.127953-1.07810.142309
7-0.19635-1.65450.051223
8-0.00179-0.01510.494004
9-0.015195-0.1280.449242
10-0.017108-0.14420.442894
110.2114351.78160.039547
12-0.09298-0.78350.217979
130.0530120.44670.328232
14-0.131798-1.11060.135254
15-0.038303-0.32270.373918
16-0.020058-0.1690.433133
170.0453310.3820.351814
18-0.022015-0.18550.426681


Parameters (Session):
par1 = Default ; par2 = 1 ; par3 = 1 ; par4 = 0 ; par5 = 12 ; par6 = White Noise ; par7 = 0.95 ;
Parameters (R input):
par1 = Default ; par2 = 1 ; par3 = 1 ; par4 = 0 ; par5 = 12 ; par6 = White Noise ; par7 = 0.95 ; par8 = ;
R code (references can be found in the software module):
if (par1 == 'Default') {
par1 = 10*log10(length(x))
} else {
par1 <- as.numeric(par1)
}
par2 <- as.numeric(par2)
par3 <- as.numeric(par3)
par4 <- as.numeric(par4)
par5 <- as.numeric(par5)
if (par6 == 'White Noise') par6 <- 'white' else par6 <- 'ma'
par7 <- as.numeric(par7)
if (par8 != '') par8 <- as.numeric(par8)
ox <- x
if (par8 == '') {
if (par2 == 0) {
x <- log(x)
} else {
x <- (x ^ par2 - 1) / par2
}
} else {
x <- log(x,base=par8)
}
if (par3 > 0) x <- diff(x,lag=1,difference=par3)
if (par4 > 0) x <- diff(x,lag=par5,difference=par4)
bitmap(file='picts.png')
op <- par(mfrow=c(2,1))
plot(ox,type='l',main='Original Time Series',xlab='time',ylab='value')
if (par8=='') {
mytitle <- paste('Working Time Series (lambda=',par2,', d=',par3,', D=',par4,')',sep='')
mysub <- paste('(lambda=',par2,', d=',par3,', D=',par4,', CI=', par7, ', CI type=',par6,')',sep='')
} else {
mytitle <- paste('Working Time Series (base=',par8,', d=',par3,', D=',par4,')',sep='')
mysub <- paste('(base=',par8,', d=',par3,', D=',par4,', CI=', par7, ', CI type=',par6,')',sep='')
}
plot(x,type='l', main=mytitle,xlab='time',ylab='value')
par(op)
dev.off()
bitmap(file='pic1.png')
racf <- acf(x, par1, main='Autocorrelation', xlab='time lag', ylab='ACF', ci.type=par6, ci=par7, sub=mysub)
dev.off()
bitmap(file='pic2.png')
rpacf <- pacf(x,par1,main='Partial Autocorrelation',xlab='lags',ylab='PACF',sub=mysub)
dev.off()
(myacf <- c(racf$acf))
(mypacf <- c(rpacf$acf))
lengthx <- length(x)
sqrtn <- sqrt(lengthx)
load(file='createtable')
a<-table.start()
a<-table.row.start(a)
a<-table.element(a,'Autocorrelation Function',4,TRUE)
a<-table.row.end(a)
a<-table.row.start(a)
a<-table.element(a,'Time lag k',header=TRUE)
a<-table.element(a,hyperlink('basics.htm','ACF(k)','click here for more information about the Autocorrelation Function'),header=TRUE)
a<-table.element(a,'T-STAT',header=TRUE)
a<-table.element(a,'P-value',header=TRUE)
a<-table.row.end(a)
for (i in 2:(par1+1)) {
a<-table.row.start(a)
a<-table.element(a,i-1,header=TRUE)
a<-table.element(a,round(myacf[i],6))
mytstat <- myacf[i]*sqrtn
a<-table.element(a,round(mytstat,4))
a<-table.element(a,round(1-pt(abs(mytstat),lengthx),6))
a<-table.row.end(a)
}
a<-table.end(a)
table.save(a,file='mytable.tab')
a<-table.start()
a<-table.row.start(a)
a<-table.element(a,'Partial Autocorrelation Function',4,TRUE)
a<-table.row.end(a)
a<-table.row.start(a)
a<-table.element(a,'Time lag k',header=TRUE)
a<-table.element(a,hyperlink('basics.htm','PACF(k)','click here for more information about the Partial Autocorrelation Function'),header=TRUE)
a<-table.element(a,'T-STAT',header=TRUE)
a<-table.element(a,'P-value',header=TRUE)
a<-table.row.end(a)
for (i in 1:par1) {
a<-table.row.start(a)
a<-table.element(a,i,header=TRUE)
a<-table.element(a,round(mypacf[i],6))
mytstat <- mypacf[i]*sqrtn
a<-table.element(a,round(mytstat,4))
a<-table.element(a,round(1-pt(abs(mytstat),lengthx),6))
a<-table.row.end(a)
}
a<-table.end(a)
table.save(a,file='mytable1.tab')