Free Statistics

of Irreproducible Research!

Author's title

Author*Unverified author*
R Software Modulerwasp_autocorrelation.wasp
Title produced by software(Partial) Autocorrelation Function
Date of computationSun, 19 Oct 2014 21:26:22 +0100
Cite this page as followsStatistical Computations at FreeStatistics.org, Office for Research Development and Education, URL https://freestatistics.org/blog/index.php?v=date/2014/Oct/19/t14137504123xfksocd3k3rwn9.htm/, Retrieved Sat, 11 May 2024 13:10:28 +0000
Statistical Computations at FreeStatistics.org, Office for Research Development and Education, URL https://freestatistics.org/blog/index.php?pk=243778, Retrieved Sat, 11 May 2024 13:10:28 +0000
QR Codes:

Original text written by user:
IsPrivate?No (this computation is public)
User-defined keywords
Estimated Impact70
Family? (F = Feedback message, R = changed R code, M = changed R Module, P = changed Parameters, D = changed Data)
-       [(Partial) Autocorrelation Function] [] [2014-10-19 20:26:22] [ce030e64aa9efcfbf032d2aff4cc4bf0] [Current]
Feedback Forum

Post a new message
Dataseries X:
1.5
1.439
1.49
1.502
1.531
1.611
1.644
1.559
1.553
1.494
1.298
1.215
1.179
1.267
1.282
1.304
1.32
1.413
1.38
1.426
1.394
1.354
1.415
1.406
1.44
1.449
1.489
1.53
1.548
1.518
1.507
1.499
1.487
1.487
1.491
1.56
1.587
1.584
1.647
1.666
1.699
1.671
1.622
1.669
1.663
1.624
1.621
1.607
1.671
1.699
1.751
1.821
1.77
1.734
1.703
1.752
1.823
1.827
1.773
1.75
1.733
1.765
1.791
1.773
1.712
1.735
1.729
1.769
1.776
1.709
1.678
1.691


Summary of computational transaction
Raw Inputview raw input (R code)
Raw Outputview raw output of R engine
Computing time1 seconds
R Server'Gertrude Mary Cox' @ cox.wessa.net

\begin{tabular}{lllllllll}
\hline
Summary of computational transaction \tabularnewline
Raw Input & view raw input (R code)  \tabularnewline
Raw Output & view raw output of R engine  \tabularnewline
Computing time & 1 seconds \tabularnewline
R Server & 'Gertrude Mary Cox' @ cox.wessa.net \tabularnewline
\hline
\end{tabular}
%Source: https://freestatistics.org/blog/index.php?pk=243778&T=0

[TABLE]
[ROW][C]Summary of computational transaction[/C][/ROW]
[ROW][C]Raw Input[/C][C]view raw input (R code) [/C][/ROW]
[ROW][C]Raw Output[/C][C]view raw output of R engine [/C][/ROW]
[ROW][C]Computing time[/C][C]1 seconds[/C][/ROW]
[ROW][C]R Server[/C][C]'Gertrude Mary Cox' @ cox.wessa.net[/C][/ROW]
[/TABLE]
Source: https://freestatistics.org/blog/index.php?pk=243778&T=0

Globally Unique Identifier (entire table): ba.freestatistics.org/blog/index.php?pk=243778&T=0

As an alternative you can also use a QR Code:  

The GUIDs for individual cells are displayed in the table below:

Summary of computational transaction
Raw Inputview raw input (R code)
Raw Outputview raw output of R engine
Computing time1 seconds
R Server'Gertrude Mary Cox' @ cox.wessa.net


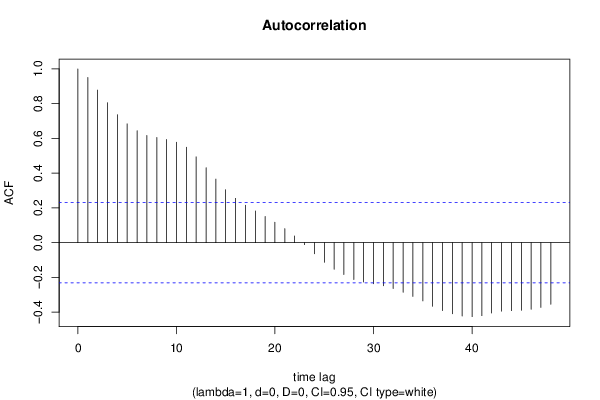
Autocorrelation Function
Time lag kACF(k)T-STATP-value
10.9503628.06410
20.8782037.45180
30.8051226.83170
40.7361656.24660
50.6837845.80210
60.6440395.46490
70.6166285.23231e-06
80.6053195.13631e-06
90.5941275.04132e-06
100.5776694.90173e-06
110.5487764.65657e-06
120.4938164.19023.9e-05
130.4316863.6630.000236
140.3655823.10210.001372
150.3040742.58020.005958
160.2547132.16130.016999
170.2148091.82270.036249
180.1823231.54710.063117
190.1503431.27570.10308
200.1176970.99870.160644
210.0805090.68310.248354
220.0381650.32380.3735
23-0.011735-0.09960.460481
24-0.063857-0.54180.294799
25-0.113384-0.96210.169611
26-0.153692-1.30410.098174
27-0.184-1.56130.06142
28-0.212131-1.80.038026
29-0.226708-1.92370.029174
30-0.236364-2.00560.024328
31-0.247921-2.10370.01945
32-0.264514-2.24450.013938
33-0.285831-2.42540.008901
34-0.309441-2.62570.005278
35-0.33534-2.84550.002886
36-0.365919-3.10490.001361
37-0.391322-3.32050.000707
38-0.409515-3.47480.000435
39-0.422854-3.5880.000302
40-0.426164-3.61610.000276
41-0.420193-3.56550.000325
42-0.405528-3.4410.000484
43-0.394517-3.34760.000649
44-0.391731-3.32390.000699
45-0.389759-3.30720.000736
46-0.383324-3.25260.000871
47-0.372871-3.16390.00114
48-0.354492-3.0080.001811

\begin{tabular}{lllllllll}
\hline
Autocorrelation Function \tabularnewline
Time lag k & ACF(k) & T-STAT & P-value \tabularnewline
1 & 0.950362 & 8.0641 & 0 \tabularnewline
2 & 0.878203 & 7.4518 & 0 \tabularnewline
3 & 0.805122 & 6.8317 & 0 \tabularnewline
4 & 0.736165 & 6.2466 & 0 \tabularnewline
5 & 0.683784 & 5.8021 & 0 \tabularnewline
6 & 0.644039 & 5.4649 & 0 \tabularnewline
7 & 0.616628 & 5.2323 & 1e-06 \tabularnewline
8 & 0.605319 & 5.1363 & 1e-06 \tabularnewline
9 & 0.594127 & 5.0413 & 2e-06 \tabularnewline
10 & 0.577669 & 4.9017 & 3e-06 \tabularnewline
11 & 0.548776 & 4.6565 & 7e-06 \tabularnewline
12 & 0.493816 & 4.1902 & 3.9e-05 \tabularnewline
13 & 0.431686 & 3.663 & 0.000236 \tabularnewline
14 & 0.365582 & 3.1021 & 0.001372 \tabularnewline
15 & 0.304074 & 2.5802 & 0.005958 \tabularnewline
16 & 0.254713 & 2.1613 & 0.016999 \tabularnewline
17 & 0.214809 & 1.8227 & 0.036249 \tabularnewline
18 & 0.182323 & 1.5471 & 0.063117 \tabularnewline
19 & 0.150343 & 1.2757 & 0.10308 \tabularnewline
20 & 0.117697 & 0.9987 & 0.160644 \tabularnewline
21 & 0.080509 & 0.6831 & 0.248354 \tabularnewline
22 & 0.038165 & 0.3238 & 0.3735 \tabularnewline
23 & -0.011735 & -0.0996 & 0.460481 \tabularnewline
24 & -0.063857 & -0.5418 & 0.294799 \tabularnewline
25 & -0.113384 & -0.9621 & 0.169611 \tabularnewline
26 & -0.153692 & -1.3041 & 0.098174 \tabularnewline
27 & -0.184 & -1.5613 & 0.06142 \tabularnewline
28 & -0.212131 & -1.8 & 0.038026 \tabularnewline
29 & -0.226708 & -1.9237 & 0.029174 \tabularnewline
30 & -0.236364 & -2.0056 & 0.024328 \tabularnewline
31 & -0.247921 & -2.1037 & 0.01945 \tabularnewline
32 & -0.264514 & -2.2445 & 0.013938 \tabularnewline
33 & -0.285831 & -2.4254 & 0.008901 \tabularnewline
34 & -0.309441 & -2.6257 & 0.005278 \tabularnewline
35 & -0.33534 & -2.8455 & 0.002886 \tabularnewline
36 & -0.365919 & -3.1049 & 0.001361 \tabularnewline
37 & -0.391322 & -3.3205 & 0.000707 \tabularnewline
38 & -0.409515 & -3.4748 & 0.000435 \tabularnewline
39 & -0.422854 & -3.588 & 0.000302 \tabularnewline
40 & -0.426164 & -3.6161 & 0.000276 \tabularnewline
41 & -0.420193 & -3.5655 & 0.000325 \tabularnewline
42 & -0.405528 & -3.441 & 0.000484 \tabularnewline
43 & -0.394517 & -3.3476 & 0.000649 \tabularnewline
44 & -0.391731 & -3.3239 & 0.000699 \tabularnewline
45 & -0.389759 & -3.3072 & 0.000736 \tabularnewline
46 & -0.383324 & -3.2526 & 0.000871 \tabularnewline
47 & -0.372871 & -3.1639 & 0.00114 \tabularnewline
48 & -0.354492 & -3.008 & 0.001811 \tabularnewline
\hline
\end{tabular}
%Source: https://freestatistics.org/blog/index.php?pk=243778&T=1

[TABLE]
[ROW][C]Autocorrelation Function[/C][/ROW]
[ROW][C]Time lag k[/C][C]ACF(k)[/C][C]T-STAT[/C][C]P-value[/C][/ROW]
[ROW][C]1[/C][C]0.950362[/C][C]8.0641[/C][C]0[/C][/ROW]
[ROW][C]2[/C][C]0.878203[/C][C]7.4518[/C][C]0[/C][/ROW]
[ROW][C]3[/C][C]0.805122[/C][C]6.8317[/C][C]0[/C][/ROW]
[ROW][C]4[/C][C]0.736165[/C][C]6.2466[/C][C]0[/C][/ROW]
[ROW][C]5[/C][C]0.683784[/C][C]5.8021[/C][C]0[/C][/ROW]
[ROW][C]6[/C][C]0.644039[/C][C]5.4649[/C][C]0[/C][/ROW]
[ROW][C]7[/C][C]0.616628[/C][C]5.2323[/C][C]1e-06[/C][/ROW]
[ROW][C]8[/C][C]0.605319[/C][C]5.1363[/C][C]1e-06[/C][/ROW]
[ROW][C]9[/C][C]0.594127[/C][C]5.0413[/C][C]2e-06[/C][/ROW]
[ROW][C]10[/C][C]0.577669[/C][C]4.9017[/C][C]3e-06[/C][/ROW]
[ROW][C]11[/C][C]0.548776[/C][C]4.6565[/C][C]7e-06[/C][/ROW]
[ROW][C]12[/C][C]0.493816[/C][C]4.1902[/C][C]3.9e-05[/C][/ROW]
[ROW][C]13[/C][C]0.431686[/C][C]3.663[/C][C]0.000236[/C][/ROW]
[ROW][C]14[/C][C]0.365582[/C][C]3.1021[/C][C]0.001372[/C][/ROW]
[ROW][C]15[/C][C]0.304074[/C][C]2.5802[/C][C]0.005958[/C][/ROW]
[ROW][C]16[/C][C]0.254713[/C][C]2.1613[/C][C]0.016999[/C][/ROW]
[ROW][C]17[/C][C]0.214809[/C][C]1.8227[/C][C]0.036249[/C][/ROW]
[ROW][C]18[/C][C]0.182323[/C][C]1.5471[/C][C]0.063117[/C][/ROW]
[ROW][C]19[/C][C]0.150343[/C][C]1.2757[/C][C]0.10308[/C][/ROW]
[ROW][C]20[/C][C]0.117697[/C][C]0.9987[/C][C]0.160644[/C][/ROW]
[ROW][C]21[/C][C]0.080509[/C][C]0.6831[/C][C]0.248354[/C][/ROW]
[ROW][C]22[/C][C]0.038165[/C][C]0.3238[/C][C]0.3735[/C][/ROW]
[ROW][C]23[/C][C]-0.011735[/C][C]-0.0996[/C][C]0.460481[/C][/ROW]
[ROW][C]24[/C][C]-0.063857[/C][C]-0.5418[/C][C]0.294799[/C][/ROW]
[ROW][C]25[/C][C]-0.113384[/C][C]-0.9621[/C][C]0.169611[/C][/ROW]
[ROW][C]26[/C][C]-0.153692[/C][C]-1.3041[/C][C]0.098174[/C][/ROW]
[ROW][C]27[/C][C]-0.184[/C][C]-1.5613[/C][C]0.06142[/C][/ROW]
[ROW][C]28[/C][C]-0.212131[/C][C]-1.8[/C][C]0.038026[/C][/ROW]
[ROW][C]29[/C][C]-0.226708[/C][C]-1.9237[/C][C]0.029174[/C][/ROW]
[ROW][C]30[/C][C]-0.236364[/C][C]-2.0056[/C][C]0.024328[/C][/ROW]
[ROW][C]31[/C][C]-0.247921[/C][C]-2.1037[/C][C]0.01945[/C][/ROW]
[ROW][C]32[/C][C]-0.264514[/C][C]-2.2445[/C][C]0.013938[/C][/ROW]
[ROW][C]33[/C][C]-0.285831[/C][C]-2.4254[/C][C]0.008901[/C][/ROW]
[ROW][C]34[/C][C]-0.309441[/C][C]-2.6257[/C][C]0.005278[/C][/ROW]
[ROW][C]35[/C][C]-0.33534[/C][C]-2.8455[/C][C]0.002886[/C][/ROW]
[ROW][C]36[/C][C]-0.365919[/C][C]-3.1049[/C][C]0.001361[/C][/ROW]
[ROW][C]37[/C][C]-0.391322[/C][C]-3.3205[/C][C]0.000707[/C][/ROW]
[ROW][C]38[/C][C]-0.409515[/C][C]-3.4748[/C][C]0.000435[/C][/ROW]
[ROW][C]39[/C][C]-0.422854[/C][C]-3.588[/C][C]0.000302[/C][/ROW]
[ROW][C]40[/C][C]-0.426164[/C][C]-3.6161[/C][C]0.000276[/C][/ROW]
[ROW][C]41[/C][C]-0.420193[/C][C]-3.5655[/C][C]0.000325[/C][/ROW]
[ROW][C]42[/C][C]-0.405528[/C][C]-3.441[/C][C]0.000484[/C][/ROW]
[ROW][C]43[/C][C]-0.394517[/C][C]-3.3476[/C][C]0.000649[/C][/ROW]
[ROW][C]44[/C][C]-0.391731[/C][C]-3.3239[/C][C]0.000699[/C][/ROW]
[ROW][C]45[/C][C]-0.389759[/C][C]-3.3072[/C][C]0.000736[/C][/ROW]
[ROW][C]46[/C][C]-0.383324[/C][C]-3.2526[/C][C]0.000871[/C][/ROW]
[ROW][C]47[/C][C]-0.372871[/C][C]-3.1639[/C][C]0.00114[/C][/ROW]
[ROW][C]48[/C][C]-0.354492[/C][C]-3.008[/C][C]0.001811[/C][/ROW]
[/TABLE]
Source: https://freestatistics.org/blog/index.php?pk=243778&T=1

Globally Unique Identifier (entire table): ba.freestatistics.org/blog/index.php?pk=243778&T=1

As an alternative you can also use a QR Code:  

The GUIDs for individual cells are displayed in the table below:

Autocorrelation Function
Time lag kACF(k)T-STATP-value
10.9503628.06410
20.8782037.45180
30.8051226.83170
40.7361656.24660
50.6837845.80210
60.6440395.46490
70.6166285.23231e-06
80.6053195.13631e-06
90.5941275.04132e-06
100.5776694.90173e-06
110.5487764.65657e-06
120.4938164.19023.9e-05
130.4316863.6630.000236
140.3655823.10210.001372
150.3040742.58020.005958
160.2547132.16130.016999
170.2148091.82270.036249
180.1823231.54710.063117
190.1503431.27570.10308
200.1176970.99870.160644
210.0805090.68310.248354
220.0381650.32380.3735
23-0.011735-0.09960.460481
24-0.063857-0.54180.294799
25-0.113384-0.96210.169611
26-0.153692-1.30410.098174
27-0.184-1.56130.06142
28-0.212131-1.80.038026
29-0.226708-1.92370.029174
30-0.236364-2.00560.024328
31-0.247921-2.10370.01945
32-0.264514-2.24450.013938
33-0.285831-2.42540.008901
34-0.309441-2.62570.005278
35-0.33534-2.84550.002886
36-0.365919-3.10490.001361
37-0.391322-3.32050.000707
38-0.409515-3.47480.000435
39-0.422854-3.5880.000302
40-0.426164-3.61610.000276
41-0.420193-3.56550.000325
42-0.405528-3.4410.000484
43-0.394517-3.34760.000649
44-0.391731-3.32390.000699
45-0.389759-3.30720.000736
46-0.383324-3.25260.000871
47-0.372871-3.16390.00114
48-0.354492-3.0080.001811


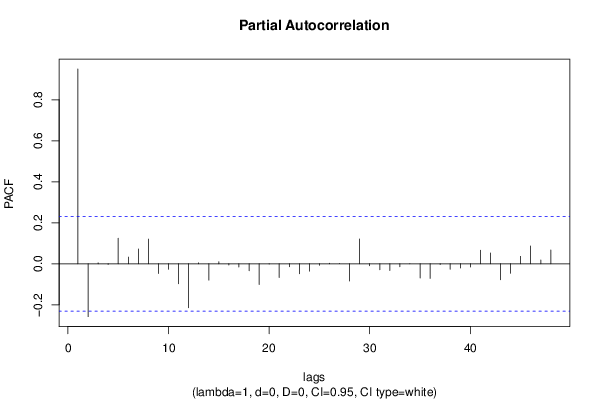
Partial Autocorrelation Function
Time lag kPACF(k)T-STATP-value
10.9503628.06410
2-0.258079-2.18990.015887
30.0042440.0360.485686
4-0.003059-0.0260.489682
50.1247251.05830.146723
60.0323230.27430.39233
70.0722230.61280.270958
80.1200571.01870.155874
9-0.047634-0.40420.343636
10-0.026794-0.22740.410395
11-0.09787-0.83050.204514
12-0.214299-1.81840.036582
130.0044370.03760.485037
14-0.079791-0.6770.250272
150.0096850.08220.467366
16-0.005746-0.04880.480623
17-0.016138-0.13690.445731
18-0.034594-0.29350.384978
19-0.101465-0.8610.19606
20-0.001337-0.01130.495491
21-0.067037-0.56880.285622
22-0.014576-0.12370.450956
23-0.048781-0.41390.340082
24-0.036-0.30550.380444
25-0.007326-0.06220.475303
260.0021080.01790.492888
279.8e-058e-040.499668
28-0.084119-0.71380.238837
290.1211681.02810.153662
30-0.010007-0.08490.466285
31-0.029014-0.24620.403117
32-0.032857-0.27880.3906
33-0.014307-0.12140.451856
34-0.000522-0.00440.498239
35-0.069161-0.58690.27957
36-0.071467-0.60640.273073
37-0.003672-0.03120.487615
38-0.026633-0.2260.410924
39-0.021108-0.17910.429178
40-0.016281-0.13820.445253
410.0657690.55810.289264
420.0524440.4450.328827
43-0.077839-0.66050.255525
44-0.046244-0.39240.347962
450.0359930.30540.380467
460.086560.73450.23252
470.0180490.15310.439354
480.0668840.56750.286059

\begin{tabular}{lllllllll}
\hline
Partial Autocorrelation Function \tabularnewline
Time lag k & PACF(k) & T-STAT & P-value \tabularnewline
1 & 0.950362 & 8.0641 & 0 \tabularnewline
2 & -0.258079 & -2.1899 & 0.015887 \tabularnewline
3 & 0.004244 & 0.036 & 0.485686 \tabularnewline
4 & -0.003059 & -0.026 & 0.489682 \tabularnewline
5 & 0.124725 & 1.0583 & 0.146723 \tabularnewline
6 & 0.032323 & 0.2743 & 0.39233 \tabularnewline
7 & 0.072223 & 0.6128 & 0.270958 \tabularnewline
8 & 0.120057 & 1.0187 & 0.155874 \tabularnewline
9 & -0.047634 & -0.4042 & 0.343636 \tabularnewline
10 & -0.026794 & -0.2274 & 0.410395 \tabularnewline
11 & -0.09787 & -0.8305 & 0.204514 \tabularnewline
12 & -0.214299 & -1.8184 & 0.036582 \tabularnewline
13 & 0.004437 & 0.0376 & 0.485037 \tabularnewline
14 & -0.079791 & -0.677 & 0.250272 \tabularnewline
15 & 0.009685 & 0.0822 & 0.467366 \tabularnewline
16 & -0.005746 & -0.0488 & 0.480623 \tabularnewline
17 & -0.016138 & -0.1369 & 0.445731 \tabularnewline
18 & -0.034594 & -0.2935 & 0.384978 \tabularnewline
19 & -0.101465 & -0.861 & 0.19606 \tabularnewline
20 & -0.001337 & -0.0113 & 0.495491 \tabularnewline
21 & -0.067037 & -0.5688 & 0.285622 \tabularnewline
22 & -0.014576 & -0.1237 & 0.450956 \tabularnewline
23 & -0.048781 & -0.4139 & 0.340082 \tabularnewline
24 & -0.036 & -0.3055 & 0.380444 \tabularnewline
25 & -0.007326 & -0.0622 & 0.475303 \tabularnewline
26 & 0.002108 & 0.0179 & 0.492888 \tabularnewline
27 & 9.8e-05 & 8e-04 & 0.499668 \tabularnewline
28 & -0.084119 & -0.7138 & 0.238837 \tabularnewline
29 & 0.121168 & 1.0281 & 0.153662 \tabularnewline
30 & -0.010007 & -0.0849 & 0.466285 \tabularnewline
31 & -0.029014 & -0.2462 & 0.403117 \tabularnewline
32 & -0.032857 & -0.2788 & 0.3906 \tabularnewline
33 & -0.014307 & -0.1214 & 0.451856 \tabularnewline
34 & -0.000522 & -0.0044 & 0.498239 \tabularnewline
35 & -0.069161 & -0.5869 & 0.27957 \tabularnewline
36 & -0.071467 & -0.6064 & 0.273073 \tabularnewline
37 & -0.003672 & -0.0312 & 0.487615 \tabularnewline
38 & -0.026633 & -0.226 & 0.410924 \tabularnewline
39 & -0.021108 & -0.1791 & 0.429178 \tabularnewline
40 & -0.016281 & -0.1382 & 0.445253 \tabularnewline
41 & 0.065769 & 0.5581 & 0.289264 \tabularnewline
42 & 0.052444 & 0.445 & 0.328827 \tabularnewline
43 & -0.077839 & -0.6605 & 0.255525 \tabularnewline
44 & -0.046244 & -0.3924 & 0.347962 \tabularnewline
45 & 0.035993 & 0.3054 & 0.380467 \tabularnewline
46 & 0.08656 & 0.7345 & 0.23252 \tabularnewline
47 & 0.018049 & 0.1531 & 0.439354 \tabularnewline
48 & 0.066884 & 0.5675 & 0.286059 \tabularnewline
\hline
\end{tabular}
%Source: https://freestatistics.org/blog/index.php?pk=243778&T=2

[TABLE]
[ROW][C]Partial Autocorrelation Function[/C][/ROW]
[ROW][C]Time lag k[/C][C]PACF(k)[/C][C]T-STAT[/C][C]P-value[/C][/ROW]
[ROW][C]1[/C][C]0.950362[/C][C]8.0641[/C][C]0[/C][/ROW]
[ROW][C]2[/C][C]-0.258079[/C][C]-2.1899[/C][C]0.015887[/C][/ROW]
[ROW][C]3[/C][C]0.004244[/C][C]0.036[/C][C]0.485686[/C][/ROW]
[ROW][C]4[/C][C]-0.003059[/C][C]-0.026[/C][C]0.489682[/C][/ROW]
[ROW][C]5[/C][C]0.124725[/C][C]1.0583[/C][C]0.146723[/C][/ROW]
[ROW][C]6[/C][C]0.032323[/C][C]0.2743[/C][C]0.39233[/C][/ROW]
[ROW][C]7[/C][C]0.072223[/C][C]0.6128[/C][C]0.270958[/C][/ROW]
[ROW][C]8[/C][C]0.120057[/C][C]1.0187[/C][C]0.155874[/C][/ROW]
[ROW][C]9[/C][C]-0.047634[/C][C]-0.4042[/C][C]0.343636[/C][/ROW]
[ROW][C]10[/C][C]-0.026794[/C][C]-0.2274[/C][C]0.410395[/C][/ROW]
[ROW][C]11[/C][C]-0.09787[/C][C]-0.8305[/C][C]0.204514[/C][/ROW]
[ROW][C]12[/C][C]-0.214299[/C][C]-1.8184[/C][C]0.036582[/C][/ROW]
[ROW][C]13[/C][C]0.004437[/C][C]0.0376[/C][C]0.485037[/C][/ROW]
[ROW][C]14[/C][C]-0.079791[/C][C]-0.677[/C][C]0.250272[/C][/ROW]
[ROW][C]15[/C][C]0.009685[/C][C]0.0822[/C][C]0.467366[/C][/ROW]
[ROW][C]16[/C][C]-0.005746[/C][C]-0.0488[/C][C]0.480623[/C][/ROW]
[ROW][C]17[/C][C]-0.016138[/C][C]-0.1369[/C][C]0.445731[/C][/ROW]
[ROW][C]18[/C][C]-0.034594[/C][C]-0.2935[/C][C]0.384978[/C][/ROW]
[ROW][C]19[/C][C]-0.101465[/C][C]-0.861[/C][C]0.19606[/C][/ROW]
[ROW][C]20[/C][C]-0.001337[/C][C]-0.0113[/C][C]0.495491[/C][/ROW]
[ROW][C]21[/C][C]-0.067037[/C][C]-0.5688[/C][C]0.285622[/C][/ROW]
[ROW][C]22[/C][C]-0.014576[/C][C]-0.1237[/C][C]0.450956[/C][/ROW]
[ROW][C]23[/C][C]-0.048781[/C][C]-0.4139[/C][C]0.340082[/C][/ROW]
[ROW][C]24[/C][C]-0.036[/C][C]-0.3055[/C][C]0.380444[/C][/ROW]
[ROW][C]25[/C][C]-0.007326[/C][C]-0.0622[/C][C]0.475303[/C][/ROW]
[ROW][C]26[/C][C]0.002108[/C][C]0.0179[/C][C]0.492888[/C][/ROW]
[ROW][C]27[/C][C]9.8e-05[/C][C]8e-04[/C][C]0.499668[/C][/ROW]
[ROW][C]28[/C][C]-0.084119[/C][C]-0.7138[/C][C]0.238837[/C][/ROW]
[ROW][C]29[/C][C]0.121168[/C][C]1.0281[/C][C]0.153662[/C][/ROW]
[ROW][C]30[/C][C]-0.010007[/C][C]-0.0849[/C][C]0.466285[/C][/ROW]
[ROW][C]31[/C][C]-0.029014[/C][C]-0.2462[/C][C]0.403117[/C][/ROW]
[ROW][C]32[/C][C]-0.032857[/C][C]-0.2788[/C][C]0.3906[/C][/ROW]
[ROW][C]33[/C][C]-0.014307[/C][C]-0.1214[/C][C]0.451856[/C][/ROW]
[ROW][C]34[/C][C]-0.000522[/C][C]-0.0044[/C][C]0.498239[/C][/ROW]
[ROW][C]35[/C][C]-0.069161[/C][C]-0.5869[/C][C]0.27957[/C][/ROW]
[ROW][C]36[/C][C]-0.071467[/C][C]-0.6064[/C][C]0.273073[/C][/ROW]
[ROW][C]37[/C][C]-0.003672[/C][C]-0.0312[/C][C]0.487615[/C][/ROW]
[ROW][C]38[/C][C]-0.026633[/C][C]-0.226[/C][C]0.410924[/C][/ROW]
[ROW][C]39[/C][C]-0.021108[/C][C]-0.1791[/C][C]0.429178[/C][/ROW]
[ROW][C]40[/C][C]-0.016281[/C][C]-0.1382[/C][C]0.445253[/C][/ROW]
[ROW][C]41[/C][C]0.065769[/C][C]0.5581[/C][C]0.289264[/C][/ROW]
[ROW][C]42[/C][C]0.052444[/C][C]0.445[/C][C]0.328827[/C][/ROW]
[ROW][C]43[/C][C]-0.077839[/C][C]-0.6605[/C][C]0.255525[/C][/ROW]
[ROW][C]44[/C][C]-0.046244[/C][C]-0.3924[/C][C]0.347962[/C][/ROW]
[ROW][C]45[/C][C]0.035993[/C][C]0.3054[/C][C]0.380467[/C][/ROW]
[ROW][C]46[/C][C]0.08656[/C][C]0.7345[/C][C]0.23252[/C][/ROW]
[ROW][C]47[/C][C]0.018049[/C][C]0.1531[/C][C]0.439354[/C][/ROW]
[ROW][C]48[/C][C]0.066884[/C][C]0.5675[/C][C]0.286059[/C][/ROW]
[/TABLE]
Source: https://freestatistics.org/blog/index.php?pk=243778&T=2

Globally Unique Identifier (entire table): ba.freestatistics.org/blog/index.php?pk=243778&T=2

As an alternative you can also use a QR Code:  

The GUIDs for individual cells are displayed in the table below:

Partial Autocorrelation Function
Time lag kPACF(k)T-STATP-value
10.9503628.06410
2-0.258079-2.18990.015887
30.0042440.0360.485686
4-0.003059-0.0260.489682
50.1247251.05830.146723
60.0323230.27430.39233
70.0722230.61280.270958
80.1200571.01870.155874
9-0.047634-0.40420.343636
10-0.026794-0.22740.410395
11-0.09787-0.83050.204514
12-0.214299-1.81840.036582
130.0044370.03760.485037
14-0.079791-0.6770.250272
150.0096850.08220.467366
16-0.005746-0.04880.480623
17-0.016138-0.13690.445731
18-0.034594-0.29350.384978
19-0.101465-0.8610.19606
20-0.001337-0.01130.495491
21-0.067037-0.56880.285622
22-0.014576-0.12370.450956
23-0.048781-0.41390.340082
24-0.036-0.30550.380444
25-0.007326-0.06220.475303
260.0021080.01790.492888
279.8e-058e-040.499668
28-0.084119-0.71380.238837
290.1211681.02810.153662
30-0.010007-0.08490.466285
31-0.029014-0.24620.403117
32-0.032857-0.27880.3906
33-0.014307-0.12140.451856
34-0.000522-0.00440.498239
35-0.069161-0.58690.27957
36-0.071467-0.60640.273073
37-0.003672-0.03120.487615
38-0.026633-0.2260.410924
39-0.021108-0.17910.429178
40-0.016281-0.13820.445253
410.0657690.55810.289264
420.0524440.4450.328827
43-0.077839-0.66050.255525
44-0.046244-0.39240.347962
450.0359930.30540.380467
460.086560.73450.23252
470.0180490.15310.439354
480.0668840.56750.286059


Parameters (Session):
par1 = 48 ; par2 = 1 ; par3 = 0 ; par4 = 0 ; par5 = 12 ; par6 = White Noise ; par7 = 0.95 ;
Parameters (R input):
par1 = 48 ; par2 = 1 ; par3 = 0 ; par4 = 0 ; par5 = 12 ; par6 = White Noise ; par7 = 0.95 ; par8 = ;
R code (references can be found in the software module):
if (par1 == 'Default') {
par1 = 10*log10(length(x))
} else {
par1 <- as.numeric(par1)
}
par2 <- as.numeric(par2)
par3 <- as.numeric(par3)
par4 <- as.numeric(par4)
par5 <- as.numeric(par5)
if (par6 == 'White Noise') par6 <- 'white' else par6 <- 'ma'
par7 <- as.numeric(par7)
if (par8 != '') par8 <- as.numeric(par8)
ox <- x
if (par8 == '') {
if (par2 == 0) {
x <- log(x)
} else {
x <- (x ^ par2 - 1) / par2
}
} else {
x <- log(x,base=par8)
}
if (par3 > 0) x <- diff(x,lag=1,difference=par3)
if (par4 > 0) x <- diff(x,lag=par5,difference=par4)
bitmap(file='picts.png')
op <- par(mfrow=c(2,1))
plot(ox,type='l',main='Original Time Series',xlab='time',ylab='value')
if (par8=='') {
mytitle <- paste('Working Time Series (lambda=',par2,', d=',par3,', D=',par4,')',sep='')
mysub <- paste('(lambda=',par2,', d=',par3,', D=',par4,', CI=', par7, ', CI type=',par6,')',sep='')
} else {
mytitle <- paste('Working Time Series (base=',par8,', d=',par3,', D=',par4,')',sep='')
mysub <- paste('(base=',par8,', d=',par3,', D=',par4,', CI=', par7, ', CI type=',par6,')',sep='')
}
plot(x,type='l', main=mytitle,xlab='time',ylab='value')
par(op)
dev.off()
bitmap(file='pic1.png')
racf <- acf(x, par1, main='Autocorrelation', xlab='time lag', ylab='ACF', ci.type=par6, ci=par7, sub=mysub)
dev.off()
bitmap(file='pic2.png')
rpacf <- pacf(x,par1,main='Partial Autocorrelation',xlab='lags',ylab='PACF',sub=mysub)
dev.off()
(myacf <- c(racf$acf))
(mypacf <- c(rpacf$acf))
lengthx <- length(x)
sqrtn <- sqrt(lengthx)
load(file='createtable')
a<-table.start()
a<-table.row.start(a)
a<-table.element(a,'Autocorrelation Function',4,TRUE)
a<-table.row.end(a)
a<-table.row.start(a)
a<-table.element(a,'Time lag k',header=TRUE)
a<-table.element(a,hyperlink('basics.htm','ACF(k)','click here for more information about the Autocorrelation Function'),header=TRUE)
a<-table.element(a,'T-STAT',header=TRUE)
a<-table.element(a,'P-value',header=TRUE)
a<-table.row.end(a)
for (i in 2:(par1+1)) {
a<-table.row.start(a)
a<-table.element(a,i-1,header=TRUE)
a<-table.element(a,round(myacf[i],6))
mytstat <- myacf[i]*sqrtn
a<-table.element(a,round(mytstat,4))
a<-table.element(a,round(1-pt(abs(mytstat),lengthx),6))
a<-table.row.end(a)
}
a<-table.end(a)
table.save(a,file='mytable.tab')
a<-table.start()
a<-table.row.start(a)
a<-table.element(a,'Partial Autocorrelation Function',4,TRUE)
a<-table.row.end(a)
a<-table.row.start(a)
a<-table.element(a,'Time lag k',header=TRUE)
a<-table.element(a,hyperlink('basics.htm','PACF(k)','click here for more information about the Partial Autocorrelation Function'),header=TRUE)
a<-table.element(a,'T-STAT',header=TRUE)
a<-table.element(a,'P-value',header=TRUE)
a<-table.row.end(a)
for (i in 1:par1) {
a<-table.row.start(a)
a<-table.element(a,i,header=TRUE)
a<-table.element(a,round(mypacf[i],6))
mytstat <- mypacf[i]*sqrtn
a<-table.element(a,round(mytstat,4))
a<-table.element(a,round(1-pt(abs(mytstat),lengthx),6))
a<-table.row.end(a)
}
a<-table.end(a)
table.save(a,file='mytable1.tab')