Free Statistics

of Irreproducible Research!

Author's title

Author*Unverified author*
R Software Modulerwasp_autocorrelation.wasp
Title produced by software(Partial) Autocorrelation Function
Date of computationSun, 19 Oct 2014 21:02:34 +0100
Cite this page as followsStatistical Computations at FreeStatistics.org, Office for Research Development and Education, URL https://freestatistics.org/blog/index.php?v=date/2014/Oct/19/t14137490497nui9xww5ciug67.htm/, Retrieved Sun, 12 May 2024 09:20:49 +0000
Statistical Computations at FreeStatistics.org, Office for Research Development and Education, URL https://freestatistics.org/blog/index.php?pk=243771, Retrieved Sun, 12 May 2024 09:20:49 +0000
QR Codes:

Original text written by user:
IsPrivate?No (this computation is public)
User-defined keywords
Estimated Impact67
Family? (F = Feedback message, R = changed R code, M = changed R Module, P = changed Parameters, D = changed Data)
-       [(Partial) Autocorrelation Function] [Werkloosheid bij ...] [2014-10-19 20:02:34] [be7d2a6a6c016378f31f309d9b06695b] [Current]
Feedback Forum

Post a new message
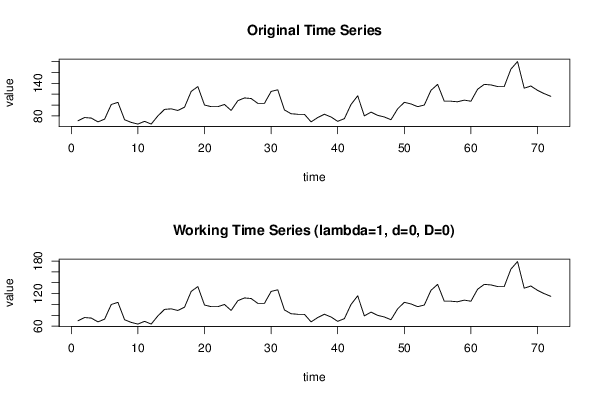
Dataseries X:
71
77
76
69
74
101
105
73
68
65
70
65
80
92
93
90
96
125
134
100
97
97
101
90
108
113
112
103
103
125
128
91
84
83
83
69
77
83
78
70
75
101
117
80
87
81
78
73
93
105
102
97
100
127
138
107
107
106
109
107
129
138
137
134
134
166
180
131
135
127
121
116


Summary of computational transaction
Raw Inputview raw input (R code)
Raw Outputview raw output of R engine
Computing time1 seconds
R Server'Gwilym Jenkins' @ jenkins.wessa.net

\begin{tabular}{lllllllll}
\hline
Summary of computational transaction \tabularnewline
Raw Input & view raw input (R code)  \tabularnewline
Raw Output & view raw output of R engine  \tabularnewline
Computing time & 1 seconds \tabularnewline
R Server & 'Gwilym Jenkins' @ jenkins.wessa.net \tabularnewline
\hline
\end{tabular}
%Source: https://freestatistics.org/blog/index.php?pk=243771&T=0

[TABLE]
[ROW][C]Summary of computational transaction[/C][/ROW]
[ROW][C]Raw Input[/C][C]view raw input (R code) [/C][/ROW]
[ROW][C]Raw Output[/C][C]view raw output of R engine [/C][/ROW]
[ROW][C]Computing time[/C][C]1 seconds[/C][/ROW]
[ROW][C]R Server[/C][C]'Gwilym Jenkins' @ jenkins.wessa.net[/C][/ROW]
[/TABLE]
Source: https://freestatistics.org/blog/index.php?pk=243771&T=0

Globally Unique Identifier (entire table): ba.freestatistics.org/blog/index.php?pk=243771&T=0

As an alternative you can also use a QR Code:  

The GUIDs for individual cells are displayed in the table below:

Summary of computational transaction
Raw Inputview raw input (R code)
Raw Outputview raw output of R engine
Computing time1 seconds
R Server'Gwilym Jenkins' @ jenkins.wessa.net


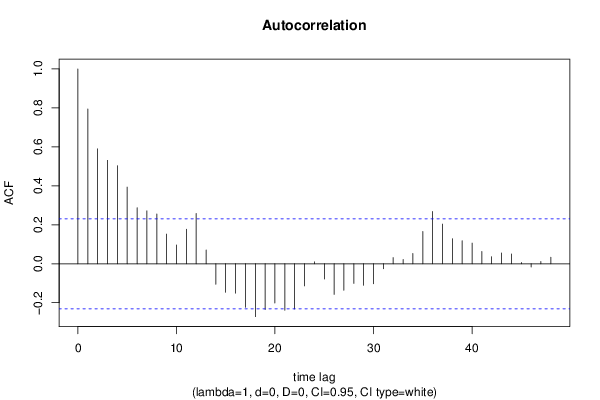
Autocorrelation Function
Time lag kACF(k)T-STATP-value
10.794816.74420
20.5896835.00362e-06
30.5305994.50231.3e-05
40.5032594.27032.9e-05
50.3934133.33820.000669
60.2876422.44070.008559
70.2714442.30330.012077
80.2550212.16390.016894
90.1522151.29160.100315
100.0962290.81650.208444
110.1771411.50310.068595
120.2575862.18570.016046
130.0706540.59950.275355
14-0.104995-0.89090.187972
15-0.146313-1.24150.109224
16-0.150849-1.280.102328
17-0.222911-1.89150.031292
18-0.27154-2.30410.012053
19-0.235101-1.99490.02492
20-0.201599-1.71060.045728
21-0.238613-2.02470.023304
22-0.232506-1.97290.026175
23-0.113649-0.96430.169051
240.0098090.08320.46695
25-0.078126-0.66290.254748
26-0.157178-1.33370.093252
27-0.13597-1.15370.12621
28-0.100699-0.85450.197843
29-0.110655-0.93890.17545
30-0.102803-0.87230.19297
31-0.025737-0.21840.413872
320.0315840.2680.394734
330.0219070.18590.426529
340.052760.44770.327863
350.1658571.40730.081815
360.2686762.27980.012792
370.2034021.72590.044325
380.1287981.09290.139044
390.1184131.00480.159188
400.1061310.90050.185415
410.0628790.53350.297648
420.0358130.30390.381045
430.0550170.46680.321015
440.0500140.42440.336276
450.0068560.05820.476886
46-0.0165-0.140.444522
470.0118820.10080.459987
480.0337530.28640.387696

\begin{tabular}{lllllllll}
\hline
Autocorrelation Function \tabularnewline
Time lag k & ACF(k) & T-STAT & P-value \tabularnewline
1 & 0.79481 & 6.7442 & 0 \tabularnewline
2 & 0.589683 & 5.0036 & 2e-06 \tabularnewline
3 & 0.530599 & 4.5023 & 1.3e-05 \tabularnewline
4 & 0.503259 & 4.2703 & 2.9e-05 \tabularnewline
5 & 0.393413 & 3.3382 & 0.000669 \tabularnewline
6 & 0.287642 & 2.4407 & 0.008559 \tabularnewline
7 & 0.271444 & 2.3033 & 0.012077 \tabularnewline
8 & 0.255021 & 2.1639 & 0.016894 \tabularnewline
9 & 0.152215 & 1.2916 & 0.100315 \tabularnewline
10 & 0.096229 & 0.8165 & 0.208444 \tabularnewline
11 & 0.177141 & 1.5031 & 0.068595 \tabularnewline
12 & 0.257586 & 2.1857 & 0.016046 \tabularnewline
13 & 0.070654 & 0.5995 & 0.275355 \tabularnewline
14 & -0.104995 & -0.8909 & 0.187972 \tabularnewline
15 & -0.146313 & -1.2415 & 0.109224 \tabularnewline
16 & -0.150849 & -1.28 & 0.102328 \tabularnewline
17 & -0.222911 & -1.8915 & 0.031292 \tabularnewline
18 & -0.27154 & -2.3041 & 0.012053 \tabularnewline
19 & -0.235101 & -1.9949 & 0.02492 \tabularnewline
20 & -0.201599 & -1.7106 & 0.045728 \tabularnewline
21 & -0.238613 & -2.0247 & 0.023304 \tabularnewline
22 & -0.232506 & -1.9729 & 0.026175 \tabularnewline
23 & -0.113649 & -0.9643 & 0.169051 \tabularnewline
24 & 0.009809 & 0.0832 & 0.46695 \tabularnewline
25 & -0.078126 & -0.6629 & 0.254748 \tabularnewline
26 & -0.157178 & -1.3337 & 0.093252 \tabularnewline
27 & -0.13597 & -1.1537 & 0.12621 \tabularnewline
28 & -0.100699 & -0.8545 & 0.197843 \tabularnewline
29 & -0.110655 & -0.9389 & 0.17545 \tabularnewline
30 & -0.102803 & -0.8723 & 0.19297 \tabularnewline
31 & -0.025737 & -0.2184 & 0.413872 \tabularnewline
32 & 0.031584 & 0.268 & 0.394734 \tabularnewline
33 & 0.021907 & 0.1859 & 0.426529 \tabularnewline
34 & 0.05276 & 0.4477 & 0.327863 \tabularnewline
35 & 0.165857 & 1.4073 & 0.081815 \tabularnewline
36 & 0.268676 & 2.2798 & 0.012792 \tabularnewline
37 & 0.203402 & 1.7259 & 0.044325 \tabularnewline
38 & 0.128798 & 1.0929 & 0.139044 \tabularnewline
39 & 0.118413 & 1.0048 & 0.159188 \tabularnewline
40 & 0.106131 & 0.9005 & 0.185415 \tabularnewline
41 & 0.062879 & 0.5335 & 0.297648 \tabularnewline
42 & 0.035813 & 0.3039 & 0.381045 \tabularnewline
43 & 0.055017 & 0.4668 & 0.321015 \tabularnewline
44 & 0.050014 & 0.4244 & 0.336276 \tabularnewline
45 & 0.006856 & 0.0582 & 0.476886 \tabularnewline
46 & -0.0165 & -0.14 & 0.444522 \tabularnewline
47 & 0.011882 & 0.1008 & 0.459987 \tabularnewline
48 & 0.033753 & 0.2864 & 0.387696 \tabularnewline
\hline
\end{tabular}
%Source: https://freestatistics.org/blog/index.php?pk=243771&T=1

[TABLE]
[ROW][C]Autocorrelation Function[/C][/ROW]
[ROW][C]Time lag k[/C][C]ACF(k)[/C][C]T-STAT[/C][C]P-value[/C][/ROW]
[ROW][C]1[/C][C]0.79481[/C][C]6.7442[/C][C]0[/C][/ROW]
[ROW][C]2[/C][C]0.589683[/C][C]5.0036[/C][C]2e-06[/C][/ROW]
[ROW][C]3[/C][C]0.530599[/C][C]4.5023[/C][C]1.3e-05[/C][/ROW]
[ROW][C]4[/C][C]0.503259[/C][C]4.2703[/C][C]2.9e-05[/C][/ROW]
[ROW][C]5[/C][C]0.393413[/C][C]3.3382[/C][C]0.000669[/C][/ROW]
[ROW][C]6[/C][C]0.287642[/C][C]2.4407[/C][C]0.008559[/C][/ROW]
[ROW][C]7[/C][C]0.271444[/C][C]2.3033[/C][C]0.012077[/C][/ROW]
[ROW][C]8[/C][C]0.255021[/C][C]2.1639[/C][C]0.016894[/C][/ROW]
[ROW][C]9[/C][C]0.152215[/C][C]1.2916[/C][C]0.100315[/C][/ROW]
[ROW][C]10[/C][C]0.096229[/C][C]0.8165[/C][C]0.208444[/C][/ROW]
[ROW][C]11[/C][C]0.177141[/C][C]1.5031[/C][C]0.068595[/C][/ROW]
[ROW][C]12[/C][C]0.257586[/C][C]2.1857[/C][C]0.016046[/C][/ROW]
[ROW][C]13[/C][C]0.070654[/C][C]0.5995[/C][C]0.275355[/C][/ROW]
[ROW][C]14[/C][C]-0.104995[/C][C]-0.8909[/C][C]0.187972[/C][/ROW]
[ROW][C]15[/C][C]-0.146313[/C][C]-1.2415[/C][C]0.109224[/C][/ROW]
[ROW][C]16[/C][C]-0.150849[/C][C]-1.28[/C][C]0.102328[/C][/ROW]
[ROW][C]17[/C][C]-0.222911[/C][C]-1.8915[/C][C]0.031292[/C][/ROW]
[ROW][C]18[/C][C]-0.27154[/C][C]-2.3041[/C][C]0.012053[/C][/ROW]
[ROW][C]19[/C][C]-0.235101[/C][C]-1.9949[/C][C]0.02492[/C][/ROW]
[ROW][C]20[/C][C]-0.201599[/C][C]-1.7106[/C][C]0.045728[/C][/ROW]
[ROW][C]21[/C][C]-0.238613[/C][C]-2.0247[/C][C]0.023304[/C][/ROW]
[ROW][C]22[/C][C]-0.232506[/C][C]-1.9729[/C][C]0.026175[/C][/ROW]
[ROW][C]23[/C][C]-0.113649[/C][C]-0.9643[/C][C]0.169051[/C][/ROW]
[ROW][C]24[/C][C]0.009809[/C][C]0.0832[/C][C]0.46695[/C][/ROW]
[ROW][C]25[/C][C]-0.078126[/C][C]-0.6629[/C][C]0.254748[/C][/ROW]
[ROW][C]26[/C][C]-0.157178[/C][C]-1.3337[/C][C]0.093252[/C][/ROW]
[ROW][C]27[/C][C]-0.13597[/C][C]-1.1537[/C][C]0.12621[/C][/ROW]
[ROW][C]28[/C][C]-0.100699[/C][C]-0.8545[/C][C]0.197843[/C][/ROW]
[ROW][C]29[/C][C]-0.110655[/C][C]-0.9389[/C][C]0.17545[/C][/ROW]
[ROW][C]30[/C][C]-0.102803[/C][C]-0.8723[/C][C]0.19297[/C][/ROW]
[ROW][C]31[/C][C]-0.025737[/C][C]-0.2184[/C][C]0.413872[/C][/ROW]
[ROW][C]32[/C][C]0.031584[/C][C]0.268[/C][C]0.394734[/C][/ROW]
[ROW][C]33[/C][C]0.021907[/C][C]0.1859[/C][C]0.426529[/C][/ROW]
[ROW][C]34[/C][C]0.05276[/C][C]0.4477[/C][C]0.327863[/C][/ROW]
[ROW][C]35[/C][C]0.165857[/C][C]1.4073[/C][C]0.081815[/C][/ROW]
[ROW][C]36[/C][C]0.268676[/C][C]2.2798[/C][C]0.012792[/C][/ROW]
[ROW][C]37[/C][C]0.203402[/C][C]1.7259[/C][C]0.044325[/C][/ROW]
[ROW][C]38[/C][C]0.128798[/C][C]1.0929[/C][C]0.139044[/C][/ROW]
[ROW][C]39[/C][C]0.118413[/C][C]1.0048[/C][C]0.159188[/C][/ROW]
[ROW][C]40[/C][C]0.106131[/C][C]0.9005[/C][C]0.185415[/C][/ROW]
[ROW][C]41[/C][C]0.062879[/C][C]0.5335[/C][C]0.297648[/C][/ROW]
[ROW][C]42[/C][C]0.035813[/C][C]0.3039[/C][C]0.381045[/C][/ROW]
[ROW][C]43[/C][C]0.055017[/C][C]0.4668[/C][C]0.321015[/C][/ROW]
[ROW][C]44[/C][C]0.050014[/C][C]0.4244[/C][C]0.336276[/C][/ROW]
[ROW][C]45[/C][C]0.006856[/C][C]0.0582[/C][C]0.476886[/C][/ROW]
[ROW][C]46[/C][C]-0.0165[/C][C]-0.14[/C][C]0.444522[/C][/ROW]
[ROW][C]47[/C][C]0.011882[/C][C]0.1008[/C][C]0.459987[/C][/ROW]
[ROW][C]48[/C][C]0.033753[/C][C]0.2864[/C][C]0.387696[/C][/ROW]
[/TABLE]
Source: https://freestatistics.org/blog/index.php?pk=243771&T=1

Globally Unique Identifier (entire table): ba.freestatistics.org/blog/index.php?pk=243771&T=1

As an alternative you can also use a QR Code:  

The GUIDs for individual cells are displayed in the table below:

Autocorrelation Function
Time lag kACF(k)T-STATP-value
10.794816.74420
20.5896835.00362e-06
30.5305994.50231.3e-05
40.5032594.27032.9e-05
50.3934133.33820.000669
60.2876422.44070.008559
70.2714442.30330.012077
80.2550212.16390.016894
90.1522151.29160.100315
100.0962290.81650.208444
110.1771411.50310.068595
120.2575862.18570.016046
130.0706540.59950.275355
14-0.104995-0.89090.187972
15-0.146313-1.24150.109224
16-0.150849-1.280.102328
17-0.222911-1.89150.031292
18-0.27154-2.30410.012053
19-0.235101-1.99490.02492
20-0.201599-1.71060.045728
21-0.238613-2.02470.023304
22-0.232506-1.97290.026175
23-0.113649-0.96430.169051
240.0098090.08320.46695
25-0.078126-0.66290.254748
26-0.157178-1.33370.093252
27-0.13597-1.15370.12621
28-0.100699-0.85450.197843
29-0.110655-0.93890.17545
30-0.102803-0.87230.19297
31-0.025737-0.21840.413872
320.0315840.2680.394734
330.0219070.18590.426529
340.052760.44770.327863
350.1658571.40730.081815
360.2686762.27980.012792
370.2034021.72590.044325
380.1287981.09290.139044
390.1184131.00480.159188
400.1061310.90050.185415
410.0628790.53350.297648
420.0358130.30390.381045
430.0550170.46680.321015
440.0500140.42440.336276
450.0068560.05820.476886
46-0.0165-0.140.444522
470.0118820.10080.459987
480.0337530.28640.387696


Partial Autocorrelation Function
Time lag kPACF(k)T-STATP-value
10.794816.74420
2-0.114153-0.96860.167988
30.2727572.31440.01175
40.0292060.24780.402488
5-0.145625-1.23570.110299
60.0026440.02240.491082
70.0956490.81160.209845
8-0.042939-0.36430.358333
9-0.146269-1.24110.109292
100.1010170.85720.1971
110.2250631.90970.030077
120.073240.62150.26813
13-0.575839-4.88623e-06
14-0.025985-0.22050.413058
15-0.060453-0.5130.304773
160.0303680.25770.398694
17-0.00159-0.01350.494636
180.0569640.48340.315155
190.0028960.02460.490231
200.024060.20420.419404
210.0595190.5050.307538
220.0083130.07050.471981
230.0141930.12040.452238
240.0769370.65280.257972
25-0.097937-0.8310.204353
260.0277590.23550.407226
27-0.052188-0.44280.32961
28-0.032339-0.27440.392279
290.0865990.73480.232418
300.0056850.04820.480829
310.0558130.47360.318613
32-0.01283-0.10890.456805
330.045640.38730.34985
340.051450.43660.331864
350.0153220.130.448461
360.0084890.0720.471389
37-0.013914-0.11810.453172
38-0.051964-0.44090.330294
39-0.049147-0.4170.338949
40-0.045284-0.38420.350965
410.0088940.07550.470026
42-0.033454-0.28390.388663
43-0.035645-0.30250.381587
44-0.014885-0.12630.449921
450.0544320.46190.322784
46-0.097972-0.83130.20427
47-0.076061-0.64540.26036
48-0.053858-0.4570.324523

\begin{tabular}{lllllllll}
\hline
Partial Autocorrelation Function \tabularnewline
Time lag k & PACF(k) & T-STAT & P-value \tabularnewline
1 & 0.79481 & 6.7442 & 0 \tabularnewline
2 & -0.114153 & -0.9686 & 0.167988 \tabularnewline
3 & 0.272757 & 2.3144 & 0.01175 \tabularnewline
4 & 0.029206 & 0.2478 & 0.402488 \tabularnewline
5 & -0.145625 & -1.2357 & 0.110299 \tabularnewline
6 & 0.002644 & 0.0224 & 0.491082 \tabularnewline
7 & 0.095649 & 0.8116 & 0.209845 \tabularnewline
8 & -0.042939 & -0.3643 & 0.358333 \tabularnewline
9 & -0.146269 & -1.2411 & 0.109292 \tabularnewline
10 & 0.101017 & 0.8572 & 0.1971 \tabularnewline
11 & 0.225063 & 1.9097 & 0.030077 \tabularnewline
12 & 0.07324 & 0.6215 & 0.26813 \tabularnewline
13 & -0.575839 & -4.8862 & 3e-06 \tabularnewline
14 & -0.025985 & -0.2205 & 0.413058 \tabularnewline
15 & -0.060453 & -0.513 & 0.304773 \tabularnewline
16 & 0.030368 & 0.2577 & 0.398694 \tabularnewline
17 & -0.00159 & -0.0135 & 0.494636 \tabularnewline
18 & 0.056964 & 0.4834 & 0.315155 \tabularnewline
19 & 0.002896 & 0.0246 & 0.490231 \tabularnewline
20 & 0.02406 & 0.2042 & 0.419404 \tabularnewline
21 & 0.059519 & 0.505 & 0.307538 \tabularnewline
22 & 0.008313 & 0.0705 & 0.471981 \tabularnewline
23 & 0.014193 & 0.1204 & 0.452238 \tabularnewline
24 & 0.076937 & 0.6528 & 0.257972 \tabularnewline
25 & -0.097937 & -0.831 & 0.204353 \tabularnewline
26 & 0.027759 & 0.2355 & 0.407226 \tabularnewline
27 & -0.052188 & -0.4428 & 0.32961 \tabularnewline
28 & -0.032339 & -0.2744 & 0.392279 \tabularnewline
29 & 0.086599 & 0.7348 & 0.232418 \tabularnewline
30 & 0.005685 & 0.0482 & 0.480829 \tabularnewline
31 & 0.055813 & 0.4736 & 0.318613 \tabularnewline
32 & -0.01283 & -0.1089 & 0.456805 \tabularnewline
33 & 0.04564 & 0.3873 & 0.34985 \tabularnewline
34 & 0.05145 & 0.4366 & 0.331864 \tabularnewline
35 & 0.015322 & 0.13 & 0.448461 \tabularnewline
36 & 0.008489 & 0.072 & 0.471389 \tabularnewline
37 & -0.013914 & -0.1181 & 0.453172 \tabularnewline
38 & -0.051964 & -0.4409 & 0.330294 \tabularnewline
39 & -0.049147 & -0.417 & 0.338949 \tabularnewline
40 & -0.045284 & -0.3842 & 0.350965 \tabularnewline
41 & 0.008894 & 0.0755 & 0.470026 \tabularnewline
42 & -0.033454 & -0.2839 & 0.388663 \tabularnewline
43 & -0.035645 & -0.3025 & 0.381587 \tabularnewline
44 & -0.014885 & -0.1263 & 0.449921 \tabularnewline
45 & 0.054432 & 0.4619 & 0.322784 \tabularnewline
46 & -0.097972 & -0.8313 & 0.20427 \tabularnewline
47 & -0.076061 & -0.6454 & 0.26036 \tabularnewline
48 & -0.053858 & -0.457 & 0.324523 \tabularnewline
\hline
\end{tabular}
%Source: https://freestatistics.org/blog/index.php?pk=243771&T=2

[TABLE]
[ROW][C]Partial Autocorrelation Function[/C][/ROW]
[ROW][C]Time lag k[/C][C]PACF(k)[/C][C]T-STAT[/C][C]P-value[/C][/ROW]
[ROW][C]1[/C][C]0.79481[/C][C]6.7442[/C][C]0[/C][/ROW]
[ROW][C]2[/C][C]-0.114153[/C][C]-0.9686[/C][C]0.167988[/C][/ROW]
[ROW][C]3[/C][C]0.272757[/C][C]2.3144[/C][C]0.01175[/C][/ROW]
[ROW][C]4[/C][C]0.029206[/C][C]0.2478[/C][C]0.402488[/C][/ROW]
[ROW][C]5[/C][C]-0.145625[/C][C]-1.2357[/C][C]0.110299[/C][/ROW]
[ROW][C]6[/C][C]0.002644[/C][C]0.0224[/C][C]0.491082[/C][/ROW]
[ROW][C]7[/C][C]0.095649[/C][C]0.8116[/C][C]0.209845[/C][/ROW]
[ROW][C]8[/C][C]-0.042939[/C][C]-0.3643[/C][C]0.358333[/C][/ROW]
[ROW][C]9[/C][C]-0.146269[/C][C]-1.2411[/C][C]0.109292[/C][/ROW]
[ROW][C]10[/C][C]0.101017[/C][C]0.8572[/C][C]0.1971[/C][/ROW]
[ROW][C]11[/C][C]0.225063[/C][C]1.9097[/C][C]0.030077[/C][/ROW]
[ROW][C]12[/C][C]0.07324[/C][C]0.6215[/C][C]0.26813[/C][/ROW]
[ROW][C]13[/C][C]-0.575839[/C][C]-4.8862[/C][C]3e-06[/C][/ROW]
[ROW][C]14[/C][C]-0.025985[/C][C]-0.2205[/C][C]0.413058[/C][/ROW]
[ROW][C]15[/C][C]-0.060453[/C][C]-0.513[/C][C]0.304773[/C][/ROW]
[ROW][C]16[/C][C]0.030368[/C][C]0.2577[/C][C]0.398694[/C][/ROW]
[ROW][C]17[/C][C]-0.00159[/C][C]-0.0135[/C][C]0.494636[/C][/ROW]
[ROW][C]18[/C][C]0.056964[/C][C]0.4834[/C][C]0.315155[/C][/ROW]
[ROW][C]19[/C][C]0.002896[/C][C]0.0246[/C][C]0.490231[/C][/ROW]
[ROW][C]20[/C][C]0.02406[/C][C]0.2042[/C][C]0.419404[/C][/ROW]
[ROW][C]21[/C][C]0.059519[/C][C]0.505[/C][C]0.307538[/C][/ROW]
[ROW][C]22[/C][C]0.008313[/C][C]0.0705[/C][C]0.471981[/C][/ROW]
[ROW][C]23[/C][C]0.014193[/C][C]0.1204[/C][C]0.452238[/C][/ROW]
[ROW][C]24[/C][C]0.076937[/C][C]0.6528[/C][C]0.257972[/C][/ROW]
[ROW][C]25[/C][C]-0.097937[/C][C]-0.831[/C][C]0.204353[/C][/ROW]
[ROW][C]26[/C][C]0.027759[/C][C]0.2355[/C][C]0.407226[/C][/ROW]
[ROW][C]27[/C][C]-0.052188[/C][C]-0.4428[/C][C]0.32961[/C][/ROW]
[ROW][C]28[/C][C]-0.032339[/C][C]-0.2744[/C][C]0.392279[/C][/ROW]
[ROW][C]29[/C][C]0.086599[/C][C]0.7348[/C][C]0.232418[/C][/ROW]
[ROW][C]30[/C][C]0.005685[/C][C]0.0482[/C][C]0.480829[/C][/ROW]
[ROW][C]31[/C][C]0.055813[/C][C]0.4736[/C][C]0.318613[/C][/ROW]
[ROW][C]32[/C][C]-0.01283[/C][C]-0.1089[/C][C]0.456805[/C][/ROW]
[ROW][C]33[/C][C]0.04564[/C][C]0.3873[/C][C]0.34985[/C][/ROW]
[ROW][C]34[/C][C]0.05145[/C][C]0.4366[/C][C]0.331864[/C][/ROW]
[ROW][C]35[/C][C]0.015322[/C][C]0.13[/C][C]0.448461[/C][/ROW]
[ROW][C]36[/C][C]0.008489[/C][C]0.072[/C][C]0.471389[/C][/ROW]
[ROW][C]37[/C][C]-0.013914[/C][C]-0.1181[/C][C]0.453172[/C][/ROW]
[ROW][C]38[/C][C]-0.051964[/C][C]-0.4409[/C][C]0.330294[/C][/ROW]
[ROW][C]39[/C][C]-0.049147[/C][C]-0.417[/C][C]0.338949[/C][/ROW]
[ROW][C]40[/C][C]-0.045284[/C][C]-0.3842[/C][C]0.350965[/C][/ROW]
[ROW][C]41[/C][C]0.008894[/C][C]0.0755[/C][C]0.470026[/C][/ROW]
[ROW][C]42[/C][C]-0.033454[/C][C]-0.2839[/C][C]0.388663[/C][/ROW]
[ROW][C]43[/C][C]-0.035645[/C][C]-0.3025[/C][C]0.381587[/C][/ROW]
[ROW][C]44[/C][C]-0.014885[/C][C]-0.1263[/C][C]0.449921[/C][/ROW]
[ROW][C]45[/C][C]0.054432[/C][C]0.4619[/C][C]0.322784[/C][/ROW]
[ROW][C]46[/C][C]-0.097972[/C][C]-0.8313[/C][C]0.20427[/C][/ROW]
[ROW][C]47[/C][C]-0.076061[/C][C]-0.6454[/C][C]0.26036[/C][/ROW]
[ROW][C]48[/C][C]-0.053858[/C][C]-0.457[/C][C]0.324523[/C][/ROW]
[/TABLE]
Source: https://freestatistics.org/blog/index.php?pk=243771&T=2

Globally Unique Identifier (entire table): ba.freestatistics.org/blog/index.php?pk=243771&T=2

As an alternative you can also use a QR Code:  

The GUIDs for individual cells are displayed in the table below:

Partial Autocorrelation Function
Time lag kPACF(k)T-STATP-value
10.794816.74420
2-0.114153-0.96860.167988
30.2727572.31440.01175
40.0292060.24780.402488
5-0.145625-1.23570.110299
60.0026440.02240.491082
70.0956490.81160.209845
8-0.042939-0.36430.358333
9-0.146269-1.24110.109292
100.1010170.85720.1971
110.2250631.90970.030077
120.073240.62150.26813
13-0.575839-4.88623e-06
14-0.025985-0.22050.413058
15-0.060453-0.5130.304773
160.0303680.25770.398694
17-0.00159-0.01350.494636
180.0569640.48340.315155
190.0028960.02460.490231
200.024060.20420.419404
210.0595190.5050.307538
220.0083130.07050.471981
230.0141930.12040.452238
240.0769370.65280.257972
25-0.097937-0.8310.204353
260.0277590.23550.407226
27-0.052188-0.44280.32961
28-0.032339-0.27440.392279
290.0865990.73480.232418
300.0056850.04820.480829
310.0558130.47360.318613
32-0.01283-0.10890.456805
330.045640.38730.34985
340.051450.43660.331864
350.0153220.130.448461
360.0084890.0720.471389
37-0.013914-0.11810.453172
38-0.051964-0.44090.330294
39-0.049147-0.4170.338949
40-0.045284-0.38420.350965
410.0088940.07550.470026
42-0.033454-0.28390.388663
43-0.035645-0.30250.381587
44-0.014885-0.12630.449921
450.0544320.46190.322784
46-0.097972-0.83130.20427
47-0.076061-0.64540.26036
48-0.053858-0.4570.324523


Parameters (Session):
par1 = 48 ; par2 = 1 ; par3 = 0 ; par4 = 0 ; par5 = 12 ; par6 = White Noise ; par7 = 0.95 ;
Parameters (R input):
par1 = 48 ; par2 = 1 ; par3 = 0 ; par4 = 0 ; par5 = 12 ; par6 = White Noise ; par7 = 0.95 ; par8 = ;
R code (references can be found in the software module):
if (par1 == 'Default') {
par1 = 10*log10(length(x))
} else {
par1 <- as.numeric(par1)
}
par2 <- as.numeric(par2)
par3 <- as.numeric(par3)
par4 <- as.numeric(par4)
par5 <- as.numeric(par5)
if (par6 == 'White Noise') par6 <- 'white' else par6 <- 'ma'
par7 <- as.numeric(par7)
if (par8 != '') par8 <- as.numeric(par8)
ox <- x
if (par8 == '') {
if (par2 == 0) {
x <- log(x)
} else {
x <- (x ^ par2 - 1) / par2
}
} else {
x <- log(x,base=par8)
}
if (par3 > 0) x <- diff(x,lag=1,difference=par3)
if (par4 > 0) x <- diff(x,lag=par5,difference=par4)
bitmap(file='picts.png')
op <- par(mfrow=c(2,1))
plot(ox,type='l',main='Original Time Series',xlab='time',ylab='value')
if (par8=='') {
mytitle <- paste('Working Time Series (lambda=',par2,', d=',par3,', D=',par4,')',sep='')
mysub <- paste('(lambda=',par2,', d=',par3,', D=',par4,', CI=', par7, ', CI type=',par6,')',sep='')
} else {
mytitle <- paste('Working Time Series (base=',par8,', d=',par3,', D=',par4,')',sep='')
mysub <- paste('(base=',par8,', d=',par3,', D=',par4,', CI=', par7, ', CI type=',par6,')',sep='')
}
plot(x,type='l', main=mytitle,xlab='time',ylab='value')
par(op)
dev.off()
bitmap(file='pic1.png')
racf <- acf(x, par1, main='Autocorrelation', xlab='time lag', ylab='ACF', ci.type=par6, ci=par7, sub=mysub)
dev.off()
bitmap(file='pic2.png')
rpacf <- pacf(x,par1,main='Partial Autocorrelation',xlab='lags',ylab='PACF',sub=mysub)
dev.off()
(myacf <- c(racf$acf))
(mypacf <- c(rpacf$acf))
lengthx <- length(x)
sqrtn <- sqrt(lengthx)
load(file='createtable')
a<-table.start()
a<-table.row.start(a)
a<-table.element(a,'Autocorrelation Function',4,TRUE)
a<-table.row.end(a)
a<-table.row.start(a)
a<-table.element(a,'Time lag k',header=TRUE)
a<-table.element(a,hyperlink('basics.htm','ACF(k)','click here for more information about the Autocorrelation Function'),header=TRUE)
a<-table.element(a,'T-STAT',header=TRUE)
a<-table.element(a,'P-value',header=TRUE)
a<-table.row.end(a)
for (i in 2:(par1+1)) {
a<-table.row.start(a)
a<-table.element(a,i-1,header=TRUE)
a<-table.element(a,round(myacf[i],6))
mytstat <- myacf[i]*sqrtn
a<-table.element(a,round(mytstat,4))
a<-table.element(a,round(1-pt(abs(mytstat),lengthx),6))
a<-table.row.end(a)
}
a<-table.end(a)
table.save(a,file='mytable.tab')
a<-table.start()
a<-table.row.start(a)
a<-table.element(a,'Partial Autocorrelation Function',4,TRUE)
a<-table.row.end(a)
a<-table.row.start(a)
a<-table.element(a,'Time lag k',header=TRUE)
a<-table.element(a,hyperlink('basics.htm','PACF(k)','click here for more information about the Partial Autocorrelation Function'),header=TRUE)
a<-table.element(a,'T-STAT',header=TRUE)
a<-table.element(a,'P-value',header=TRUE)
a<-table.row.end(a)
for (i in 1:par1) {
a<-table.row.start(a)
a<-table.element(a,i,header=TRUE)
a<-table.element(a,round(mypacf[i],6))
mytstat <- mypacf[i]*sqrtn
a<-table.element(a,round(mytstat,4))
a<-table.element(a,round(1-pt(abs(mytstat),lengthx),6))
a<-table.row.end(a)
}
a<-table.end(a)
table.save(a,file='mytable1.tab')