Free Statistics

of Irreproducible Research!

Author's title

Author*Unverified author*
R Software Modulerwasp_autocorrelation.wasp
Title produced by software(Partial) Autocorrelation Function
Date of computationSun, 19 Oct 2014 18:49:59 +0100
Cite this page as followsStatistical Computations at FreeStatistics.org, Office for Research Development and Education, URL https://freestatistics.org/blog/index.php?v=date/2014/Oct/19/t1413741017qbrrg74okr6nf5u.htm/, Retrieved Sun, 12 May 2024 04:03:46 +0000
Statistical Computations at FreeStatistics.org, Office for Research Development and Education, URL https://freestatistics.org/blog/index.php?pk=243718, Retrieved Sun, 12 May 2024 04:03:46 +0000
QR Codes:

Original text written by user:
IsPrivate?No (this computation is public)
User-defined keywords
Estimated Impact69
Family? (F = Feedback message, R = changed R code, M = changed R Module, P = changed Parameters, D = changed Data)
-       [(Partial) Autocorrelation Function] [Invoergegevens EU] [2014-10-19 17:49:59] [c53767938e2c856c14b03e8e32322294] [Current]
Feedback Forum

Post a new message
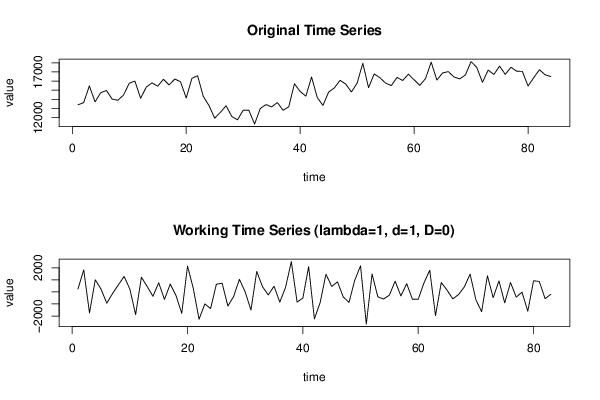
Dataseries X:
13396
13637
15467
13722
14727
14961
14026
13895
14474
15759
15995
14119
15342
15796
15435
16195
15572
16223
15921
14143
16290
16579
14314
13318
11938
12574
13298
12124
11757
12803
12800
11293
12992
13426
13174
13648
12801
13183
15703
14859
14350
16444
14207
13329
14795
15248
16081
15670
14805
15779
17945
15280
16773
16362
15774
15505
16397
16060
16748
16137
15523
16267
18066
16105
16883
17034
16452
16234
16658
18133
17488
15853
17198
16719
17635
16726
17503
17074
17054
15451
16374
17242
16684
16489


Summary of computational transaction
Raw Inputview raw input (R code)
Raw Outputview raw output of R engine
Computing time2 seconds
R Server'George Udny Yule' @ yule.wessa.net

\begin{tabular}{lllllllll}
\hline
Summary of computational transaction \tabularnewline
Raw Input & view raw input (R code)  \tabularnewline
Raw Output & view raw output of R engine  \tabularnewline
Computing time & 2 seconds \tabularnewline
R Server & 'George Udny Yule' @ yule.wessa.net \tabularnewline
\hline
\end{tabular}
%Source: https://freestatistics.org/blog/index.php?pk=243718&T=0

[TABLE]
[ROW][C]Summary of computational transaction[/C][/ROW]
[ROW][C]Raw Input[/C][C]view raw input (R code) [/C][/ROW]
[ROW][C]Raw Output[/C][C]view raw output of R engine [/C][/ROW]
[ROW][C]Computing time[/C][C]2 seconds[/C][/ROW]
[ROW][C]R Server[/C][C]'George Udny Yule' @ yule.wessa.net[/C][/ROW]
[/TABLE]
Source: https://freestatistics.org/blog/index.php?pk=243718&T=0

Globally Unique Identifier (entire table): ba.freestatistics.org/blog/index.php?pk=243718&T=0

As an alternative you can also use a QR Code:  

The GUIDs for individual cells are displayed in the table below:

Summary of computational transaction
Raw Inputview raw input (R code)
Raw Outputview raw output of R engine
Computing time2 seconds
R Server'George Udny Yule' @ yule.wessa.net


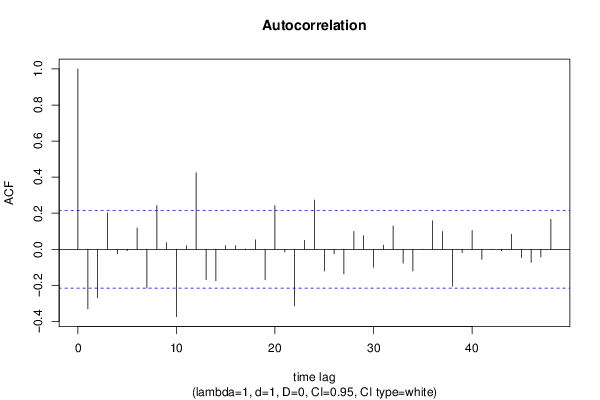
Autocorrelation Function
Time lag kACF(k)T-STATP-value
1-0.329455-3.00150.001774
2-0.269146-2.4520.008151
30.2018491.83890.034751
4-0.024046-0.21910.413566
5-0.00812-0.0740.470604
60.1177471.07270.143251
7-0.215083-1.95950.026706
80.2424342.20870.014977
90.0363050.33080.370831
10-0.373588-3.40350.000513
110.0192360.17530.430654
120.4247553.86970.000108
13-0.168636-1.53630.064128
14-0.174332-1.58820.058018
150.0199150.18140.428233
160.0194510.17720.42989
170.0014650.01330.494691
180.0523750.47720.317252
19-0.169198-1.54150.063504
200.242652.21060.014906
21-0.015011-0.13680.445776
22-0.313729-2.85820.002692
230.049260.44880.32738
240.2735062.49180.007351
25-0.120594-1.09870.137546
26-0.024491-0.22310.411994
27-0.13642-1.24280.108712
280.0983950.89640.186309
290.0758920.69140.245618
30-0.09953-0.90680.18358
310.0225350.20530.418919
320.1295251.180.12068
33-0.076887-0.70050.242795
34-0.120922-1.10170.136899
35-0.001398-0.01270.494936
360.1581261.44060.076731
370.0982280.89490.186715
38-0.204717-1.86510.032853
39-0.019504-0.17770.429701
400.1038690.94630.173374
41-0.055224-0.50310.308108
420.0003280.0030.49881
43-0.008393-0.07650.469616
440.0837560.7630.223799
45-0.046049-0.41950.337958
46-0.072824-0.66350.254436
47-0.042144-0.3840.350998
480.1661551.51370.066944

\begin{tabular}{lllllllll}
\hline
Autocorrelation Function \tabularnewline
Time lag k & ACF(k) & T-STAT & P-value \tabularnewline
1 & -0.329455 & -3.0015 & 0.001774 \tabularnewline
2 & -0.269146 & -2.452 & 0.008151 \tabularnewline
3 & 0.201849 & 1.8389 & 0.034751 \tabularnewline
4 & -0.024046 & -0.2191 & 0.413566 \tabularnewline
5 & -0.00812 & -0.074 & 0.470604 \tabularnewline
6 & 0.117747 & 1.0727 & 0.143251 \tabularnewline
7 & -0.215083 & -1.9595 & 0.026706 \tabularnewline
8 & 0.242434 & 2.2087 & 0.014977 \tabularnewline
9 & 0.036305 & 0.3308 & 0.370831 \tabularnewline
10 & -0.373588 & -3.4035 & 0.000513 \tabularnewline
11 & 0.019236 & 0.1753 & 0.430654 \tabularnewline
12 & 0.424755 & 3.8697 & 0.000108 \tabularnewline
13 & -0.168636 & -1.5363 & 0.064128 \tabularnewline
14 & -0.174332 & -1.5882 & 0.058018 \tabularnewline
15 & 0.019915 & 0.1814 & 0.428233 \tabularnewline
16 & 0.019451 & 0.1772 & 0.42989 \tabularnewline
17 & 0.001465 & 0.0133 & 0.494691 \tabularnewline
18 & 0.052375 & 0.4772 & 0.317252 \tabularnewline
19 & -0.169198 & -1.5415 & 0.063504 \tabularnewline
20 & 0.24265 & 2.2106 & 0.014906 \tabularnewline
21 & -0.015011 & -0.1368 & 0.445776 \tabularnewline
22 & -0.313729 & -2.8582 & 0.002692 \tabularnewline
23 & 0.04926 & 0.4488 & 0.32738 \tabularnewline
24 & 0.273506 & 2.4918 & 0.007351 \tabularnewline
25 & -0.120594 & -1.0987 & 0.137546 \tabularnewline
26 & -0.024491 & -0.2231 & 0.411994 \tabularnewline
27 & -0.13642 & -1.2428 & 0.108712 \tabularnewline
28 & 0.098395 & 0.8964 & 0.186309 \tabularnewline
29 & 0.075892 & 0.6914 & 0.245618 \tabularnewline
30 & -0.09953 & -0.9068 & 0.18358 \tabularnewline
31 & 0.022535 & 0.2053 & 0.418919 \tabularnewline
32 & 0.129525 & 1.18 & 0.12068 \tabularnewline
33 & -0.076887 & -0.7005 & 0.242795 \tabularnewline
34 & -0.120922 & -1.1017 & 0.136899 \tabularnewline
35 & -0.001398 & -0.0127 & 0.494936 \tabularnewline
36 & 0.158126 & 1.4406 & 0.076731 \tabularnewline
37 & 0.098228 & 0.8949 & 0.186715 \tabularnewline
38 & -0.204717 & -1.8651 & 0.032853 \tabularnewline
39 & -0.019504 & -0.1777 & 0.429701 \tabularnewline
40 & 0.103869 & 0.9463 & 0.173374 \tabularnewline
41 & -0.055224 & -0.5031 & 0.308108 \tabularnewline
42 & 0.000328 & 0.003 & 0.49881 \tabularnewline
43 & -0.008393 & -0.0765 & 0.469616 \tabularnewline
44 & 0.083756 & 0.763 & 0.223799 \tabularnewline
45 & -0.046049 & -0.4195 & 0.337958 \tabularnewline
46 & -0.072824 & -0.6635 & 0.254436 \tabularnewline
47 & -0.042144 & -0.384 & 0.350998 \tabularnewline
48 & 0.166155 & 1.5137 & 0.066944 \tabularnewline
\hline
\end{tabular}
%Source: https://freestatistics.org/blog/index.php?pk=243718&T=1

[TABLE]
[ROW][C]Autocorrelation Function[/C][/ROW]
[ROW][C]Time lag k[/C][C]ACF(k)[/C][C]T-STAT[/C][C]P-value[/C][/ROW]
[ROW][C]1[/C][C]-0.329455[/C][C]-3.0015[/C][C]0.001774[/C][/ROW]
[ROW][C]2[/C][C]-0.269146[/C][C]-2.452[/C][C]0.008151[/C][/ROW]
[ROW][C]3[/C][C]0.201849[/C][C]1.8389[/C][C]0.034751[/C][/ROW]
[ROW][C]4[/C][C]-0.024046[/C][C]-0.2191[/C][C]0.413566[/C][/ROW]
[ROW][C]5[/C][C]-0.00812[/C][C]-0.074[/C][C]0.470604[/C][/ROW]
[ROW][C]6[/C][C]0.117747[/C][C]1.0727[/C][C]0.143251[/C][/ROW]
[ROW][C]7[/C][C]-0.215083[/C][C]-1.9595[/C][C]0.026706[/C][/ROW]
[ROW][C]8[/C][C]0.242434[/C][C]2.2087[/C][C]0.014977[/C][/ROW]
[ROW][C]9[/C][C]0.036305[/C][C]0.3308[/C][C]0.370831[/C][/ROW]
[ROW][C]10[/C][C]-0.373588[/C][C]-3.4035[/C][C]0.000513[/C][/ROW]
[ROW][C]11[/C][C]0.019236[/C][C]0.1753[/C][C]0.430654[/C][/ROW]
[ROW][C]12[/C][C]0.424755[/C][C]3.8697[/C][C]0.000108[/C][/ROW]
[ROW][C]13[/C][C]-0.168636[/C][C]-1.5363[/C][C]0.064128[/C][/ROW]
[ROW][C]14[/C][C]-0.174332[/C][C]-1.5882[/C][C]0.058018[/C][/ROW]
[ROW][C]15[/C][C]0.019915[/C][C]0.1814[/C][C]0.428233[/C][/ROW]
[ROW][C]16[/C][C]0.019451[/C][C]0.1772[/C][C]0.42989[/C][/ROW]
[ROW][C]17[/C][C]0.001465[/C][C]0.0133[/C][C]0.494691[/C][/ROW]
[ROW][C]18[/C][C]0.052375[/C][C]0.4772[/C][C]0.317252[/C][/ROW]
[ROW][C]19[/C][C]-0.169198[/C][C]-1.5415[/C][C]0.063504[/C][/ROW]
[ROW][C]20[/C][C]0.24265[/C][C]2.2106[/C][C]0.014906[/C][/ROW]
[ROW][C]21[/C][C]-0.015011[/C][C]-0.1368[/C][C]0.445776[/C][/ROW]
[ROW][C]22[/C][C]-0.313729[/C][C]-2.8582[/C][C]0.002692[/C][/ROW]
[ROW][C]23[/C][C]0.04926[/C][C]0.4488[/C][C]0.32738[/C][/ROW]
[ROW][C]24[/C][C]0.273506[/C][C]2.4918[/C][C]0.007351[/C][/ROW]
[ROW][C]25[/C][C]-0.120594[/C][C]-1.0987[/C][C]0.137546[/C][/ROW]
[ROW][C]26[/C][C]-0.024491[/C][C]-0.2231[/C][C]0.411994[/C][/ROW]
[ROW][C]27[/C][C]-0.13642[/C][C]-1.2428[/C][C]0.108712[/C][/ROW]
[ROW][C]28[/C][C]0.098395[/C][C]0.8964[/C][C]0.186309[/C][/ROW]
[ROW][C]29[/C][C]0.075892[/C][C]0.6914[/C][C]0.245618[/C][/ROW]
[ROW][C]30[/C][C]-0.09953[/C][C]-0.9068[/C][C]0.18358[/C][/ROW]
[ROW][C]31[/C][C]0.022535[/C][C]0.2053[/C][C]0.418919[/C][/ROW]
[ROW][C]32[/C][C]0.129525[/C][C]1.18[/C][C]0.12068[/C][/ROW]
[ROW][C]33[/C][C]-0.076887[/C][C]-0.7005[/C][C]0.242795[/C][/ROW]
[ROW][C]34[/C][C]-0.120922[/C][C]-1.1017[/C][C]0.136899[/C][/ROW]
[ROW][C]35[/C][C]-0.001398[/C][C]-0.0127[/C][C]0.494936[/C][/ROW]
[ROW][C]36[/C][C]0.158126[/C][C]1.4406[/C][C]0.076731[/C][/ROW]
[ROW][C]37[/C][C]0.098228[/C][C]0.8949[/C][C]0.186715[/C][/ROW]
[ROW][C]38[/C][C]-0.204717[/C][C]-1.8651[/C][C]0.032853[/C][/ROW]
[ROW][C]39[/C][C]-0.019504[/C][C]-0.1777[/C][C]0.429701[/C][/ROW]
[ROW][C]40[/C][C]0.103869[/C][C]0.9463[/C][C]0.173374[/C][/ROW]
[ROW][C]41[/C][C]-0.055224[/C][C]-0.5031[/C][C]0.308108[/C][/ROW]
[ROW][C]42[/C][C]0.000328[/C][C]0.003[/C][C]0.49881[/C][/ROW]
[ROW][C]43[/C][C]-0.008393[/C][C]-0.0765[/C][C]0.469616[/C][/ROW]
[ROW][C]44[/C][C]0.083756[/C][C]0.763[/C][C]0.223799[/C][/ROW]
[ROW][C]45[/C][C]-0.046049[/C][C]-0.4195[/C][C]0.337958[/C][/ROW]
[ROW][C]46[/C][C]-0.072824[/C][C]-0.6635[/C][C]0.254436[/C][/ROW]
[ROW][C]47[/C][C]-0.042144[/C][C]-0.384[/C][C]0.350998[/C][/ROW]
[ROW][C]48[/C][C]0.166155[/C][C]1.5137[/C][C]0.066944[/C][/ROW]
[/TABLE]
Source: https://freestatistics.org/blog/index.php?pk=243718&T=1

Globally Unique Identifier (entire table): ba.freestatistics.org/blog/index.php?pk=243718&T=1

As an alternative you can also use a QR Code:  

The GUIDs for individual cells are displayed in the table below:

Autocorrelation Function
Time lag kACF(k)T-STATP-value
1-0.329455-3.00150.001774
2-0.269146-2.4520.008151
30.2018491.83890.034751
4-0.024046-0.21910.413566
5-0.00812-0.0740.470604
60.1177471.07270.143251
7-0.215083-1.95950.026706
80.2424342.20870.014977
90.0363050.33080.370831
10-0.373588-3.40350.000513
110.0192360.17530.430654
120.4247553.86970.000108
13-0.168636-1.53630.064128
14-0.174332-1.58820.058018
150.0199150.18140.428233
160.0194510.17720.42989
170.0014650.01330.494691
180.0523750.47720.317252
19-0.169198-1.54150.063504
200.242652.21060.014906
21-0.015011-0.13680.445776
22-0.313729-2.85820.002692
230.049260.44880.32738
240.2735062.49180.007351
25-0.120594-1.09870.137546
26-0.024491-0.22310.411994
27-0.13642-1.24280.108712
280.0983950.89640.186309
290.0758920.69140.245618
30-0.09953-0.90680.18358
310.0225350.20530.418919
320.1295251.180.12068
33-0.076887-0.70050.242795
34-0.120922-1.10170.136899
35-0.001398-0.01270.494936
360.1581261.44060.076731
370.0982280.89490.186715
38-0.204717-1.86510.032853
39-0.019504-0.17770.429701
400.1038690.94630.173374
41-0.055224-0.50310.308108
420.0003280.0030.49881
43-0.008393-0.07650.469616
440.0837560.7630.223799
45-0.046049-0.41950.337958
46-0.072824-0.66350.254436
47-0.042144-0.3840.350998
480.1661551.51370.066944


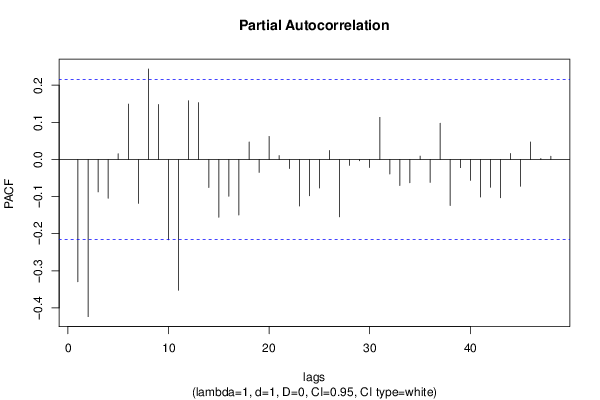
Partial Autocorrelation Function
Time lag kPACF(k)T-STATP-value
1-0.329455-3.00150.001774
2-0.423672-3.85980.000112
3-0.087459-0.79680.213924
4-0.104398-0.95110.172156
50.0152210.13870.445024
60.149151.35880.088942
7-0.118442-1.07910.141845
80.2438632.22170.014513
90.1478711.34720.090797
10-0.2167-1.97420.025841
11-0.352683-3.21310.000935
120.1581351.44070.076719
130.1530941.39480.083406
14-0.075573-0.68850.246528
15-0.155966-1.42090.079544
16-0.099181-0.90360.184417
17-0.1499-1.36570.087869
180.0469370.42760.335017
19-0.034858-0.31760.375803
200.0620860.56560.286585
210.0103990.09470.462376
22-0.024475-0.2230.41205
23-0.125321-1.14170.128425
24-0.097984-0.89270.187305
25-0.077069-0.70210.242281
260.0240870.21940.413422
27-0.15471-1.40950.081215
28-0.015966-0.14550.442352
29-0.003635-0.03310.486831
30-0.021702-0.19770.421878
310.113331.03250.152421
32-0.039384-0.35880.360326
33-0.070035-0.6380.2626
34-0.062706-0.57130.284678
350.0089410.08150.467638
36-0.061811-0.56310.287433
370.0974310.88760.188649
38-0.124214-1.13160.130521
39-0.022063-0.2010.420595
40-0.056548-0.51520.303898
41-0.101428-0.92410.179069
42-0.074843-0.68190.248615
43-0.103489-0.94280.174253
440.0158130.14410.442901
45-0.072222-0.6580.256187
460.0471430.42950.33434
470.0024080.02190.491274
480.0086160.07850.468812

\begin{tabular}{lllllllll}
\hline
Partial Autocorrelation Function \tabularnewline
Time lag k & PACF(k) & T-STAT & P-value \tabularnewline
1 & -0.329455 & -3.0015 & 0.001774 \tabularnewline
2 & -0.423672 & -3.8598 & 0.000112 \tabularnewline
3 & -0.087459 & -0.7968 & 0.213924 \tabularnewline
4 & -0.104398 & -0.9511 & 0.172156 \tabularnewline
5 & 0.015221 & 0.1387 & 0.445024 \tabularnewline
6 & 0.14915 & 1.3588 & 0.088942 \tabularnewline
7 & -0.118442 & -1.0791 & 0.141845 \tabularnewline
8 & 0.243863 & 2.2217 & 0.014513 \tabularnewline
9 & 0.147871 & 1.3472 & 0.090797 \tabularnewline
10 & -0.2167 & -1.9742 & 0.025841 \tabularnewline
11 & -0.352683 & -3.2131 & 0.000935 \tabularnewline
12 & 0.158135 & 1.4407 & 0.076719 \tabularnewline
13 & 0.153094 & 1.3948 & 0.083406 \tabularnewline
14 & -0.075573 & -0.6885 & 0.246528 \tabularnewline
15 & -0.155966 & -1.4209 & 0.079544 \tabularnewline
16 & -0.099181 & -0.9036 & 0.184417 \tabularnewline
17 & -0.1499 & -1.3657 & 0.087869 \tabularnewline
18 & 0.046937 & 0.4276 & 0.335017 \tabularnewline
19 & -0.034858 & -0.3176 & 0.375803 \tabularnewline
20 & 0.062086 & 0.5656 & 0.286585 \tabularnewline
21 & 0.010399 & 0.0947 & 0.462376 \tabularnewline
22 & -0.024475 & -0.223 & 0.41205 \tabularnewline
23 & -0.125321 & -1.1417 & 0.128425 \tabularnewline
24 & -0.097984 & -0.8927 & 0.187305 \tabularnewline
25 & -0.077069 & -0.7021 & 0.242281 \tabularnewline
26 & 0.024087 & 0.2194 & 0.413422 \tabularnewline
27 & -0.15471 & -1.4095 & 0.081215 \tabularnewline
28 & -0.015966 & -0.1455 & 0.442352 \tabularnewline
29 & -0.003635 & -0.0331 & 0.486831 \tabularnewline
30 & -0.021702 & -0.1977 & 0.421878 \tabularnewline
31 & 0.11333 & 1.0325 & 0.152421 \tabularnewline
32 & -0.039384 & -0.3588 & 0.360326 \tabularnewline
33 & -0.070035 & -0.638 & 0.2626 \tabularnewline
34 & -0.062706 & -0.5713 & 0.284678 \tabularnewline
35 & 0.008941 & 0.0815 & 0.467638 \tabularnewline
36 & -0.061811 & -0.5631 & 0.287433 \tabularnewline
37 & 0.097431 & 0.8876 & 0.188649 \tabularnewline
38 & -0.124214 & -1.1316 & 0.130521 \tabularnewline
39 & -0.022063 & -0.201 & 0.420595 \tabularnewline
40 & -0.056548 & -0.5152 & 0.303898 \tabularnewline
41 & -0.101428 & -0.9241 & 0.179069 \tabularnewline
42 & -0.074843 & -0.6819 & 0.248615 \tabularnewline
43 & -0.103489 & -0.9428 & 0.174253 \tabularnewline
44 & 0.015813 & 0.1441 & 0.442901 \tabularnewline
45 & -0.072222 & -0.658 & 0.256187 \tabularnewline
46 & 0.047143 & 0.4295 & 0.33434 \tabularnewline
47 & 0.002408 & 0.0219 & 0.491274 \tabularnewline
48 & 0.008616 & 0.0785 & 0.468812 \tabularnewline
\hline
\end{tabular}
%Source: https://freestatistics.org/blog/index.php?pk=243718&T=2

[TABLE]
[ROW][C]Partial Autocorrelation Function[/C][/ROW]
[ROW][C]Time lag k[/C][C]PACF(k)[/C][C]T-STAT[/C][C]P-value[/C][/ROW]
[ROW][C]1[/C][C]-0.329455[/C][C]-3.0015[/C][C]0.001774[/C][/ROW]
[ROW][C]2[/C][C]-0.423672[/C][C]-3.8598[/C][C]0.000112[/C][/ROW]
[ROW][C]3[/C][C]-0.087459[/C][C]-0.7968[/C][C]0.213924[/C][/ROW]
[ROW][C]4[/C][C]-0.104398[/C][C]-0.9511[/C][C]0.172156[/C][/ROW]
[ROW][C]5[/C][C]0.015221[/C][C]0.1387[/C][C]0.445024[/C][/ROW]
[ROW][C]6[/C][C]0.14915[/C][C]1.3588[/C][C]0.088942[/C][/ROW]
[ROW][C]7[/C][C]-0.118442[/C][C]-1.0791[/C][C]0.141845[/C][/ROW]
[ROW][C]8[/C][C]0.243863[/C][C]2.2217[/C][C]0.014513[/C][/ROW]
[ROW][C]9[/C][C]0.147871[/C][C]1.3472[/C][C]0.090797[/C][/ROW]
[ROW][C]10[/C][C]-0.2167[/C][C]-1.9742[/C][C]0.025841[/C][/ROW]
[ROW][C]11[/C][C]-0.352683[/C][C]-3.2131[/C][C]0.000935[/C][/ROW]
[ROW][C]12[/C][C]0.158135[/C][C]1.4407[/C][C]0.076719[/C][/ROW]
[ROW][C]13[/C][C]0.153094[/C][C]1.3948[/C][C]0.083406[/C][/ROW]
[ROW][C]14[/C][C]-0.075573[/C][C]-0.6885[/C][C]0.246528[/C][/ROW]
[ROW][C]15[/C][C]-0.155966[/C][C]-1.4209[/C][C]0.079544[/C][/ROW]
[ROW][C]16[/C][C]-0.099181[/C][C]-0.9036[/C][C]0.184417[/C][/ROW]
[ROW][C]17[/C][C]-0.1499[/C][C]-1.3657[/C][C]0.087869[/C][/ROW]
[ROW][C]18[/C][C]0.046937[/C][C]0.4276[/C][C]0.335017[/C][/ROW]
[ROW][C]19[/C][C]-0.034858[/C][C]-0.3176[/C][C]0.375803[/C][/ROW]
[ROW][C]20[/C][C]0.062086[/C][C]0.5656[/C][C]0.286585[/C][/ROW]
[ROW][C]21[/C][C]0.010399[/C][C]0.0947[/C][C]0.462376[/C][/ROW]
[ROW][C]22[/C][C]-0.024475[/C][C]-0.223[/C][C]0.41205[/C][/ROW]
[ROW][C]23[/C][C]-0.125321[/C][C]-1.1417[/C][C]0.128425[/C][/ROW]
[ROW][C]24[/C][C]-0.097984[/C][C]-0.8927[/C][C]0.187305[/C][/ROW]
[ROW][C]25[/C][C]-0.077069[/C][C]-0.7021[/C][C]0.242281[/C][/ROW]
[ROW][C]26[/C][C]0.024087[/C][C]0.2194[/C][C]0.413422[/C][/ROW]
[ROW][C]27[/C][C]-0.15471[/C][C]-1.4095[/C][C]0.081215[/C][/ROW]
[ROW][C]28[/C][C]-0.015966[/C][C]-0.1455[/C][C]0.442352[/C][/ROW]
[ROW][C]29[/C][C]-0.003635[/C][C]-0.0331[/C][C]0.486831[/C][/ROW]
[ROW][C]30[/C][C]-0.021702[/C][C]-0.1977[/C][C]0.421878[/C][/ROW]
[ROW][C]31[/C][C]0.11333[/C][C]1.0325[/C][C]0.152421[/C][/ROW]
[ROW][C]32[/C][C]-0.039384[/C][C]-0.3588[/C][C]0.360326[/C][/ROW]
[ROW][C]33[/C][C]-0.070035[/C][C]-0.638[/C][C]0.2626[/C][/ROW]
[ROW][C]34[/C][C]-0.062706[/C][C]-0.5713[/C][C]0.284678[/C][/ROW]
[ROW][C]35[/C][C]0.008941[/C][C]0.0815[/C][C]0.467638[/C][/ROW]
[ROW][C]36[/C][C]-0.061811[/C][C]-0.5631[/C][C]0.287433[/C][/ROW]
[ROW][C]37[/C][C]0.097431[/C][C]0.8876[/C][C]0.188649[/C][/ROW]
[ROW][C]38[/C][C]-0.124214[/C][C]-1.1316[/C][C]0.130521[/C][/ROW]
[ROW][C]39[/C][C]-0.022063[/C][C]-0.201[/C][C]0.420595[/C][/ROW]
[ROW][C]40[/C][C]-0.056548[/C][C]-0.5152[/C][C]0.303898[/C][/ROW]
[ROW][C]41[/C][C]-0.101428[/C][C]-0.9241[/C][C]0.179069[/C][/ROW]
[ROW][C]42[/C][C]-0.074843[/C][C]-0.6819[/C][C]0.248615[/C][/ROW]
[ROW][C]43[/C][C]-0.103489[/C][C]-0.9428[/C][C]0.174253[/C][/ROW]
[ROW][C]44[/C][C]0.015813[/C][C]0.1441[/C][C]0.442901[/C][/ROW]
[ROW][C]45[/C][C]-0.072222[/C][C]-0.658[/C][C]0.256187[/C][/ROW]
[ROW][C]46[/C][C]0.047143[/C][C]0.4295[/C][C]0.33434[/C][/ROW]
[ROW][C]47[/C][C]0.002408[/C][C]0.0219[/C][C]0.491274[/C][/ROW]
[ROW][C]48[/C][C]0.008616[/C][C]0.0785[/C][C]0.468812[/C][/ROW]
[/TABLE]
Source: https://freestatistics.org/blog/index.php?pk=243718&T=2

Globally Unique Identifier (entire table): ba.freestatistics.org/blog/index.php?pk=243718&T=2

As an alternative you can also use a QR Code:  

The GUIDs for individual cells are displayed in the table below:

Partial Autocorrelation Function
Time lag kPACF(k)T-STATP-value
1-0.329455-3.00150.001774
2-0.423672-3.85980.000112
3-0.087459-0.79680.213924
4-0.104398-0.95110.172156
50.0152210.13870.445024
60.149151.35880.088942
7-0.118442-1.07910.141845
80.2438632.22170.014513
90.1478711.34720.090797
10-0.2167-1.97420.025841
11-0.352683-3.21310.000935
120.1581351.44070.076719
130.1530941.39480.083406
14-0.075573-0.68850.246528
15-0.155966-1.42090.079544
16-0.099181-0.90360.184417
17-0.1499-1.36570.087869
180.0469370.42760.335017
19-0.034858-0.31760.375803
200.0620860.56560.286585
210.0103990.09470.462376
22-0.024475-0.2230.41205
23-0.125321-1.14170.128425
24-0.097984-0.89270.187305
25-0.077069-0.70210.242281
260.0240870.21940.413422
27-0.15471-1.40950.081215
28-0.015966-0.14550.442352
29-0.003635-0.03310.486831
30-0.021702-0.19770.421878
310.113331.03250.152421
32-0.039384-0.35880.360326
33-0.070035-0.6380.2626
34-0.062706-0.57130.284678
350.0089410.08150.467638
36-0.061811-0.56310.287433
370.0974310.88760.188649
38-0.124214-1.13160.130521
39-0.022063-0.2010.420595
40-0.056548-0.51520.303898
41-0.101428-0.92410.179069
42-0.074843-0.68190.248615
43-0.103489-0.94280.174253
440.0158130.14410.442901
45-0.072222-0.6580.256187
460.0471430.42950.33434
470.0024080.02190.491274
480.0086160.07850.468812


Parameters (Session):
par1 = 48 ; par2 = 1 ; par3 = 1 ; par4 = 0 ; par5 = 12 ; par6 = White Noise ; par7 = 0.95 ;
Parameters (R input):
par1 = 48 ; par2 = 1 ; par3 = 1 ; par4 = 0 ; par5 = 12 ; par6 = White Noise ; par7 = 0.95 ; par8 = ;
R code (references can be found in the software module):
if (par1 == 'Default') {
par1 = 10*log10(length(x))
} else {
par1 <- as.numeric(par1)
}
par2 <- as.numeric(par2)
par3 <- as.numeric(par3)
par4 <- as.numeric(par4)
par5 <- as.numeric(par5)
if (par6 == 'White Noise') par6 <- 'white' else par6 <- 'ma'
par7 <- as.numeric(par7)
if (par8 != '') par8 <- as.numeric(par8)
ox <- x
if (par8 == '') {
if (par2 == 0) {
x <- log(x)
} else {
x <- (x ^ par2 - 1) / par2
}
} else {
x <- log(x,base=par8)
}
if (par3 > 0) x <- diff(x,lag=1,difference=par3)
if (par4 > 0) x <- diff(x,lag=par5,difference=par4)
bitmap(file='picts.png')
op <- par(mfrow=c(2,1))
plot(ox,type='l',main='Original Time Series',xlab='time',ylab='value')
if (par8=='') {
mytitle <- paste('Working Time Series (lambda=',par2,', d=',par3,', D=',par4,')',sep='')
mysub <- paste('(lambda=',par2,', d=',par3,', D=',par4,', CI=', par7, ', CI type=',par6,')',sep='')
} else {
mytitle <- paste('Working Time Series (base=',par8,', d=',par3,', D=',par4,')',sep='')
mysub <- paste('(base=',par8,', d=',par3,', D=',par4,', CI=', par7, ', CI type=',par6,')',sep='')
}
plot(x,type='l', main=mytitle,xlab='time',ylab='value')
par(op)
dev.off()
bitmap(file='pic1.png')
racf <- acf(x, par1, main='Autocorrelation', xlab='time lag', ylab='ACF', ci.type=par6, ci=par7, sub=mysub)
dev.off()
bitmap(file='pic2.png')
rpacf <- pacf(x,par1,main='Partial Autocorrelation',xlab='lags',ylab='PACF',sub=mysub)
dev.off()
(myacf <- c(racf$acf))
(mypacf <- c(rpacf$acf))
lengthx <- length(x)
sqrtn <- sqrt(lengthx)
load(file='createtable')
a<-table.start()
a<-table.row.start(a)
a<-table.element(a,'Autocorrelation Function',4,TRUE)
a<-table.row.end(a)
a<-table.row.start(a)
a<-table.element(a,'Time lag k',header=TRUE)
a<-table.element(a,hyperlink('basics.htm','ACF(k)','click here for more information about the Autocorrelation Function'),header=TRUE)
a<-table.element(a,'T-STAT',header=TRUE)
a<-table.element(a,'P-value',header=TRUE)
a<-table.row.end(a)
for (i in 2:(par1+1)) {
a<-table.row.start(a)
a<-table.element(a,i-1,header=TRUE)
a<-table.element(a,round(myacf[i],6))
mytstat <- myacf[i]*sqrtn
a<-table.element(a,round(mytstat,4))
a<-table.element(a,round(1-pt(abs(mytstat),lengthx),6))
a<-table.row.end(a)
}
a<-table.end(a)
table.save(a,file='mytable.tab')
a<-table.start()
a<-table.row.start(a)
a<-table.element(a,'Partial Autocorrelation Function',4,TRUE)
a<-table.row.end(a)
a<-table.row.start(a)
a<-table.element(a,'Time lag k',header=TRUE)
a<-table.element(a,hyperlink('basics.htm','PACF(k)','click here for more information about the Partial Autocorrelation Function'),header=TRUE)
a<-table.element(a,'T-STAT',header=TRUE)
a<-table.element(a,'P-value',header=TRUE)
a<-table.row.end(a)
for (i in 1:par1) {
a<-table.row.start(a)
a<-table.element(a,i,header=TRUE)
a<-table.element(a,round(mypacf[i],6))
mytstat <- mypacf[i]*sqrtn
a<-table.element(a,round(mytstat,4))
a<-table.element(a,round(1-pt(abs(mytstat),lengthx),6))
a<-table.row.end(a)
}
a<-table.end(a)
table.save(a,file='mytable1.tab')