Free Statistics

of Irreproducible Research!

Author's title

Author*Unverified author*
R Software Modulerwasp_autocorrelation.wasp
Title produced by software(Partial) Autocorrelation Function
Date of computationSun, 19 Oct 2014 18:28:45 +0100
Cite this page as followsStatistical Computations at FreeStatistics.org, Office for Research Development and Education, URL https://freestatistics.org/blog/index.php?v=date/2014/Oct/19/t1413739752cihzxriyav7l9os.htm/, Retrieved Sun, 12 May 2024 10:11:45 +0000
Statistical Computations at FreeStatistics.org, Office for Research Development and Education, URL https://freestatistics.org/blog/index.php?pk=243712, Retrieved Sun, 12 May 2024 10:11:45 +0000
QR Codes:

Original text written by user:
IsPrivate?No (this computation is public)
User-defined keywords
Estimated Impact60
Family? (F = Feedback message, R = changed R code, M = changed R Module, P = changed Parameters, D = changed Data)
-       [(Partial) Autocorrelation Function] [Invoergegevens EU] [2014-10-19 17:28:45] [c53767938e2c856c14b03e8e32322294] [Current]
Feedback Forum

Post a new message
Dataseries X:
13396
13637
15467
13722
14727
14961
14026
13895
14474
15759
15995
14119
15342
15796
15435
16195
15572
16223
15921
14143
16290
16579
14314
13318
11938
12574
13298
12124
11757
12803
12800
11293
12992
13426
13174
13648
12801
13183
15703
14859
14350
16444
14207
13329
14795
15248
16081
15670
14805
15779
17945
15280
16773
16362
15774
15505
16397
16060
16748
16137
15523
16267
18066
16105
16883
17034
16452
16234
16658
18133
17488
15853
17198
16719
17635
16726
17503
17074
17054
15451
16374
17242
16684
16489


Summary of computational transaction
Raw Inputview raw input (R code)
Raw Outputview raw output of R engine
Computing time1 seconds
R Server'Sir Ronald Aylmer Fisher' @ fisher.wessa.net

\begin{tabular}{lllllllll}
\hline
Summary of computational transaction \tabularnewline
Raw Input & view raw input (R code)  \tabularnewline
Raw Output & view raw output of R engine  \tabularnewline
Computing time & 1 seconds \tabularnewline
R Server & 'Sir Ronald Aylmer Fisher' @ fisher.wessa.net \tabularnewline
\hline
\end{tabular}
%Source: https://freestatistics.org/blog/index.php?pk=243712&T=0

[TABLE]
[ROW][C]Summary of computational transaction[/C][/ROW]
[ROW][C]Raw Input[/C][C]view raw input (R code) [/C][/ROW]
[ROW][C]Raw Output[/C][C]view raw output of R engine [/C][/ROW]
[ROW][C]Computing time[/C][C]1 seconds[/C][/ROW]
[ROW][C]R Server[/C][C]'Sir Ronald Aylmer Fisher' @ fisher.wessa.net[/C][/ROW]
[/TABLE]
Source: https://freestatistics.org/blog/index.php?pk=243712&T=0

Globally Unique Identifier (entire table): ba.freestatistics.org/blog/index.php?pk=243712&T=0

As an alternative you can also use a QR Code:  

The GUIDs for individual cells are displayed in the table below:

Summary of computational transaction
Raw Inputview raw input (R code)
Raw Outputview raw output of R engine
Computing time1 seconds
R Server'Sir Ronald Aylmer Fisher' @ fisher.wessa.net


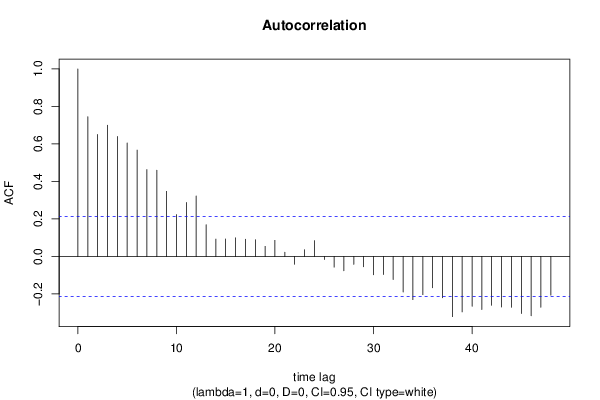
Autocorrelation Function
Time lag kACF(k)T-STATP-value
10.744716.82540
20.6503045.96010
30.6995186.41120
40.6395445.86150
50.6050385.54530
60.5672435.19891e-06
70.4632724.2462.8e-05
80.4598194.21433.1e-05
90.3472763.18280.001023
100.2228722.04270.022111
110.2873022.63320.005034
120.32272.95760.002013
130.1693091.55170.062242
140.0925380.84810.19939
150.0933450.85550.197347
160.0991140.90840.183133
170.0921020.84410.200498
180.0887110.81310.209244
190.0536440.49170.312122
200.0856420.78490.217353
210.0225090.20630.418529
22-0.042063-0.38550.350416
230.0357960.32810.371835
240.0845650.7750.220244
25-0.016173-0.14820.441258
26-0.05691-0.52160.301666
27-0.076215-0.69850.243389
28-0.042154-0.38640.350107
29-0.05508-0.50480.307504
30-0.097995-0.89810.185838
31-0.096552-0.88490.189365
32-0.122683-1.12440.132021
33-0.189326-1.73520.043187
34-0.230522-2.11280.018795
35-0.203699-1.86690.0327
36-0.167069-1.53120.064738
37-0.220353-2.01960.023308
38-0.321134-2.94320.002099
39-0.295755-2.71060.00407
40-0.265988-2.43780.008443
41-0.283185-2.59540.005574
42-0.259933-2.38230.009731
43-0.269475-2.46980.007772
44-0.27144-2.48780.007415
45-0.304478-2.79060.003255
46-0.316187-2.89790.002395
47-0.270967-2.48350.0075
48-0.206512-1.89270.03092

\begin{tabular}{lllllllll}
\hline
Autocorrelation Function \tabularnewline
Time lag k & ACF(k) & T-STAT & P-value \tabularnewline
1 & 0.74471 & 6.8254 & 0 \tabularnewline
2 & 0.650304 & 5.9601 & 0 \tabularnewline
3 & 0.699518 & 6.4112 & 0 \tabularnewline
4 & 0.639544 & 5.8615 & 0 \tabularnewline
5 & 0.605038 & 5.5453 & 0 \tabularnewline
6 & 0.567243 & 5.1989 & 1e-06 \tabularnewline
7 & 0.463272 & 4.246 & 2.8e-05 \tabularnewline
8 & 0.459819 & 4.2143 & 3.1e-05 \tabularnewline
9 & 0.347276 & 3.1828 & 0.001023 \tabularnewline
10 & 0.222872 & 2.0427 & 0.022111 \tabularnewline
11 & 0.287302 & 2.6332 & 0.005034 \tabularnewline
12 & 0.3227 & 2.9576 & 0.002013 \tabularnewline
13 & 0.169309 & 1.5517 & 0.062242 \tabularnewline
14 & 0.092538 & 0.8481 & 0.19939 \tabularnewline
15 & 0.093345 & 0.8555 & 0.197347 \tabularnewline
16 & 0.099114 & 0.9084 & 0.183133 \tabularnewline
17 & 0.092102 & 0.8441 & 0.200498 \tabularnewline
18 & 0.088711 & 0.8131 & 0.209244 \tabularnewline
19 & 0.053644 & 0.4917 & 0.312122 \tabularnewline
20 & 0.085642 & 0.7849 & 0.217353 \tabularnewline
21 & 0.022509 & 0.2063 & 0.418529 \tabularnewline
22 & -0.042063 & -0.3855 & 0.350416 \tabularnewline
23 & 0.035796 & 0.3281 & 0.371835 \tabularnewline
24 & 0.084565 & 0.775 & 0.220244 \tabularnewline
25 & -0.016173 & -0.1482 & 0.441258 \tabularnewline
26 & -0.05691 & -0.5216 & 0.301666 \tabularnewline
27 & -0.076215 & -0.6985 & 0.243389 \tabularnewline
28 & -0.042154 & -0.3864 & 0.350107 \tabularnewline
29 & -0.05508 & -0.5048 & 0.307504 \tabularnewline
30 & -0.097995 & -0.8981 & 0.185838 \tabularnewline
31 & -0.096552 & -0.8849 & 0.189365 \tabularnewline
32 & -0.122683 & -1.1244 & 0.132021 \tabularnewline
33 & -0.189326 & -1.7352 & 0.043187 \tabularnewline
34 & -0.230522 & -2.1128 & 0.018795 \tabularnewline
35 & -0.203699 & -1.8669 & 0.0327 \tabularnewline
36 & -0.167069 & -1.5312 & 0.064738 \tabularnewline
37 & -0.220353 & -2.0196 & 0.023308 \tabularnewline
38 & -0.321134 & -2.9432 & 0.002099 \tabularnewline
39 & -0.295755 & -2.7106 & 0.00407 \tabularnewline
40 & -0.265988 & -2.4378 & 0.008443 \tabularnewline
41 & -0.283185 & -2.5954 & 0.005574 \tabularnewline
42 & -0.259933 & -2.3823 & 0.009731 \tabularnewline
43 & -0.269475 & -2.4698 & 0.007772 \tabularnewline
44 & -0.27144 & -2.4878 & 0.007415 \tabularnewline
45 & -0.304478 & -2.7906 & 0.003255 \tabularnewline
46 & -0.316187 & -2.8979 & 0.002395 \tabularnewline
47 & -0.270967 & -2.4835 & 0.0075 \tabularnewline
48 & -0.206512 & -1.8927 & 0.03092 \tabularnewline
\hline
\end{tabular}
%Source: https://freestatistics.org/blog/index.php?pk=243712&T=1

[TABLE]
[ROW][C]Autocorrelation Function[/C][/ROW]
[ROW][C]Time lag k[/C][C]ACF(k)[/C][C]T-STAT[/C][C]P-value[/C][/ROW]
[ROW][C]1[/C][C]0.74471[/C][C]6.8254[/C][C]0[/C][/ROW]
[ROW][C]2[/C][C]0.650304[/C][C]5.9601[/C][C]0[/C][/ROW]
[ROW][C]3[/C][C]0.699518[/C][C]6.4112[/C][C]0[/C][/ROW]
[ROW][C]4[/C][C]0.639544[/C][C]5.8615[/C][C]0[/C][/ROW]
[ROW][C]5[/C][C]0.605038[/C][C]5.5453[/C][C]0[/C][/ROW]
[ROW][C]6[/C][C]0.567243[/C][C]5.1989[/C][C]1e-06[/C][/ROW]
[ROW][C]7[/C][C]0.463272[/C][C]4.246[/C][C]2.8e-05[/C][/ROW]
[ROW][C]8[/C][C]0.459819[/C][C]4.2143[/C][C]3.1e-05[/C][/ROW]
[ROW][C]9[/C][C]0.347276[/C][C]3.1828[/C][C]0.001023[/C][/ROW]
[ROW][C]10[/C][C]0.222872[/C][C]2.0427[/C][C]0.022111[/C][/ROW]
[ROW][C]11[/C][C]0.287302[/C][C]2.6332[/C][C]0.005034[/C][/ROW]
[ROW][C]12[/C][C]0.3227[/C][C]2.9576[/C][C]0.002013[/C][/ROW]
[ROW][C]13[/C][C]0.169309[/C][C]1.5517[/C][C]0.062242[/C][/ROW]
[ROW][C]14[/C][C]0.092538[/C][C]0.8481[/C][C]0.19939[/C][/ROW]
[ROW][C]15[/C][C]0.093345[/C][C]0.8555[/C][C]0.197347[/C][/ROW]
[ROW][C]16[/C][C]0.099114[/C][C]0.9084[/C][C]0.183133[/C][/ROW]
[ROW][C]17[/C][C]0.092102[/C][C]0.8441[/C][C]0.200498[/C][/ROW]
[ROW][C]18[/C][C]0.088711[/C][C]0.8131[/C][C]0.209244[/C][/ROW]
[ROW][C]19[/C][C]0.053644[/C][C]0.4917[/C][C]0.312122[/C][/ROW]
[ROW][C]20[/C][C]0.085642[/C][C]0.7849[/C][C]0.217353[/C][/ROW]
[ROW][C]21[/C][C]0.022509[/C][C]0.2063[/C][C]0.418529[/C][/ROW]
[ROW][C]22[/C][C]-0.042063[/C][C]-0.3855[/C][C]0.350416[/C][/ROW]
[ROW][C]23[/C][C]0.035796[/C][C]0.3281[/C][C]0.371835[/C][/ROW]
[ROW][C]24[/C][C]0.084565[/C][C]0.775[/C][C]0.220244[/C][/ROW]
[ROW][C]25[/C][C]-0.016173[/C][C]-0.1482[/C][C]0.441258[/C][/ROW]
[ROW][C]26[/C][C]-0.05691[/C][C]-0.5216[/C][C]0.301666[/C][/ROW]
[ROW][C]27[/C][C]-0.076215[/C][C]-0.6985[/C][C]0.243389[/C][/ROW]
[ROW][C]28[/C][C]-0.042154[/C][C]-0.3864[/C][C]0.350107[/C][/ROW]
[ROW][C]29[/C][C]-0.05508[/C][C]-0.5048[/C][C]0.307504[/C][/ROW]
[ROW][C]30[/C][C]-0.097995[/C][C]-0.8981[/C][C]0.185838[/C][/ROW]
[ROW][C]31[/C][C]-0.096552[/C][C]-0.8849[/C][C]0.189365[/C][/ROW]
[ROW][C]32[/C][C]-0.122683[/C][C]-1.1244[/C][C]0.132021[/C][/ROW]
[ROW][C]33[/C][C]-0.189326[/C][C]-1.7352[/C][C]0.043187[/C][/ROW]
[ROW][C]34[/C][C]-0.230522[/C][C]-2.1128[/C][C]0.018795[/C][/ROW]
[ROW][C]35[/C][C]-0.203699[/C][C]-1.8669[/C][C]0.0327[/C][/ROW]
[ROW][C]36[/C][C]-0.167069[/C][C]-1.5312[/C][C]0.064738[/C][/ROW]
[ROW][C]37[/C][C]-0.220353[/C][C]-2.0196[/C][C]0.023308[/C][/ROW]
[ROW][C]38[/C][C]-0.321134[/C][C]-2.9432[/C][C]0.002099[/C][/ROW]
[ROW][C]39[/C][C]-0.295755[/C][C]-2.7106[/C][C]0.00407[/C][/ROW]
[ROW][C]40[/C][C]-0.265988[/C][C]-2.4378[/C][C]0.008443[/C][/ROW]
[ROW][C]41[/C][C]-0.283185[/C][C]-2.5954[/C][C]0.005574[/C][/ROW]
[ROW][C]42[/C][C]-0.259933[/C][C]-2.3823[/C][C]0.009731[/C][/ROW]
[ROW][C]43[/C][C]-0.269475[/C][C]-2.4698[/C][C]0.007772[/C][/ROW]
[ROW][C]44[/C][C]-0.27144[/C][C]-2.4878[/C][C]0.007415[/C][/ROW]
[ROW][C]45[/C][C]-0.304478[/C][C]-2.7906[/C][C]0.003255[/C][/ROW]
[ROW][C]46[/C][C]-0.316187[/C][C]-2.8979[/C][C]0.002395[/C][/ROW]
[ROW][C]47[/C][C]-0.270967[/C][C]-2.4835[/C][C]0.0075[/C][/ROW]
[ROW][C]48[/C][C]-0.206512[/C][C]-1.8927[/C][C]0.03092[/C][/ROW]
[/TABLE]
Source: https://freestatistics.org/blog/index.php?pk=243712&T=1

Globally Unique Identifier (entire table): ba.freestatistics.org/blog/index.php?pk=243712&T=1

As an alternative you can also use a QR Code:  

The GUIDs for individual cells are displayed in the table below:

Autocorrelation Function
Time lag kACF(k)T-STATP-value
10.744716.82540
20.6503045.96010
30.6995186.41120
40.6395445.86150
50.6050385.54530
60.5672435.19891e-06
70.4632724.2462.8e-05
80.4598194.21433.1e-05
90.3472763.18280.001023
100.2228722.04270.022111
110.2873022.63320.005034
120.32272.95760.002013
130.1693091.55170.062242
140.0925380.84810.19939
150.0933450.85550.197347
160.0991140.90840.183133
170.0921020.84410.200498
180.0887110.81310.209244
190.0536440.49170.312122
200.0856420.78490.217353
210.0225090.20630.418529
22-0.042063-0.38550.350416
230.0357960.32810.371835
240.0845650.7750.220244
25-0.016173-0.14820.441258
26-0.05691-0.52160.301666
27-0.076215-0.69850.243389
28-0.042154-0.38640.350107
29-0.05508-0.50480.307504
30-0.097995-0.89810.185838
31-0.096552-0.88490.189365
32-0.122683-1.12440.132021
33-0.189326-1.73520.043187
34-0.230522-2.11280.018795
35-0.203699-1.86690.0327
36-0.167069-1.53120.064738
37-0.220353-2.01960.023308
38-0.321134-2.94320.002099
39-0.295755-2.71060.00407
40-0.265988-2.43780.008443
41-0.283185-2.59540.005574
42-0.259933-2.38230.009731
43-0.269475-2.46980.007772
44-0.27144-2.48780.007415
45-0.304478-2.79060.003255
46-0.316187-2.89790.002395
47-0.270967-2.48350.0075
48-0.206512-1.89270.03092


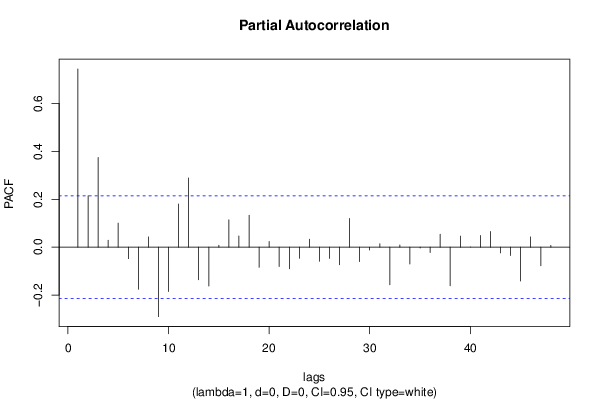
Partial Autocorrelation Function
Time lag kPACF(k)T-STATP-value
10.744716.82540
20.2148851.96950.026099
30.3748913.43590.00046
40.02880.2640.396232
50.1004870.9210.17985
6-0.048066-0.44050.330342
7-0.176078-1.61380.055163
80.0428430.39270.347783
9-0.290451-2.6620.004653
10-0.185493-1.70010.046408
110.1803261.65270.051061
120.2889232.6480.004834
13-0.136243-1.24870.107625
14-0.162689-1.49110.069845
150.0082250.07540.470045
160.1140631.04540.149418
170.0468760.42960.334285
180.1335141.22370.112248
19-0.084419-0.77370.220636
200.0234230.21470.415269
21-0.080818-0.74070.230467
22-0.090193-0.82660.205394
23-0.046688-0.42790.33491
240.0327770.30040.382304
25-0.058823-0.53910.295616
26-0.047081-0.43150.333603
27-0.073499-0.67360.251198
280.1200261.10010.137225
29-0.060381-0.55340.290731
30-0.011859-0.10870.456854
310.0144880.13280.447341
32-0.157133-1.44020.076771
330.0089980.08250.467234
34-0.070535-0.64650.259869
35-0.003742-0.03430.48636
36-0.02234-0.20480.41913
370.0540160.49510.310924
38-0.161568-1.48080.071201
390.0460450.4220.33705
400.0004570.00420.498335
410.048530.44480.328809
420.0656920.60210.274372
43-0.024069-0.22060.412971
44-0.03499-0.32070.37462
45-0.141666-1.29840.098853
460.0428270.39250.347835
47-0.078077-0.71560.238114
480.0073190.06710.473338

\begin{tabular}{lllllllll}
\hline
Partial Autocorrelation Function \tabularnewline
Time lag k & PACF(k) & T-STAT & P-value \tabularnewline
1 & 0.74471 & 6.8254 & 0 \tabularnewline
2 & 0.214885 & 1.9695 & 0.026099 \tabularnewline
3 & 0.374891 & 3.4359 & 0.00046 \tabularnewline
4 & 0.0288 & 0.264 & 0.396232 \tabularnewline
5 & 0.100487 & 0.921 & 0.17985 \tabularnewline
6 & -0.048066 & -0.4405 & 0.330342 \tabularnewline
7 & -0.176078 & -1.6138 & 0.055163 \tabularnewline
8 & 0.042843 & 0.3927 & 0.347783 \tabularnewline
9 & -0.290451 & -2.662 & 0.004653 \tabularnewline
10 & -0.185493 & -1.7001 & 0.046408 \tabularnewline
11 & 0.180326 & 1.6527 & 0.051061 \tabularnewline
12 & 0.288923 & 2.648 & 0.004834 \tabularnewline
13 & -0.136243 & -1.2487 & 0.107625 \tabularnewline
14 & -0.162689 & -1.4911 & 0.069845 \tabularnewline
15 & 0.008225 & 0.0754 & 0.470045 \tabularnewline
16 & 0.114063 & 1.0454 & 0.149418 \tabularnewline
17 & 0.046876 & 0.4296 & 0.334285 \tabularnewline
18 & 0.133514 & 1.2237 & 0.112248 \tabularnewline
19 & -0.084419 & -0.7737 & 0.220636 \tabularnewline
20 & 0.023423 & 0.2147 & 0.415269 \tabularnewline
21 & -0.080818 & -0.7407 & 0.230467 \tabularnewline
22 & -0.090193 & -0.8266 & 0.205394 \tabularnewline
23 & -0.046688 & -0.4279 & 0.33491 \tabularnewline
24 & 0.032777 & 0.3004 & 0.382304 \tabularnewline
25 & -0.058823 & -0.5391 & 0.295616 \tabularnewline
26 & -0.047081 & -0.4315 & 0.333603 \tabularnewline
27 & -0.073499 & -0.6736 & 0.251198 \tabularnewline
28 & 0.120026 & 1.1001 & 0.137225 \tabularnewline
29 & -0.060381 & -0.5534 & 0.290731 \tabularnewline
30 & -0.011859 & -0.1087 & 0.456854 \tabularnewline
31 & 0.014488 & 0.1328 & 0.447341 \tabularnewline
32 & -0.157133 & -1.4402 & 0.076771 \tabularnewline
33 & 0.008998 & 0.0825 & 0.467234 \tabularnewline
34 & -0.070535 & -0.6465 & 0.259869 \tabularnewline
35 & -0.003742 & -0.0343 & 0.48636 \tabularnewline
36 & -0.02234 & -0.2048 & 0.41913 \tabularnewline
37 & 0.054016 & 0.4951 & 0.310924 \tabularnewline
38 & -0.161568 & -1.4808 & 0.071201 \tabularnewline
39 & 0.046045 & 0.422 & 0.33705 \tabularnewline
40 & 0.000457 & 0.0042 & 0.498335 \tabularnewline
41 & 0.04853 & 0.4448 & 0.328809 \tabularnewline
42 & 0.065692 & 0.6021 & 0.274372 \tabularnewline
43 & -0.024069 & -0.2206 & 0.412971 \tabularnewline
44 & -0.03499 & -0.3207 & 0.37462 \tabularnewline
45 & -0.141666 & -1.2984 & 0.098853 \tabularnewline
46 & 0.042827 & 0.3925 & 0.347835 \tabularnewline
47 & -0.078077 & -0.7156 & 0.238114 \tabularnewline
48 & 0.007319 & 0.0671 & 0.473338 \tabularnewline
\hline
\end{tabular}
%Source: https://freestatistics.org/blog/index.php?pk=243712&T=2

[TABLE]
[ROW][C]Partial Autocorrelation Function[/C][/ROW]
[ROW][C]Time lag k[/C][C]PACF(k)[/C][C]T-STAT[/C][C]P-value[/C][/ROW]
[ROW][C]1[/C][C]0.74471[/C][C]6.8254[/C][C]0[/C][/ROW]
[ROW][C]2[/C][C]0.214885[/C][C]1.9695[/C][C]0.026099[/C][/ROW]
[ROW][C]3[/C][C]0.374891[/C][C]3.4359[/C][C]0.00046[/C][/ROW]
[ROW][C]4[/C][C]0.0288[/C][C]0.264[/C][C]0.396232[/C][/ROW]
[ROW][C]5[/C][C]0.100487[/C][C]0.921[/C][C]0.17985[/C][/ROW]
[ROW][C]6[/C][C]-0.048066[/C][C]-0.4405[/C][C]0.330342[/C][/ROW]
[ROW][C]7[/C][C]-0.176078[/C][C]-1.6138[/C][C]0.055163[/C][/ROW]
[ROW][C]8[/C][C]0.042843[/C][C]0.3927[/C][C]0.347783[/C][/ROW]
[ROW][C]9[/C][C]-0.290451[/C][C]-2.662[/C][C]0.004653[/C][/ROW]
[ROW][C]10[/C][C]-0.185493[/C][C]-1.7001[/C][C]0.046408[/C][/ROW]
[ROW][C]11[/C][C]0.180326[/C][C]1.6527[/C][C]0.051061[/C][/ROW]
[ROW][C]12[/C][C]0.288923[/C][C]2.648[/C][C]0.004834[/C][/ROW]
[ROW][C]13[/C][C]-0.136243[/C][C]-1.2487[/C][C]0.107625[/C][/ROW]
[ROW][C]14[/C][C]-0.162689[/C][C]-1.4911[/C][C]0.069845[/C][/ROW]
[ROW][C]15[/C][C]0.008225[/C][C]0.0754[/C][C]0.470045[/C][/ROW]
[ROW][C]16[/C][C]0.114063[/C][C]1.0454[/C][C]0.149418[/C][/ROW]
[ROW][C]17[/C][C]0.046876[/C][C]0.4296[/C][C]0.334285[/C][/ROW]
[ROW][C]18[/C][C]0.133514[/C][C]1.2237[/C][C]0.112248[/C][/ROW]
[ROW][C]19[/C][C]-0.084419[/C][C]-0.7737[/C][C]0.220636[/C][/ROW]
[ROW][C]20[/C][C]0.023423[/C][C]0.2147[/C][C]0.415269[/C][/ROW]
[ROW][C]21[/C][C]-0.080818[/C][C]-0.7407[/C][C]0.230467[/C][/ROW]
[ROW][C]22[/C][C]-0.090193[/C][C]-0.8266[/C][C]0.205394[/C][/ROW]
[ROW][C]23[/C][C]-0.046688[/C][C]-0.4279[/C][C]0.33491[/C][/ROW]
[ROW][C]24[/C][C]0.032777[/C][C]0.3004[/C][C]0.382304[/C][/ROW]
[ROW][C]25[/C][C]-0.058823[/C][C]-0.5391[/C][C]0.295616[/C][/ROW]
[ROW][C]26[/C][C]-0.047081[/C][C]-0.4315[/C][C]0.333603[/C][/ROW]
[ROW][C]27[/C][C]-0.073499[/C][C]-0.6736[/C][C]0.251198[/C][/ROW]
[ROW][C]28[/C][C]0.120026[/C][C]1.1001[/C][C]0.137225[/C][/ROW]
[ROW][C]29[/C][C]-0.060381[/C][C]-0.5534[/C][C]0.290731[/C][/ROW]
[ROW][C]30[/C][C]-0.011859[/C][C]-0.1087[/C][C]0.456854[/C][/ROW]
[ROW][C]31[/C][C]0.014488[/C][C]0.1328[/C][C]0.447341[/C][/ROW]
[ROW][C]32[/C][C]-0.157133[/C][C]-1.4402[/C][C]0.076771[/C][/ROW]
[ROW][C]33[/C][C]0.008998[/C][C]0.0825[/C][C]0.467234[/C][/ROW]
[ROW][C]34[/C][C]-0.070535[/C][C]-0.6465[/C][C]0.259869[/C][/ROW]
[ROW][C]35[/C][C]-0.003742[/C][C]-0.0343[/C][C]0.48636[/C][/ROW]
[ROW][C]36[/C][C]-0.02234[/C][C]-0.2048[/C][C]0.41913[/C][/ROW]
[ROW][C]37[/C][C]0.054016[/C][C]0.4951[/C][C]0.310924[/C][/ROW]
[ROW][C]38[/C][C]-0.161568[/C][C]-1.4808[/C][C]0.071201[/C][/ROW]
[ROW][C]39[/C][C]0.046045[/C][C]0.422[/C][C]0.33705[/C][/ROW]
[ROW][C]40[/C][C]0.000457[/C][C]0.0042[/C][C]0.498335[/C][/ROW]
[ROW][C]41[/C][C]0.04853[/C][C]0.4448[/C][C]0.328809[/C][/ROW]
[ROW][C]42[/C][C]0.065692[/C][C]0.6021[/C][C]0.274372[/C][/ROW]
[ROW][C]43[/C][C]-0.024069[/C][C]-0.2206[/C][C]0.412971[/C][/ROW]
[ROW][C]44[/C][C]-0.03499[/C][C]-0.3207[/C][C]0.37462[/C][/ROW]
[ROW][C]45[/C][C]-0.141666[/C][C]-1.2984[/C][C]0.098853[/C][/ROW]
[ROW][C]46[/C][C]0.042827[/C][C]0.3925[/C][C]0.347835[/C][/ROW]
[ROW][C]47[/C][C]-0.078077[/C][C]-0.7156[/C][C]0.238114[/C][/ROW]
[ROW][C]48[/C][C]0.007319[/C][C]0.0671[/C][C]0.473338[/C][/ROW]
[/TABLE]
Source: https://freestatistics.org/blog/index.php?pk=243712&T=2

Globally Unique Identifier (entire table): ba.freestatistics.org/blog/index.php?pk=243712&T=2

As an alternative you can also use a QR Code:  

The GUIDs for individual cells are displayed in the table below:

Partial Autocorrelation Function
Time lag kPACF(k)T-STATP-value
10.744716.82540
20.2148851.96950.026099
30.3748913.43590.00046
40.02880.2640.396232
50.1004870.9210.17985
6-0.048066-0.44050.330342
7-0.176078-1.61380.055163
80.0428430.39270.347783
9-0.290451-2.6620.004653
10-0.185493-1.70010.046408
110.1803261.65270.051061
120.2889232.6480.004834
13-0.136243-1.24870.107625
14-0.162689-1.49110.069845
150.0082250.07540.470045
160.1140631.04540.149418
170.0468760.42960.334285
180.1335141.22370.112248
19-0.084419-0.77370.220636
200.0234230.21470.415269
21-0.080818-0.74070.230467
22-0.090193-0.82660.205394
23-0.046688-0.42790.33491
240.0327770.30040.382304
25-0.058823-0.53910.295616
26-0.047081-0.43150.333603
27-0.073499-0.67360.251198
280.1200261.10010.137225
29-0.060381-0.55340.290731
30-0.011859-0.10870.456854
310.0144880.13280.447341
32-0.157133-1.44020.076771
330.0089980.08250.467234
34-0.070535-0.64650.259869
35-0.003742-0.03430.48636
36-0.02234-0.20480.41913
370.0540160.49510.310924
38-0.161568-1.48080.071201
390.0460450.4220.33705
400.0004570.00420.498335
410.048530.44480.328809
420.0656920.60210.274372
43-0.024069-0.22060.412971
44-0.03499-0.32070.37462
45-0.141666-1.29840.098853
460.0428270.39250.347835
47-0.078077-0.71560.238114
480.0073190.06710.473338


Parameters (Session):
par1 = 48 ; par2 = 1 ; par3 = 0 ; par4 = 0 ; par5 = 12 ; par6 = White Noise ; par7 = 0.95 ;
Parameters (R input):
par1 = 48 ; par2 = 1 ; par3 = 0 ; par4 = 0 ; par5 = 12 ; par6 = White Noise ; par7 = 0.95 ; par8 = ;
R code (references can be found in the software module):
if (par1 == 'Default') {
par1 = 10*log10(length(x))
} else {
par1 <- as.numeric(par1)
}
par2 <- as.numeric(par2)
par3 <- as.numeric(par3)
par4 <- as.numeric(par4)
par5 <- as.numeric(par5)
if (par6 == 'White Noise') par6 <- 'white' else par6 <- 'ma'
par7 <- as.numeric(par7)
if (par8 != '') par8 <- as.numeric(par8)
ox <- x
if (par8 == '') {
if (par2 == 0) {
x <- log(x)
} else {
x <- (x ^ par2 - 1) / par2
}
} else {
x <- log(x,base=par8)
}
if (par3 > 0) x <- diff(x,lag=1,difference=par3)
if (par4 > 0) x <- diff(x,lag=par5,difference=par4)
bitmap(file='picts.png')
op <- par(mfrow=c(2,1))
plot(ox,type='l',main='Original Time Series',xlab='time',ylab='value')
if (par8=='') {
mytitle <- paste('Working Time Series (lambda=',par2,', d=',par3,', D=',par4,')',sep='')
mysub <- paste('(lambda=',par2,', d=',par3,', D=',par4,', CI=', par7, ', CI type=',par6,')',sep='')
} else {
mytitle <- paste('Working Time Series (base=',par8,', d=',par3,', D=',par4,')',sep='')
mysub <- paste('(base=',par8,', d=',par3,', D=',par4,', CI=', par7, ', CI type=',par6,')',sep='')
}
plot(x,type='l', main=mytitle,xlab='time',ylab='value')
par(op)
dev.off()
bitmap(file='pic1.png')
racf <- acf(x, par1, main='Autocorrelation', xlab='time lag', ylab='ACF', ci.type=par6, ci=par7, sub=mysub)
dev.off()
bitmap(file='pic2.png')
rpacf <- pacf(x,par1,main='Partial Autocorrelation',xlab='lags',ylab='PACF',sub=mysub)
dev.off()
(myacf <- c(racf$acf))
(mypacf <- c(rpacf$acf))
lengthx <- length(x)
sqrtn <- sqrt(lengthx)
load(file='createtable')
a<-table.start()
a<-table.row.start(a)
a<-table.element(a,'Autocorrelation Function',4,TRUE)
a<-table.row.end(a)
a<-table.row.start(a)
a<-table.element(a,'Time lag k',header=TRUE)
a<-table.element(a,hyperlink('basics.htm','ACF(k)','click here for more information about the Autocorrelation Function'),header=TRUE)
a<-table.element(a,'T-STAT',header=TRUE)
a<-table.element(a,'P-value',header=TRUE)
a<-table.row.end(a)
for (i in 2:(par1+1)) {
a<-table.row.start(a)
a<-table.element(a,i-1,header=TRUE)
a<-table.element(a,round(myacf[i],6))
mytstat <- myacf[i]*sqrtn
a<-table.element(a,round(mytstat,4))
a<-table.element(a,round(1-pt(abs(mytstat),lengthx),6))
a<-table.row.end(a)
}
a<-table.end(a)
table.save(a,file='mytable.tab')
a<-table.start()
a<-table.row.start(a)
a<-table.element(a,'Partial Autocorrelation Function',4,TRUE)
a<-table.row.end(a)
a<-table.row.start(a)
a<-table.element(a,'Time lag k',header=TRUE)
a<-table.element(a,hyperlink('basics.htm','PACF(k)','click here for more information about the Partial Autocorrelation Function'),header=TRUE)
a<-table.element(a,'T-STAT',header=TRUE)
a<-table.element(a,'P-value',header=TRUE)
a<-table.row.end(a)
for (i in 1:par1) {
a<-table.row.start(a)
a<-table.element(a,i,header=TRUE)
a<-table.element(a,round(mypacf[i],6))
mytstat <- mypacf[i]*sqrtn
a<-table.element(a,round(mytstat,4))
a<-table.element(a,round(1-pt(abs(mytstat),lengthx),6))
a<-table.row.end(a)
}
a<-table.end(a)
table.save(a,file='mytable1.tab')