Free Statistics

of Irreproducible Research!

Author's title

Author*Unverified author*
R Software Modulerwasp_autocorrelation.wasp
Title produced by software(Partial) Autocorrelation Function
Date of computationSun, 19 Oct 2014 15:34:38 +0100
Cite this page as followsStatistical Computations at FreeStatistics.org, Office for Research Development and Education, URL https://freestatistics.org/blog/index.php?v=date/2014/Oct/19/t14137293194pv22pk5hxm2ntx.htm/, Retrieved Sat, 11 May 2024 19:18:22 +0000
Statistical Computations at FreeStatistics.org, Office for Research Development and Education, URL https://freestatistics.org/blog/index.php?pk=243660, Retrieved Sat, 11 May 2024 19:18:22 +0000
QR Codes:

Original text written by user:
IsPrivate?No (this computation is public)
User-defined keywords
Estimated Impact63
Family? (F = Feedback message, R = changed R code, M = changed R Module, P = changed Parameters, D = changed Data)
-       [(Partial) Autocorrelation Function] [Werkloosheid vana...] [2014-10-19 14:34:38] [f3f8000f3957416038d6f50ac60d9d25] [Current]
Feedback Forum

Post a new message
Dataseries X:
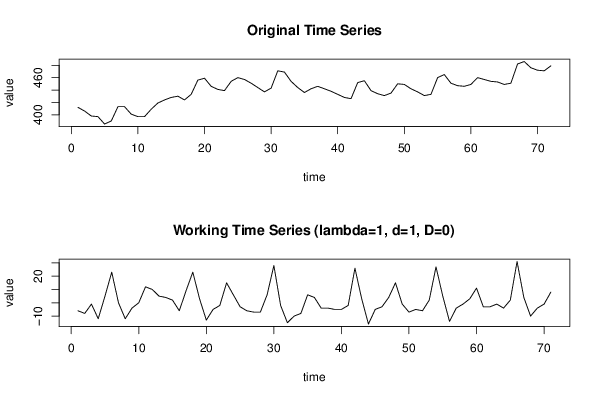
412
406
398
397
385
390
413
413
401
397
397
409
419
424
428
430
424
433
456
459
446
441
439
454
460
457
451
444
437
443
471
469
454
444
436
442
446
442
438
433
428
426
452
455
439
434
431
435
450
449
442
437
431
433
460
465
451
447
446
449
460
457
454
453
449
451
482
486
476
472
471
479


Summary of computational transaction
Raw Inputview raw input (R code)
Raw Outputview raw output of R engine
Computing time2 seconds
R Server'George Udny Yule' @ yule.wessa.net

\begin{tabular}{lllllllll}
\hline
Summary of computational transaction \tabularnewline
Raw Input & view raw input (R code)  \tabularnewline
Raw Output & view raw output of R engine  \tabularnewline
Computing time & 2 seconds \tabularnewline
R Server & 'George Udny Yule' @ yule.wessa.net \tabularnewline
\hline
\end{tabular}
%Source: https://freestatistics.org/blog/index.php?pk=243660&T=0

[TABLE]
[ROW][C]Summary of computational transaction[/C][/ROW]
[ROW][C]Raw Input[/C][C]view raw input (R code) [/C][/ROW]
[ROW][C]Raw Output[/C][C]view raw output of R engine [/C][/ROW]
[ROW][C]Computing time[/C][C]2 seconds[/C][/ROW]
[ROW][C]R Server[/C][C]'George Udny Yule' @ yule.wessa.net[/C][/ROW]
[/TABLE]
Source: https://freestatistics.org/blog/index.php?pk=243660&T=0

Globally Unique Identifier (entire table): ba.freestatistics.org/blog/index.php?pk=243660&T=0

As an alternative you can also use a QR Code:  

The GUIDs for individual cells are displayed in the table below:

Summary of computational transaction
Raw Inputview raw input (R code)
Raw Outputview raw output of R engine
Computing time2 seconds
R Server'George Udny Yule' @ yule.wessa.net


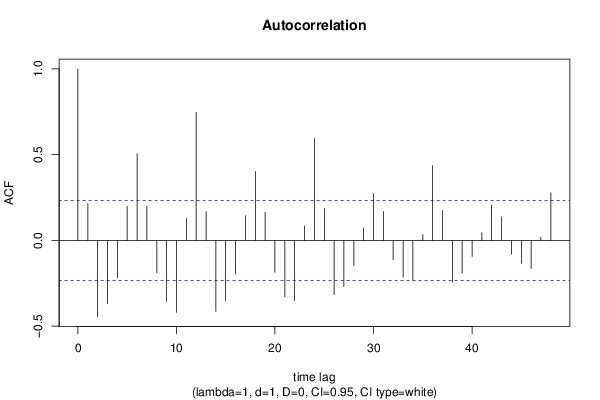
Autocorrelation Function
Time lag kACF(k)T-STATP-value
10.2152631.81380.036964
2-0.444151-3.74250.000183
3-0.368469-3.10480.001368
4-0.216759-1.82640.035993
50.1981361.66950.049708
60.5055154.25953.1e-05
70.198011.66850.049814
8-0.188897-1.59170.057951
9-0.353988-2.98280.001956
10-0.41893-3.530.000367
110.1299691.09510.138579
120.7479346.30220
130.1671211.40820.08172
14-0.412576-3.47640.000436
15-0.35242-2.96950.002033
16-0.194659-1.64020.052691
170.1445691.21820.113597
180.4018293.38590.00058
190.1638641.38070.085845
20-0.185139-1.560.061603
21-0.328892-2.77130.003562
22-0.350513-2.95350.002129
230.0841620.70920.240274
240.5938735.00412e-06
250.1864811.57130.060278
26-0.315339-2.65710.004864
27-0.268858-2.26540.013269
28-0.14572-1.22790.111777
290.0726210.61190.271276
300.2734982.30450.01206
310.1693341.42680.079005
32-0.11185-0.94250.174575
33-0.213774-1.80130.037952
34-0.231463-1.95030.027542
350.0343850.28970.386433
360.4358073.67220.000231
370.1745421.47070.072893
38-0.241919-2.03840.022615
39-0.188809-1.59090.058033
40-0.092792-0.78190.218443
410.0448960.37830.35317
420.2051951.7290.044077
430.1371971.1560.12577
44-0.080469-0.6780.249974
45-0.132939-1.12020.133209
46-0.16265-1.37050.087423
470.018140.15280.439476
480.2781812.3440.010941

\begin{tabular}{lllllllll}
\hline
Autocorrelation Function \tabularnewline
Time lag k & ACF(k) & T-STAT & P-value \tabularnewline
1 & 0.215263 & 1.8138 & 0.036964 \tabularnewline
2 & -0.444151 & -3.7425 & 0.000183 \tabularnewline
3 & -0.368469 & -3.1048 & 0.001368 \tabularnewline
4 & -0.216759 & -1.8264 & 0.035993 \tabularnewline
5 & 0.198136 & 1.6695 & 0.049708 \tabularnewline
6 & 0.505515 & 4.2595 & 3.1e-05 \tabularnewline
7 & 0.19801 & 1.6685 & 0.049814 \tabularnewline
8 & -0.188897 & -1.5917 & 0.057951 \tabularnewline
9 & -0.353988 & -2.9828 & 0.001956 \tabularnewline
10 & -0.41893 & -3.53 & 0.000367 \tabularnewline
11 & 0.129969 & 1.0951 & 0.138579 \tabularnewline
12 & 0.747934 & 6.3022 & 0 \tabularnewline
13 & 0.167121 & 1.4082 & 0.08172 \tabularnewline
14 & -0.412576 & -3.4764 & 0.000436 \tabularnewline
15 & -0.35242 & -2.9695 & 0.002033 \tabularnewline
16 & -0.194659 & -1.6402 & 0.052691 \tabularnewline
17 & 0.144569 & 1.2182 & 0.113597 \tabularnewline
18 & 0.401829 & 3.3859 & 0.00058 \tabularnewline
19 & 0.163864 & 1.3807 & 0.085845 \tabularnewline
20 & -0.185139 & -1.56 & 0.061603 \tabularnewline
21 & -0.328892 & -2.7713 & 0.003562 \tabularnewline
22 & -0.350513 & -2.9535 & 0.002129 \tabularnewline
23 & 0.084162 & 0.7092 & 0.240274 \tabularnewline
24 & 0.593873 & 5.0041 & 2e-06 \tabularnewline
25 & 0.186481 & 1.5713 & 0.060278 \tabularnewline
26 & -0.315339 & -2.6571 & 0.004864 \tabularnewline
27 & -0.268858 & -2.2654 & 0.013269 \tabularnewline
28 & -0.14572 & -1.2279 & 0.111777 \tabularnewline
29 & 0.072621 & 0.6119 & 0.271276 \tabularnewline
30 & 0.273498 & 2.3045 & 0.01206 \tabularnewline
31 & 0.169334 & 1.4268 & 0.079005 \tabularnewline
32 & -0.11185 & -0.9425 & 0.174575 \tabularnewline
33 & -0.213774 & -1.8013 & 0.037952 \tabularnewline
34 & -0.231463 & -1.9503 & 0.027542 \tabularnewline
35 & 0.034385 & 0.2897 & 0.386433 \tabularnewline
36 & 0.435807 & 3.6722 & 0.000231 \tabularnewline
37 & 0.174542 & 1.4707 & 0.072893 \tabularnewline
38 & -0.241919 & -2.0384 & 0.022615 \tabularnewline
39 & -0.188809 & -1.5909 & 0.058033 \tabularnewline
40 & -0.092792 & -0.7819 & 0.218443 \tabularnewline
41 & 0.044896 & 0.3783 & 0.35317 \tabularnewline
42 & 0.205195 & 1.729 & 0.044077 \tabularnewline
43 & 0.137197 & 1.156 & 0.12577 \tabularnewline
44 & -0.080469 & -0.678 & 0.249974 \tabularnewline
45 & -0.132939 & -1.1202 & 0.133209 \tabularnewline
46 & -0.16265 & -1.3705 & 0.087423 \tabularnewline
47 & 0.01814 & 0.1528 & 0.439476 \tabularnewline
48 & 0.278181 & 2.344 & 0.010941 \tabularnewline
\hline
\end{tabular}
%Source: https://freestatistics.org/blog/index.php?pk=243660&T=1

[TABLE]
[ROW][C]Autocorrelation Function[/C][/ROW]
[ROW][C]Time lag k[/C][C]ACF(k)[/C][C]T-STAT[/C][C]P-value[/C][/ROW]
[ROW][C]1[/C][C]0.215263[/C][C]1.8138[/C][C]0.036964[/C][/ROW]
[ROW][C]2[/C][C]-0.444151[/C][C]-3.7425[/C][C]0.000183[/C][/ROW]
[ROW][C]3[/C][C]-0.368469[/C][C]-3.1048[/C][C]0.001368[/C][/ROW]
[ROW][C]4[/C][C]-0.216759[/C][C]-1.8264[/C][C]0.035993[/C][/ROW]
[ROW][C]5[/C][C]0.198136[/C][C]1.6695[/C][C]0.049708[/C][/ROW]
[ROW][C]6[/C][C]0.505515[/C][C]4.2595[/C][C]3.1e-05[/C][/ROW]
[ROW][C]7[/C][C]0.19801[/C][C]1.6685[/C][C]0.049814[/C][/ROW]
[ROW][C]8[/C][C]-0.188897[/C][C]-1.5917[/C][C]0.057951[/C][/ROW]
[ROW][C]9[/C][C]-0.353988[/C][C]-2.9828[/C][C]0.001956[/C][/ROW]
[ROW][C]10[/C][C]-0.41893[/C][C]-3.53[/C][C]0.000367[/C][/ROW]
[ROW][C]11[/C][C]0.129969[/C][C]1.0951[/C][C]0.138579[/C][/ROW]
[ROW][C]12[/C][C]0.747934[/C][C]6.3022[/C][C]0[/C][/ROW]
[ROW][C]13[/C][C]0.167121[/C][C]1.4082[/C][C]0.08172[/C][/ROW]
[ROW][C]14[/C][C]-0.412576[/C][C]-3.4764[/C][C]0.000436[/C][/ROW]
[ROW][C]15[/C][C]-0.35242[/C][C]-2.9695[/C][C]0.002033[/C][/ROW]
[ROW][C]16[/C][C]-0.194659[/C][C]-1.6402[/C][C]0.052691[/C][/ROW]
[ROW][C]17[/C][C]0.144569[/C][C]1.2182[/C][C]0.113597[/C][/ROW]
[ROW][C]18[/C][C]0.401829[/C][C]3.3859[/C][C]0.00058[/C][/ROW]
[ROW][C]19[/C][C]0.163864[/C][C]1.3807[/C][C]0.085845[/C][/ROW]
[ROW][C]20[/C][C]-0.185139[/C][C]-1.56[/C][C]0.061603[/C][/ROW]
[ROW][C]21[/C][C]-0.328892[/C][C]-2.7713[/C][C]0.003562[/C][/ROW]
[ROW][C]22[/C][C]-0.350513[/C][C]-2.9535[/C][C]0.002129[/C][/ROW]
[ROW][C]23[/C][C]0.084162[/C][C]0.7092[/C][C]0.240274[/C][/ROW]
[ROW][C]24[/C][C]0.593873[/C][C]5.0041[/C][C]2e-06[/C][/ROW]
[ROW][C]25[/C][C]0.186481[/C][C]1.5713[/C][C]0.060278[/C][/ROW]
[ROW][C]26[/C][C]-0.315339[/C][C]-2.6571[/C][C]0.004864[/C][/ROW]
[ROW][C]27[/C][C]-0.268858[/C][C]-2.2654[/C][C]0.013269[/C][/ROW]
[ROW][C]28[/C][C]-0.14572[/C][C]-1.2279[/C][C]0.111777[/C][/ROW]
[ROW][C]29[/C][C]0.072621[/C][C]0.6119[/C][C]0.271276[/C][/ROW]
[ROW][C]30[/C][C]0.273498[/C][C]2.3045[/C][C]0.01206[/C][/ROW]
[ROW][C]31[/C][C]0.169334[/C][C]1.4268[/C][C]0.079005[/C][/ROW]
[ROW][C]32[/C][C]-0.11185[/C][C]-0.9425[/C][C]0.174575[/C][/ROW]
[ROW][C]33[/C][C]-0.213774[/C][C]-1.8013[/C][C]0.037952[/C][/ROW]
[ROW][C]34[/C][C]-0.231463[/C][C]-1.9503[/C][C]0.027542[/C][/ROW]
[ROW][C]35[/C][C]0.034385[/C][C]0.2897[/C][C]0.386433[/C][/ROW]
[ROW][C]36[/C][C]0.435807[/C][C]3.6722[/C][C]0.000231[/C][/ROW]
[ROW][C]37[/C][C]0.174542[/C][C]1.4707[/C][C]0.072893[/C][/ROW]
[ROW][C]38[/C][C]-0.241919[/C][C]-2.0384[/C][C]0.022615[/C][/ROW]
[ROW][C]39[/C][C]-0.188809[/C][C]-1.5909[/C][C]0.058033[/C][/ROW]
[ROW][C]40[/C][C]-0.092792[/C][C]-0.7819[/C][C]0.218443[/C][/ROW]
[ROW][C]41[/C][C]0.044896[/C][C]0.3783[/C][C]0.35317[/C][/ROW]
[ROW][C]42[/C][C]0.205195[/C][C]1.729[/C][C]0.044077[/C][/ROW]
[ROW][C]43[/C][C]0.137197[/C][C]1.156[/C][C]0.12577[/C][/ROW]
[ROW][C]44[/C][C]-0.080469[/C][C]-0.678[/C][C]0.249974[/C][/ROW]
[ROW][C]45[/C][C]-0.132939[/C][C]-1.1202[/C][C]0.133209[/C][/ROW]
[ROW][C]46[/C][C]-0.16265[/C][C]-1.3705[/C][C]0.087423[/C][/ROW]
[ROW][C]47[/C][C]0.01814[/C][C]0.1528[/C][C]0.439476[/C][/ROW]
[ROW][C]48[/C][C]0.278181[/C][C]2.344[/C][C]0.010941[/C][/ROW]
[/TABLE]
Source: https://freestatistics.org/blog/index.php?pk=243660&T=1

Globally Unique Identifier (entire table): ba.freestatistics.org/blog/index.php?pk=243660&T=1

As an alternative you can also use a QR Code:  

The GUIDs for individual cells are displayed in the table below:

Autocorrelation Function
Time lag kACF(k)T-STATP-value
10.2152631.81380.036964
2-0.444151-3.74250.000183
3-0.368469-3.10480.001368
4-0.216759-1.82640.035993
50.1981361.66950.049708
60.5055154.25953.1e-05
70.198011.66850.049814
8-0.188897-1.59170.057951
9-0.353988-2.98280.001956
10-0.41893-3.530.000367
110.1299691.09510.138579
120.7479346.30220
130.1671211.40820.08172
14-0.412576-3.47640.000436
15-0.35242-2.96950.002033
16-0.194659-1.64020.052691
170.1445691.21820.113597
180.4018293.38590.00058
190.1638641.38070.085845
20-0.185139-1.560.061603
21-0.328892-2.77130.003562
22-0.350513-2.95350.002129
230.0841620.70920.240274
240.5938735.00412e-06
250.1864811.57130.060278
26-0.315339-2.65710.004864
27-0.268858-2.26540.013269
28-0.14572-1.22790.111777
290.0726210.61190.271276
300.2734982.30450.01206
310.1693341.42680.079005
32-0.11185-0.94250.174575
33-0.213774-1.80130.037952
34-0.231463-1.95030.027542
350.0343850.28970.386433
360.4358073.67220.000231
370.1745421.47070.072893
38-0.241919-2.03840.022615
39-0.188809-1.59090.058033
40-0.092792-0.78190.218443
410.0448960.37830.35317
420.2051951.7290.044077
430.1371971.1560.12577
44-0.080469-0.6780.249974
45-0.132939-1.12020.133209
46-0.16265-1.37050.087423
470.018140.15280.439476
480.2781812.3440.010941


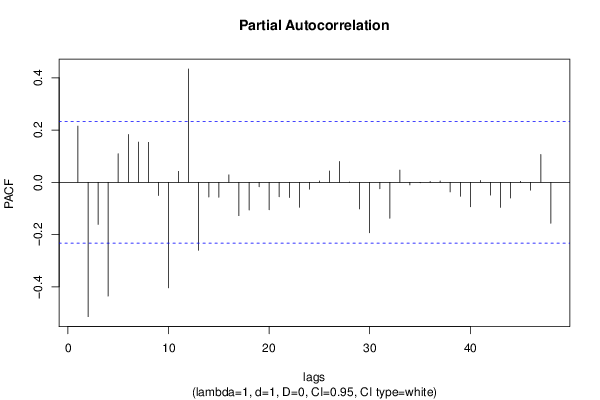
Partial Autocorrelation Function
Time lag kPACF(k)T-STATP-value
10.2152631.81380.036964
2-0.514322-4.33382.4e-05
3-0.161068-1.35720.089512
4-0.435622-3.67060.000232
50.1095010.92270.179652
60.183491.54610.063261
70.1540571.29810.099226
80.1531051.29010.100603
9-0.050315-0.4240.336438
10-0.404029-3.40440.000547
110.0420910.35470.361945
120.4341233.6580.000242
13-0.260021-2.1910.015869
14-0.056533-0.47640.317641
15-0.057268-0.48250.315451
160.0285740.24080.405213
17-0.127421-1.07370.143303
18-0.106183-0.89470.186982
19-0.017073-0.14390.443011
20-0.10503-0.8850.189573
21-0.055151-0.46470.32178
22-0.058333-0.49150.312288
23-0.095147-0.80170.212694
24-0.026089-0.21980.413318
250.0048230.04060.483847
260.0435510.3670.357366
270.0796520.67120.252148
280.0012180.01030.49592
29-0.101596-0.85610.197422
30-0.193374-1.62940.053829
31-0.02487-0.20960.417308
32-0.137591-1.15940.125097
330.0466680.39320.347664
34-0.00983-0.08280.467109
35-0.001363-0.01150.495435
360.0029970.02530.489962
370.0052950.04460.482269
38-0.036697-0.30920.37903
39-0.053153-0.44790.327805
40-0.093746-0.78990.216103
410.0073090.06160.475534
42-0.048895-0.4120.34079
43-0.096006-0.8090.210619
44-0.059823-0.50410.307885
450.0036580.03080.487748
46-0.030032-0.25310.400479
470.1065060.89740.186261
48-0.156431-1.31810.095852

\begin{tabular}{lllllllll}
\hline
Partial Autocorrelation Function \tabularnewline
Time lag k & PACF(k) & T-STAT & P-value \tabularnewline
1 & 0.215263 & 1.8138 & 0.036964 \tabularnewline
2 & -0.514322 & -4.3338 & 2.4e-05 \tabularnewline
3 & -0.161068 & -1.3572 & 0.089512 \tabularnewline
4 & -0.435622 & -3.6706 & 0.000232 \tabularnewline
5 & 0.109501 & 0.9227 & 0.179652 \tabularnewline
6 & 0.18349 & 1.5461 & 0.063261 \tabularnewline
7 & 0.154057 & 1.2981 & 0.099226 \tabularnewline
8 & 0.153105 & 1.2901 & 0.100603 \tabularnewline
9 & -0.050315 & -0.424 & 0.336438 \tabularnewline
10 & -0.404029 & -3.4044 & 0.000547 \tabularnewline
11 & 0.042091 & 0.3547 & 0.361945 \tabularnewline
12 & 0.434123 & 3.658 & 0.000242 \tabularnewline
13 & -0.260021 & -2.191 & 0.015869 \tabularnewline
14 & -0.056533 & -0.4764 & 0.317641 \tabularnewline
15 & -0.057268 & -0.4825 & 0.315451 \tabularnewline
16 & 0.028574 & 0.2408 & 0.405213 \tabularnewline
17 & -0.127421 & -1.0737 & 0.143303 \tabularnewline
18 & -0.106183 & -0.8947 & 0.186982 \tabularnewline
19 & -0.017073 & -0.1439 & 0.443011 \tabularnewline
20 & -0.10503 & -0.885 & 0.189573 \tabularnewline
21 & -0.055151 & -0.4647 & 0.32178 \tabularnewline
22 & -0.058333 & -0.4915 & 0.312288 \tabularnewline
23 & -0.095147 & -0.8017 & 0.212694 \tabularnewline
24 & -0.026089 & -0.2198 & 0.413318 \tabularnewline
25 & 0.004823 & 0.0406 & 0.483847 \tabularnewline
26 & 0.043551 & 0.367 & 0.357366 \tabularnewline
27 & 0.079652 & 0.6712 & 0.252148 \tabularnewline
28 & 0.001218 & 0.0103 & 0.49592 \tabularnewline
29 & -0.101596 & -0.8561 & 0.197422 \tabularnewline
30 & -0.193374 & -1.6294 & 0.053829 \tabularnewline
31 & -0.02487 & -0.2096 & 0.417308 \tabularnewline
32 & -0.137591 & -1.1594 & 0.125097 \tabularnewline
33 & 0.046668 & 0.3932 & 0.347664 \tabularnewline
34 & -0.00983 & -0.0828 & 0.467109 \tabularnewline
35 & -0.001363 & -0.0115 & 0.495435 \tabularnewline
36 & 0.002997 & 0.0253 & 0.489962 \tabularnewline
37 & 0.005295 & 0.0446 & 0.482269 \tabularnewline
38 & -0.036697 & -0.3092 & 0.37903 \tabularnewline
39 & -0.053153 & -0.4479 & 0.327805 \tabularnewline
40 & -0.093746 & -0.7899 & 0.216103 \tabularnewline
41 & 0.007309 & 0.0616 & 0.475534 \tabularnewline
42 & -0.048895 & -0.412 & 0.34079 \tabularnewline
43 & -0.096006 & -0.809 & 0.210619 \tabularnewline
44 & -0.059823 & -0.5041 & 0.307885 \tabularnewline
45 & 0.003658 & 0.0308 & 0.487748 \tabularnewline
46 & -0.030032 & -0.2531 & 0.400479 \tabularnewline
47 & 0.106506 & 0.8974 & 0.186261 \tabularnewline
48 & -0.156431 & -1.3181 & 0.095852 \tabularnewline
\hline
\end{tabular}
%Source: https://freestatistics.org/blog/index.php?pk=243660&T=2

[TABLE]
[ROW][C]Partial Autocorrelation Function[/C][/ROW]
[ROW][C]Time lag k[/C][C]PACF(k)[/C][C]T-STAT[/C][C]P-value[/C][/ROW]
[ROW][C]1[/C][C]0.215263[/C][C]1.8138[/C][C]0.036964[/C][/ROW]
[ROW][C]2[/C][C]-0.514322[/C][C]-4.3338[/C][C]2.4e-05[/C][/ROW]
[ROW][C]3[/C][C]-0.161068[/C][C]-1.3572[/C][C]0.089512[/C][/ROW]
[ROW][C]4[/C][C]-0.435622[/C][C]-3.6706[/C][C]0.000232[/C][/ROW]
[ROW][C]5[/C][C]0.109501[/C][C]0.9227[/C][C]0.179652[/C][/ROW]
[ROW][C]6[/C][C]0.18349[/C][C]1.5461[/C][C]0.063261[/C][/ROW]
[ROW][C]7[/C][C]0.154057[/C][C]1.2981[/C][C]0.099226[/C][/ROW]
[ROW][C]8[/C][C]0.153105[/C][C]1.2901[/C][C]0.100603[/C][/ROW]
[ROW][C]9[/C][C]-0.050315[/C][C]-0.424[/C][C]0.336438[/C][/ROW]
[ROW][C]10[/C][C]-0.404029[/C][C]-3.4044[/C][C]0.000547[/C][/ROW]
[ROW][C]11[/C][C]0.042091[/C][C]0.3547[/C][C]0.361945[/C][/ROW]
[ROW][C]12[/C][C]0.434123[/C][C]3.658[/C][C]0.000242[/C][/ROW]
[ROW][C]13[/C][C]-0.260021[/C][C]-2.191[/C][C]0.015869[/C][/ROW]
[ROW][C]14[/C][C]-0.056533[/C][C]-0.4764[/C][C]0.317641[/C][/ROW]
[ROW][C]15[/C][C]-0.057268[/C][C]-0.4825[/C][C]0.315451[/C][/ROW]
[ROW][C]16[/C][C]0.028574[/C][C]0.2408[/C][C]0.405213[/C][/ROW]
[ROW][C]17[/C][C]-0.127421[/C][C]-1.0737[/C][C]0.143303[/C][/ROW]
[ROW][C]18[/C][C]-0.106183[/C][C]-0.8947[/C][C]0.186982[/C][/ROW]
[ROW][C]19[/C][C]-0.017073[/C][C]-0.1439[/C][C]0.443011[/C][/ROW]
[ROW][C]20[/C][C]-0.10503[/C][C]-0.885[/C][C]0.189573[/C][/ROW]
[ROW][C]21[/C][C]-0.055151[/C][C]-0.4647[/C][C]0.32178[/C][/ROW]
[ROW][C]22[/C][C]-0.058333[/C][C]-0.4915[/C][C]0.312288[/C][/ROW]
[ROW][C]23[/C][C]-0.095147[/C][C]-0.8017[/C][C]0.212694[/C][/ROW]
[ROW][C]24[/C][C]-0.026089[/C][C]-0.2198[/C][C]0.413318[/C][/ROW]
[ROW][C]25[/C][C]0.004823[/C][C]0.0406[/C][C]0.483847[/C][/ROW]
[ROW][C]26[/C][C]0.043551[/C][C]0.367[/C][C]0.357366[/C][/ROW]
[ROW][C]27[/C][C]0.079652[/C][C]0.6712[/C][C]0.252148[/C][/ROW]
[ROW][C]28[/C][C]0.001218[/C][C]0.0103[/C][C]0.49592[/C][/ROW]
[ROW][C]29[/C][C]-0.101596[/C][C]-0.8561[/C][C]0.197422[/C][/ROW]
[ROW][C]30[/C][C]-0.193374[/C][C]-1.6294[/C][C]0.053829[/C][/ROW]
[ROW][C]31[/C][C]-0.02487[/C][C]-0.2096[/C][C]0.417308[/C][/ROW]
[ROW][C]32[/C][C]-0.137591[/C][C]-1.1594[/C][C]0.125097[/C][/ROW]
[ROW][C]33[/C][C]0.046668[/C][C]0.3932[/C][C]0.347664[/C][/ROW]
[ROW][C]34[/C][C]-0.00983[/C][C]-0.0828[/C][C]0.467109[/C][/ROW]
[ROW][C]35[/C][C]-0.001363[/C][C]-0.0115[/C][C]0.495435[/C][/ROW]
[ROW][C]36[/C][C]0.002997[/C][C]0.0253[/C][C]0.489962[/C][/ROW]
[ROW][C]37[/C][C]0.005295[/C][C]0.0446[/C][C]0.482269[/C][/ROW]
[ROW][C]38[/C][C]-0.036697[/C][C]-0.3092[/C][C]0.37903[/C][/ROW]
[ROW][C]39[/C][C]-0.053153[/C][C]-0.4479[/C][C]0.327805[/C][/ROW]
[ROW][C]40[/C][C]-0.093746[/C][C]-0.7899[/C][C]0.216103[/C][/ROW]
[ROW][C]41[/C][C]0.007309[/C][C]0.0616[/C][C]0.475534[/C][/ROW]
[ROW][C]42[/C][C]-0.048895[/C][C]-0.412[/C][C]0.34079[/C][/ROW]
[ROW][C]43[/C][C]-0.096006[/C][C]-0.809[/C][C]0.210619[/C][/ROW]
[ROW][C]44[/C][C]-0.059823[/C][C]-0.5041[/C][C]0.307885[/C][/ROW]
[ROW][C]45[/C][C]0.003658[/C][C]0.0308[/C][C]0.487748[/C][/ROW]
[ROW][C]46[/C][C]-0.030032[/C][C]-0.2531[/C][C]0.400479[/C][/ROW]
[ROW][C]47[/C][C]0.106506[/C][C]0.8974[/C][C]0.186261[/C][/ROW]
[ROW][C]48[/C][C]-0.156431[/C][C]-1.3181[/C][C]0.095852[/C][/ROW]
[/TABLE]
Source: https://freestatistics.org/blog/index.php?pk=243660&T=2

Globally Unique Identifier (entire table): ba.freestatistics.org/blog/index.php?pk=243660&T=2

As an alternative you can also use a QR Code:  

The GUIDs for individual cells are displayed in the table below:

Partial Autocorrelation Function
Time lag kPACF(k)T-STATP-value
10.2152631.81380.036964
2-0.514322-4.33382.4e-05
3-0.161068-1.35720.089512
4-0.435622-3.67060.000232
50.1095010.92270.179652
60.183491.54610.063261
70.1540571.29810.099226
80.1531051.29010.100603
9-0.050315-0.4240.336438
10-0.404029-3.40440.000547
110.0420910.35470.361945
120.4341233.6580.000242
13-0.260021-2.1910.015869
14-0.056533-0.47640.317641
15-0.057268-0.48250.315451
160.0285740.24080.405213
17-0.127421-1.07370.143303
18-0.106183-0.89470.186982
19-0.017073-0.14390.443011
20-0.10503-0.8850.189573
21-0.055151-0.46470.32178
22-0.058333-0.49150.312288
23-0.095147-0.80170.212694
24-0.026089-0.21980.413318
250.0048230.04060.483847
260.0435510.3670.357366
270.0796520.67120.252148
280.0012180.01030.49592
29-0.101596-0.85610.197422
30-0.193374-1.62940.053829
31-0.02487-0.20960.417308
32-0.137591-1.15940.125097
330.0466680.39320.347664
34-0.00983-0.08280.467109
35-0.001363-0.01150.495435
360.0029970.02530.489962
370.0052950.04460.482269
38-0.036697-0.30920.37903
39-0.053153-0.44790.327805
40-0.093746-0.78990.216103
410.0073090.06160.475534
42-0.048895-0.4120.34079
43-0.096006-0.8090.210619
44-0.059823-0.50410.307885
450.0036580.03080.487748
46-0.030032-0.25310.400479
470.1065060.89740.186261
48-0.156431-1.31810.095852


Parameters (Session):
par1 = 48 ; par2 = 1 ; par3 = 1 ; par4 = 0 ; par5 = 12 ; par6 = White Noise ; par7 = 0.95 ;
Parameters (R input):
par1 = 48 ; par2 = 1 ; par3 = 1 ; par4 = 0 ; par5 = 12 ; par6 = White Noise ; par7 = 0.95 ; par8 = ;
R code (references can be found in the software module):
if (par1 == 'Default') {
par1 = 10*log10(length(x))
} else {
par1 <- as.numeric(par1)
}
par2 <- as.numeric(par2)
par3 <- as.numeric(par3)
par4 <- as.numeric(par4)
par5 <- as.numeric(par5)
if (par6 == 'White Noise') par6 <- 'white' else par6 <- 'ma'
par7 <- as.numeric(par7)
if (par8 != '') par8 <- as.numeric(par8)
ox <- x
if (par8 == '') {
if (par2 == 0) {
x <- log(x)
} else {
x <- (x ^ par2 - 1) / par2
}
} else {
x <- log(x,base=par8)
}
if (par3 > 0) x <- diff(x,lag=1,difference=par3)
if (par4 > 0) x <- diff(x,lag=par5,difference=par4)
bitmap(file='picts.png')
op <- par(mfrow=c(2,1))
plot(ox,type='l',main='Original Time Series',xlab='time',ylab='value')
if (par8=='') {
mytitle <- paste('Working Time Series (lambda=',par2,', d=',par3,', D=',par4,')',sep='')
mysub <- paste('(lambda=',par2,', d=',par3,', D=',par4,', CI=', par7, ', CI type=',par6,')',sep='')
} else {
mytitle <- paste('Working Time Series (base=',par8,', d=',par3,', D=',par4,')',sep='')
mysub <- paste('(base=',par8,', d=',par3,', D=',par4,', CI=', par7, ', CI type=',par6,')',sep='')
}
plot(x,type='l', main=mytitle,xlab='time',ylab='value')
par(op)
dev.off()
bitmap(file='pic1.png')
racf <- acf(x, par1, main='Autocorrelation', xlab='time lag', ylab='ACF', ci.type=par6, ci=par7, sub=mysub)
dev.off()
bitmap(file='pic2.png')
rpacf <- pacf(x,par1,main='Partial Autocorrelation',xlab='lags',ylab='PACF',sub=mysub)
dev.off()
(myacf <- c(racf$acf))
(mypacf <- c(rpacf$acf))
lengthx <- length(x)
sqrtn <- sqrt(lengthx)
load(file='createtable')
a<-table.start()
a<-table.row.start(a)
a<-table.element(a,'Autocorrelation Function',4,TRUE)
a<-table.row.end(a)
a<-table.row.start(a)
a<-table.element(a,'Time lag k',header=TRUE)
a<-table.element(a,hyperlink('basics.htm','ACF(k)','click here for more information about the Autocorrelation Function'),header=TRUE)
a<-table.element(a,'T-STAT',header=TRUE)
a<-table.element(a,'P-value',header=TRUE)
a<-table.row.end(a)
for (i in 2:(par1+1)) {
a<-table.row.start(a)
a<-table.element(a,i-1,header=TRUE)
a<-table.element(a,round(myacf[i],6))
mytstat <- myacf[i]*sqrtn
a<-table.element(a,round(mytstat,4))
a<-table.element(a,round(1-pt(abs(mytstat),lengthx),6))
a<-table.row.end(a)
}
a<-table.end(a)
table.save(a,file='mytable.tab')
a<-table.start()
a<-table.row.start(a)
a<-table.element(a,'Partial Autocorrelation Function',4,TRUE)
a<-table.row.end(a)
a<-table.row.start(a)
a<-table.element(a,'Time lag k',header=TRUE)
a<-table.element(a,hyperlink('basics.htm','PACF(k)','click here for more information about the Partial Autocorrelation Function'),header=TRUE)
a<-table.element(a,'T-STAT',header=TRUE)
a<-table.element(a,'P-value',header=TRUE)
a<-table.row.end(a)
for (i in 1:par1) {
a<-table.row.start(a)
a<-table.element(a,i,header=TRUE)
a<-table.element(a,round(mypacf[i],6))
mytstat <- mypacf[i]*sqrtn
a<-table.element(a,round(mytstat,4))
a<-table.element(a,round(1-pt(abs(mytstat),lengthx),6))
a<-table.row.end(a)
}
a<-table.end(a)
table.save(a,file='mytable1.tab')