Free Statistics

of Irreproducible Research!

Author's title

Author*Unverified author*
R Software Modulerwasp_autocorrelation.wasp
Title produced by software(Partial) Autocorrelation Function
Date of computationSun, 19 Oct 2014 15:29:09 +0100
Cite this page as followsStatistical Computations at FreeStatistics.org, Office for Research Development and Education, URL https://freestatistics.org/blog/index.php?v=date/2014/Oct/19/t1413729034q3cz19wgmnlokol.htm/, Retrieved Sun, 12 May 2024 00:20:11 +0000
Statistical Computations at FreeStatistics.org, Office for Research Development and Education, URL https://freestatistics.org/blog/index.php?pk=243658, Retrieved Sun, 12 May 2024 00:20:11 +0000
QR Codes:

Original text written by user:
IsPrivate?No (this computation is public)
User-defined keywords
Estimated Impact63
Family? (F = Feedback message, R = changed R code, M = changed R Module, P = changed Parameters, D = changed Data)
-       [(Partial) Autocorrelation Function] [Werkloosheid vana...] [2014-10-19 14:29:09] [f3f8000f3957416038d6f50ac60d9d25] [Current]
Feedback Forum

Post a new message
Dataseries X:
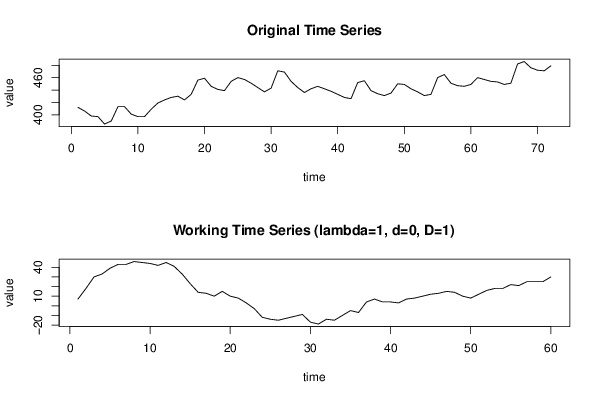
412
406
398
397
385
390
413
413
401
397
397
409
419
424
428
430
424
433
456
459
446
441
439
454
460
457
451
444
437
443
471
469
454
444
436
442
446
442
438
433
428
426
452
455
439
434
431
435
450
449
442
437
431
433
460
465
451
447
446
449
460
457
454
453
449
451
482
486
476
472
471
479


Summary of computational transaction
Raw Inputview raw input (R code)
Raw Outputview raw output of R engine
Computing time1 seconds
R Server'George Udny Yule' @ yule.wessa.net

\begin{tabular}{lllllllll}
\hline
Summary of computational transaction \tabularnewline
Raw Input & view raw input (R code)  \tabularnewline
Raw Output & view raw output of R engine  \tabularnewline
Computing time & 1 seconds \tabularnewline
R Server & 'George Udny Yule' @ yule.wessa.net \tabularnewline
\hline
\end{tabular}
%Source: https://freestatistics.org/blog/index.php?pk=243658&T=0

[TABLE]
[ROW][C]Summary of computational transaction[/C][/ROW]
[ROW][C]Raw Input[/C][C]view raw input (R code) [/C][/ROW]
[ROW][C]Raw Output[/C][C]view raw output of R engine [/C][/ROW]
[ROW][C]Computing time[/C][C]1 seconds[/C][/ROW]
[ROW][C]R Server[/C][C]'George Udny Yule' @ yule.wessa.net[/C][/ROW]
[/TABLE]
Source: https://freestatistics.org/blog/index.php?pk=243658&T=0

Globally Unique Identifier (entire table): ba.freestatistics.org/blog/index.php?pk=243658&T=0

As an alternative you can also use a QR Code:  

The GUIDs for individual cells are displayed in the table below:

Summary of computational transaction
Raw Inputview raw input (R code)
Raw Outputview raw output of R engine
Computing time1 seconds
R Server'George Udny Yule' @ yule.wessa.net


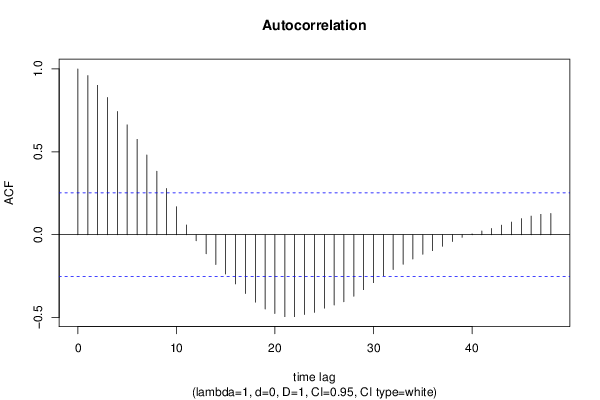
Autocorrelation Function
Time lag kACF(k)T-STATP-value
10.9597867.43450
20.9008746.97810
30.8280646.41420
40.7434855.7590
50.6626745.13312e-06
60.5752244.45571.9e-05
70.4813463.72850.000214
80.3830612.96720.002156
90.2791482.16230.017297
100.1689161.30840.097861
110.0587740.45530.325283
12-0.036879-0.28570.38806
13-0.114631-0.88790.189064
14-0.180182-1.39570.083976
15-0.237383-1.83880.03545
16-0.296786-2.29890.012504
17-0.354959-2.74950.003938
18-0.406996-3.15260.001263
19-0.448421-3.47350.00048
20-0.475867-3.68610.000246
21-0.494532-3.83060.000154
22-0.494406-3.82960.000155
23-0.482055-3.7340.000211
24-0.468868-3.63180.000292
25-0.443289-3.43370.000543
26-0.424323-3.28680.000848
27-0.40453-3.13350.001336
28-0.371757-2.87960.002756
29-0.331693-2.56930.006347
30-0.289423-2.24190.01434
31-0.24791-1.92030.029788
32-0.210215-1.62830.054348
33-0.178855-1.38540.085529
34-0.146808-1.13720.129994
35-0.118059-0.91450.182062
36-0.096262-0.74560.229396
37-0.069359-0.53730.29654
38-0.041074-0.31820.375734
39-0.016037-0.12420.450778
400.0047820.0370.485289
410.0227190.1760.430451
420.0372170.28830.387062
430.0575420.44570.328704
440.0757140.58650.279877
450.0967410.74940.228286
460.1119020.86680.194756
470.1228470.95160.172567
480.1283490.99420.162062

\begin{tabular}{lllllllll}
\hline
Autocorrelation Function \tabularnewline
Time lag k & ACF(k) & T-STAT & P-value \tabularnewline
1 & 0.959786 & 7.4345 & 0 \tabularnewline
2 & 0.900874 & 6.9781 & 0 \tabularnewline
3 & 0.828064 & 6.4142 & 0 \tabularnewline
4 & 0.743485 & 5.759 & 0 \tabularnewline
5 & 0.662674 & 5.1331 & 2e-06 \tabularnewline
6 & 0.575224 & 4.4557 & 1.9e-05 \tabularnewline
7 & 0.481346 & 3.7285 & 0.000214 \tabularnewline
8 & 0.383061 & 2.9672 & 0.002156 \tabularnewline
9 & 0.279148 & 2.1623 & 0.017297 \tabularnewline
10 & 0.168916 & 1.3084 & 0.097861 \tabularnewline
11 & 0.058774 & 0.4553 & 0.325283 \tabularnewline
12 & -0.036879 & -0.2857 & 0.38806 \tabularnewline
13 & -0.114631 & -0.8879 & 0.189064 \tabularnewline
14 & -0.180182 & -1.3957 & 0.083976 \tabularnewline
15 & -0.237383 & -1.8388 & 0.03545 \tabularnewline
16 & -0.296786 & -2.2989 & 0.012504 \tabularnewline
17 & -0.354959 & -2.7495 & 0.003938 \tabularnewline
18 & -0.406996 & -3.1526 & 0.001263 \tabularnewline
19 & -0.448421 & -3.4735 & 0.00048 \tabularnewline
20 & -0.475867 & -3.6861 & 0.000246 \tabularnewline
21 & -0.494532 & -3.8306 & 0.000154 \tabularnewline
22 & -0.494406 & -3.8296 & 0.000155 \tabularnewline
23 & -0.482055 & -3.734 & 0.000211 \tabularnewline
24 & -0.468868 & -3.6318 & 0.000292 \tabularnewline
25 & -0.443289 & -3.4337 & 0.000543 \tabularnewline
26 & -0.424323 & -3.2868 & 0.000848 \tabularnewline
27 & -0.40453 & -3.1335 & 0.001336 \tabularnewline
28 & -0.371757 & -2.8796 & 0.002756 \tabularnewline
29 & -0.331693 & -2.5693 & 0.006347 \tabularnewline
30 & -0.289423 & -2.2419 & 0.01434 \tabularnewline
31 & -0.24791 & -1.9203 & 0.029788 \tabularnewline
32 & -0.210215 & -1.6283 & 0.054348 \tabularnewline
33 & -0.178855 & -1.3854 & 0.085529 \tabularnewline
34 & -0.146808 & -1.1372 & 0.129994 \tabularnewline
35 & -0.118059 & -0.9145 & 0.182062 \tabularnewline
36 & -0.096262 & -0.7456 & 0.229396 \tabularnewline
37 & -0.069359 & -0.5373 & 0.29654 \tabularnewline
38 & -0.041074 & -0.3182 & 0.375734 \tabularnewline
39 & -0.016037 & -0.1242 & 0.450778 \tabularnewline
40 & 0.004782 & 0.037 & 0.485289 \tabularnewline
41 & 0.022719 & 0.176 & 0.430451 \tabularnewline
42 & 0.037217 & 0.2883 & 0.387062 \tabularnewline
43 & 0.057542 & 0.4457 & 0.328704 \tabularnewline
44 & 0.075714 & 0.5865 & 0.279877 \tabularnewline
45 & 0.096741 & 0.7494 & 0.228286 \tabularnewline
46 & 0.111902 & 0.8668 & 0.194756 \tabularnewline
47 & 0.122847 & 0.9516 & 0.172567 \tabularnewline
48 & 0.128349 & 0.9942 & 0.162062 \tabularnewline
\hline
\end{tabular}
%Source: https://freestatistics.org/blog/index.php?pk=243658&T=1

[TABLE]
[ROW][C]Autocorrelation Function[/C][/ROW]
[ROW][C]Time lag k[/C][C]ACF(k)[/C][C]T-STAT[/C][C]P-value[/C][/ROW]
[ROW][C]1[/C][C]0.959786[/C][C]7.4345[/C][C]0[/C][/ROW]
[ROW][C]2[/C][C]0.900874[/C][C]6.9781[/C][C]0[/C][/ROW]
[ROW][C]3[/C][C]0.828064[/C][C]6.4142[/C][C]0[/C][/ROW]
[ROW][C]4[/C][C]0.743485[/C][C]5.759[/C][C]0[/C][/ROW]
[ROW][C]5[/C][C]0.662674[/C][C]5.1331[/C][C]2e-06[/C][/ROW]
[ROW][C]6[/C][C]0.575224[/C][C]4.4557[/C][C]1.9e-05[/C][/ROW]
[ROW][C]7[/C][C]0.481346[/C][C]3.7285[/C][C]0.000214[/C][/ROW]
[ROW][C]8[/C][C]0.383061[/C][C]2.9672[/C][C]0.002156[/C][/ROW]
[ROW][C]9[/C][C]0.279148[/C][C]2.1623[/C][C]0.017297[/C][/ROW]
[ROW][C]10[/C][C]0.168916[/C][C]1.3084[/C][C]0.097861[/C][/ROW]
[ROW][C]11[/C][C]0.058774[/C][C]0.4553[/C][C]0.325283[/C][/ROW]
[ROW][C]12[/C][C]-0.036879[/C][C]-0.2857[/C][C]0.38806[/C][/ROW]
[ROW][C]13[/C][C]-0.114631[/C][C]-0.8879[/C][C]0.189064[/C][/ROW]
[ROW][C]14[/C][C]-0.180182[/C][C]-1.3957[/C][C]0.083976[/C][/ROW]
[ROW][C]15[/C][C]-0.237383[/C][C]-1.8388[/C][C]0.03545[/C][/ROW]
[ROW][C]16[/C][C]-0.296786[/C][C]-2.2989[/C][C]0.012504[/C][/ROW]
[ROW][C]17[/C][C]-0.354959[/C][C]-2.7495[/C][C]0.003938[/C][/ROW]
[ROW][C]18[/C][C]-0.406996[/C][C]-3.1526[/C][C]0.001263[/C][/ROW]
[ROW][C]19[/C][C]-0.448421[/C][C]-3.4735[/C][C]0.00048[/C][/ROW]
[ROW][C]20[/C][C]-0.475867[/C][C]-3.6861[/C][C]0.000246[/C][/ROW]
[ROW][C]21[/C][C]-0.494532[/C][C]-3.8306[/C][C]0.000154[/C][/ROW]
[ROW][C]22[/C][C]-0.494406[/C][C]-3.8296[/C][C]0.000155[/C][/ROW]
[ROW][C]23[/C][C]-0.482055[/C][C]-3.734[/C][C]0.000211[/C][/ROW]
[ROW][C]24[/C][C]-0.468868[/C][C]-3.6318[/C][C]0.000292[/C][/ROW]
[ROW][C]25[/C][C]-0.443289[/C][C]-3.4337[/C][C]0.000543[/C][/ROW]
[ROW][C]26[/C][C]-0.424323[/C][C]-3.2868[/C][C]0.000848[/C][/ROW]
[ROW][C]27[/C][C]-0.40453[/C][C]-3.1335[/C][C]0.001336[/C][/ROW]
[ROW][C]28[/C][C]-0.371757[/C][C]-2.8796[/C][C]0.002756[/C][/ROW]
[ROW][C]29[/C][C]-0.331693[/C][C]-2.5693[/C][C]0.006347[/C][/ROW]
[ROW][C]30[/C][C]-0.289423[/C][C]-2.2419[/C][C]0.01434[/C][/ROW]
[ROW][C]31[/C][C]-0.24791[/C][C]-1.9203[/C][C]0.029788[/C][/ROW]
[ROW][C]32[/C][C]-0.210215[/C][C]-1.6283[/C][C]0.054348[/C][/ROW]
[ROW][C]33[/C][C]-0.178855[/C][C]-1.3854[/C][C]0.085529[/C][/ROW]
[ROW][C]34[/C][C]-0.146808[/C][C]-1.1372[/C][C]0.129994[/C][/ROW]
[ROW][C]35[/C][C]-0.118059[/C][C]-0.9145[/C][C]0.182062[/C][/ROW]
[ROW][C]36[/C][C]-0.096262[/C][C]-0.7456[/C][C]0.229396[/C][/ROW]
[ROW][C]37[/C][C]-0.069359[/C][C]-0.5373[/C][C]0.29654[/C][/ROW]
[ROW][C]38[/C][C]-0.041074[/C][C]-0.3182[/C][C]0.375734[/C][/ROW]
[ROW][C]39[/C][C]-0.016037[/C][C]-0.1242[/C][C]0.450778[/C][/ROW]
[ROW][C]40[/C][C]0.004782[/C][C]0.037[/C][C]0.485289[/C][/ROW]
[ROW][C]41[/C][C]0.022719[/C][C]0.176[/C][C]0.430451[/C][/ROW]
[ROW][C]42[/C][C]0.037217[/C][C]0.2883[/C][C]0.387062[/C][/ROW]
[ROW][C]43[/C][C]0.057542[/C][C]0.4457[/C][C]0.328704[/C][/ROW]
[ROW][C]44[/C][C]0.075714[/C][C]0.5865[/C][C]0.279877[/C][/ROW]
[ROW][C]45[/C][C]0.096741[/C][C]0.7494[/C][C]0.228286[/C][/ROW]
[ROW][C]46[/C][C]0.111902[/C][C]0.8668[/C][C]0.194756[/C][/ROW]
[ROW][C]47[/C][C]0.122847[/C][C]0.9516[/C][C]0.172567[/C][/ROW]
[ROW][C]48[/C][C]0.128349[/C][C]0.9942[/C][C]0.162062[/C][/ROW]
[/TABLE]
Source: https://freestatistics.org/blog/index.php?pk=243658&T=1

Globally Unique Identifier (entire table): ba.freestatistics.org/blog/index.php?pk=243658&T=1

As an alternative you can also use a QR Code:  

The GUIDs for individual cells are displayed in the table below:

Autocorrelation Function
Time lag kACF(k)T-STATP-value
10.9597867.43450
20.9008746.97810
30.8280646.41420
40.7434855.7590
50.6626745.13312e-06
60.5752244.45571.9e-05
70.4813463.72850.000214
80.3830612.96720.002156
90.2791482.16230.017297
100.1689161.30840.097861
110.0587740.45530.325283
12-0.036879-0.28570.38806
13-0.114631-0.88790.189064
14-0.180182-1.39570.083976
15-0.237383-1.83880.03545
16-0.296786-2.29890.012504
17-0.354959-2.74950.003938
18-0.406996-3.15260.001263
19-0.448421-3.47350.00048
20-0.475867-3.68610.000246
21-0.494532-3.83060.000154
22-0.494406-3.82960.000155
23-0.482055-3.7340.000211
24-0.468868-3.63180.000292
25-0.443289-3.43370.000543
26-0.424323-3.28680.000848
27-0.40453-3.13350.001336
28-0.371757-2.87960.002756
29-0.331693-2.56930.006347
30-0.289423-2.24190.01434
31-0.24791-1.92030.029788
32-0.210215-1.62830.054348
33-0.178855-1.38540.085529
34-0.146808-1.13720.129994
35-0.118059-0.91450.182062
36-0.096262-0.74560.229396
37-0.069359-0.53730.29654
38-0.041074-0.31820.375734
39-0.016037-0.12420.450778
400.0047820.0370.485289
410.0227190.1760.430451
420.0372170.28830.387062
430.0575420.44570.328704
440.0757140.58650.279877
450.0967410.74940.228286
460.1119020.86680.194756
470.1228470.95160.172567
480.1283490.99420.162062


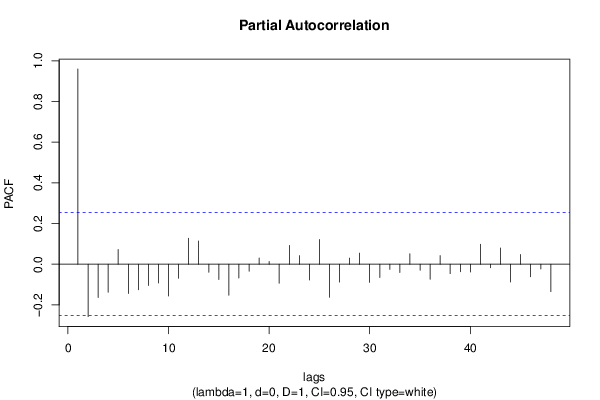
Partial Autocorrelation Function
Time lag kPACF(k)T-STATP-value
10.9597867.43450
2-0.257771-1.99670.025201
3-0.163881-1.26940.104597
4-0.138006-1.0690.144678
50.072720.56330.287668
6-0.143731-1.11330.135003
7-0.125955-0.97560.166579
8-0.104939-0.81290.209757
9-0.092163-0.71390.23903
10-0.15597-1.20810.115868
11-0.069233-0.53630.296874
120.1279490.99110.162811
130.1141770.88440.190003
14-0.039208-0.30370.381203
15-0.075486-0.58470.280466
16-0.152657-1.18250.120841
17-0.067882-0.52580.300479
18-0.034298-0.26570.395702
190.0302980.23470.407625
200.0131010.10150.459752
21-0.093703-0.72580.235385
220.0924720.71630.238298
230.0423930.32840.371886
24-0.078004-0.60420.273988
250.1214190.94050.175364
26-0.162729-1.26050.106186
27-0.087913-0.6810.249255
280.0299120.23170.408782
290.0544050.42140.337476
30-0.089483-0.69310.24545
31-0.065368-0.50630.307237
32-0.025589-0.19820.421774
33-0.041035-0.31790.37585
340.0512550.3970.34638
35-0.0301-0.23310.408219
36-0.073895-0.57240.284598
370.0422470.32720.372311
38-0.046348-0.3590.360423
39-0.036768-0.28480.388388
40-0.038612-0.29910.382952
410.0981670.76040.224998
42-0.017319-0.13420.446864
430.0800360.620.268817
44-0.08714-0.6750.25114
450.0479890.37170.355704
46-0.061826-0.47890.316875
47-0.023606-0.18290.427765
48-0.134827-1.04440.150253

\begin{tabular}{lllllllll}
\hline
Partial Autocorrelation Function \tabularnewline
Time lag k & PACF(k) & T-STAT & P-value \tabularnewline
1 & 0.959786 & 7.4345 & 0 \tabularnewline
2 & -0.257771 & -1.9967 & 0.025201 \tabularnewline
3 & -0.163881 & -1.2694 & 0.104597 \tabularnewline
4 & -0.138006 & -1.069 & 0.144678 \tabularnewline
5 & 0.07272 & 0.5633 & 0.287668 \tabularnewline
6 & -0.143731 & -1.1133 & 0.135003 \tabularnewline
7 & -0.125955 & -0.9756 & 0.166579 \tabularnewline
8 & -0.104939 & -0.8129 & 0.209757 \tabularnewline
9 & -0.092163 & -0.7139 & 0.23903 \tabularnewline
10 & -0.15597 & -1.2081 & 0.115868 \tabularnewline
11 & -0.069233 & -0.5363 & 0.296874 \tabularnewline
12 & 0.127949 & 0.9911 & 0.162811 \tabularnewline
13 & 0.114177 & 0.8844 & 0.190003 \tabularnewline
14 & -0.039208 & -0.3037 & 0.381203 \tabularnewline
15 & -0.075486 & -0.5847 & 0.280466 \tabularnewline
16 & -0.152657 & -1.1825 & 0.120841 \tabularnewline
17 & -0.067882 & -0.5258 & 0.300479 \tabularnewline
18 & -0.034298 & -0.2657 & 0.395702 \tabularnewline
19 & 0.030298 & 0.2347 & 0.407625 \tabularnewline
20 & 0.013101 & 0.1015 & 0.459752 \tabularnewline
21 & -0.093703 & -0.7258 & 0.235385 \tabularnewline
22 & 0.092472 & 0.7163 & 0.238298 \tabularnewline
23 & 0.042393 & 0.3284 & 0.371886 \tabularnewline
24 & -0.078004 & -0.6042 & 0.273988 \tabularnewline
25 & 0.121419 & 0.9405 & 0.175364 \tabularnewline
26 & -0.162729 & -1.2605 & 0.106186 \tabularnewline
27 & -0.087913 & -0.681 & 0.249255 \tabularnewline
28 & 0.029912 & 0.2317 & 0.408782 \tabularnewline
29 & 0.054405 & 0.4214 & 0.337476 \tabularnewline
30 & -0.089483 & -0.6931 & 0.24545 \tabularnewline
31 & -0.065368 & -0.5063 & 0.307237 \tabularnewline
32 & -0.025589 & -0.1982 & 0.421774 \tabularnewline
33 & -0.041035 & -0.3179 & 0.37585 \tabularnewline
34 & 0.051255 & 0.397 & 0.34638 \tabularnewline
35 & -0.0301 & -0.2331 & 0.408219 \tabularnewline
36 & -0.073895 & -0.5724 & 0.284598 \tabularnewline
37 & 0.042247 & 0.3272 & 0.372311 \tabularnewline
38 & -0.046348 & -0.359 & 0.360423 \tabularnewline
39 & -0.036768 & -0.2848 & 0.388388 \tabularnewline
40 & -0.038612 & -0.2991 & 0.382952 \tabularnewline
41 & 0.098167 & 0.7604 & 0.224998 \tabularnewline
42 & -0.017319 & -0.1342 & 0.446864 \tabularnewline
43 & 0.080036 & 0.62 & 0.268817 \tabularnewline
44 & -0.08714 & -0.675 & 0.25114 \tabularnewline
45 & 0.047989 & 0.3717 & 0.355704 \tabularnewline
46 & -0.061826 & -0.4789 & 0.316875 \tabularnewline
47 & -0.023606 & -0.1829 & 0.427765 \tabularnewline
48 & -0.134827 & -1.0444 & 0.150253 \tabularnewline
\hline
\end{tabular}
%Source: https://freestatistics.org/blog/index.php?pk=243658&T=2

[TABLE]
[ROW][C]Partial Autocorrelation Function[/C][/ROW]
[ROW][C]Time lag k[/C][C]PACF(k)[/C][C]T-STAT[/C][C]P-value[/C][/ROW]
[ROW][C]1[/C][C]0.959786[/C][C]7.4345[/C][C]0[/C][/ROW]
[ROW][C]2[/C][C]-0.257771[/C][C]-1.9967[/C][C]0.025201[/C][/ROW]
[ROW][C]3[/C][C]-0.163881[/C][C]-1.2694[/C][C]0.104597[/C][/ROW]
[ROW][C]4[/C][C]-0.138006[/C][C]-1.069[/C][C]0.144678[/C][/ROW]
[ROW][C]5[/C][C]0.07272[/C][C]0.5633[/C][C]0.287668[/C][/ROW]
[ROW][C]6[/C][C]-0.143731[/C][C]-1.1133[/C][C]0.135003[/C][/ROW]
[ROW][C]7[/C][C]-0.125955[/C][C]-0.9756[/C][C]0.166579[/C][/ROW]
[ROW][C]8[/C][C]-0.104939[/C][C]-0.8129[/C][C]0.209757[/C][/ROW]
[ROW][C]9[/C][C]-0.092163[/C][C]-0.7139[/C][C]0.23903[/C][/ROW]
[ROW][C]10[/C][C]-0.15597[/C][C]-1.2081[/C][C]0.115868[/C][/ROW]
[ROW][C]11[/C][C]-0.069233[/C][C]-0.5363[/C][C]0.296874[/C][/ROW]
[ROW][C]12[/C][C]0.127949[/C][C]0.9911[/C][C]0.162811[/C][/ROW]
[ROW][C]13[/C][C]0.114177[/C][C]0.8844[/C][C]0.190003[/C][/ROW]
[ROW][C]14[/C][C]-0.039208[/C][C]-0.3037[/C][C]0.381203[/C][/ROW]
[ROW][C]15[/C][C]-0.075486[/C][C]-0.5847[/C][C]0.280466[/C][/ROW]
[ROW][C]16[/C][C]-0.152657[/C][C]-1.1825[/C][C]0.120841[/C][/ROW]
[ROW][C]17[/C][C]-0.067882[/C][C]-0.5258[/C][C]0.300479[/C][/ROW]
[ROW][C]18[/C][C]-0.034298[/C][C]-0.2657[/C][C]0.395702[/C][/ROW]
[ROW][C]19[/C][C]0.030298[/C][C]0.2347[/C][C]0.407625[/C][/ROW]
[ROW][C]20[/C][C]0.013101[/C][C]0.1015[/C][C]0.459752[/C][/ROW]
[ROW][C]21[/C][C]-0.093703[/C][C]-0.7258[/C][C]0.235385[/C][/ROW]
[ROW][C]22[/C][C]0.092472[/C][C]0.7163[/C][C]0.238298[/C][/ROW]
[ROW][C]23[/C][C]0.042393[/C][C]0.3284[/C][C]0.371886[/C][/ROW]
[ROW][C]24[/C][C]-0.078004[/C][C]-0.6042[/C][C]0.273988[/C][/ROW]
[ROW][C]25[/C][C]0.121419[/C][C]0.9405[/C][C]0.175364[/C][/ROW]
[ROW][C]26[/C][C]-0.162729[/C][C]-1.2605[/C][C]0.106186[/C][/ROW]
[ROW][C]27[/C][C]-0.087913[/C][C]-0.681[/C][C]0.249255[/C][/ROW]
[ROW][C]28[/C][C]0.029912[/C][C]0.2317[/C][C]0.408782[/C][/ROW]
[ROW][C]29[/C][C]0.054405[/C][C]0.4214[/C][C]0.337476[/C][/ROW]
[ROW][C]30[/C][C]-0.089483[/C][C]-0.6931[/C][C]0.24545[/C][/ROW]
[ROW][C]31[/C][C]-0.065368[/C][C]-0.5063[/C][C]0.307237[/C][/ROW]
[ROW][C]32[/C][C]-0.025589[/C][C]-0.1982[/C][C]0.421774[/C][/ROW]
[ROW][C]33[/C][C]-0.041035[/C][C]-0.3179[/C][C]0.37585[/C][/ROW]
[ROW][C]34[/C][C]0.051255[/C][C]0.397[/C][C]0.34638[/C][/ROW]
[ROW][C]35[/C][C]-0.0301[/C][C]-0.2331[/C][C]0.408219[/C][/ROW]
[ROW][C]36[/C][C]-0.073895[/C][C]-0.5724[/C][C]0.284598[/C][/ROW]
[ROW][C]37[/C][C]0.042247[/C][C]0.3272[/C][C]0.372311[/C][/ROW]
[ROW][C]38[/C][C]-0.046348[/C][C]-0.359[/C][C]0.360423[/C][/ROW]
[ROW][C]39[/C][C]-0.036768[/C][C]-0.2848[/C][C]0.388388[/C][/ROW]
[ROW][C]40[/C][C]-0.038612[/C][C]-0.2991[/C][C]0.382952[/C][/ROW]
[ROW][C]41[/C][C]0.098167[/C][C]0.7604[/C][C]0.224998[/C][/ROW]
[ROW][C]42[/C][C]-0.017319[/C][C]-0.1342[/C][C]0.446864[/C][/ROW]
[ROW][C]43[/C][C]0.080036[/C][C]0.62[/C][C]0.268817[/C][/ROW]
[ROW][C]44[/C][C]-0.08714[/C][C]-0.675[/C][C]0.25114[/C][/ROW]
[ROW][C]45[/C][C]0.047989[/C][C]0.3717[/C][C]0.355704[/C][/ROW]
[ROW][C]46[/C][C]-0.061826[/C][C]-0.4789[/C][C]0.316875[/C][/ROW]
[ROW][C]47[/C][C]-0.023606[/C][C]-0.1829[/C][C]0.427765[/C][/ROW]
[ROW][C]48[/C][C]-0.134827[/C][C]-1.0444[/C][C]0.150253[/C][/ROW]
[/TABLE]
Source: https://freestatistics.org/blog/index.php?pk=243658&T=2

Globally Unique Identifier (entire table): ba.freestatistics.org/blog/index.php?pk=243658&T=2

As an alternative you can also use a QR Code:  

The GUIDs for individual cells are displayed in the table below:

Partial Autocorrelation Function
Time lag kPACF(k)T-STATP-value
10.9597867.43450
2-0.257771-1.99670.025201
3-0.163881-1.26940.104597
4-0.138006-1.0690.144678
50.072720.56330.287668
6-0.143731-1.11330.135003
7-0.125955-0.97560.166579
8-0.104939-0.81290.209757
9-0.092163-0.71390.23903
10-0.15597-1.20810.115868
11-0.069233-0.53630.296874
120.1279490.99110.162811
130.1141770.88440.190003
14-0.039208-0.30370.381203
15-0.075486-0.58470.280466
16-0.152657-1.18250.120841
17-0.067882-0.52580.300479
18-0.034298-0.26570.395702
190.0302980.23470.407625
200.0131010.10150.459752
21-0.093703-0.72580.235385
220.0924720.71630.238298
230.0423930.32840.371886
24-0.078004-0.60420.273988
250.1214190.94050.175364
26-0.162729-1.26050.106186
27-0.087913-0.6810.249255
280.0299120.23170.408782
290.0544050.42140.337476
30-0.089483-0.69310.24545
31-0.065368-0.50630.307237
32-0.025589-0.19820.421774
33-0.041035-0.31790.37585
340.0512550.3970.34638
35-0.0301-0.23310.408219
36-0.073895-0.57240.284598
370.0422470.32720.372311
38-0.046348-0.3590.360423
39-0.036768-0.28480.388388
40-0.038612-0.29910.382952
410.0981670.76040.224998
42-0.017319-0.13420.446864
430.0800360.620.268817
44-0.08714-0.6750.25114
450.0479890.37170.355704
46-0.061826-0.47890.316875
47-0.023606-0.18290.427765
48-0.134827-1.04440.150253


Parameters (Session):
par1 = 48 ; par2 = 1 ; par3 = 0 ; par4 = 1 ; par5 = 12 ; par6 = White Noise ; par7 = 0.95 ;
Parameters (R input):
par1 = 48 ; par2 = 1 ; par3 = 0 ; par4 = 1 ; par5 = 12 ; par6 = White Noise ; par7 = 0.95 ; par8 = ;
R code (references can be found in the software module):
if (par1 == 'Default') {
par1 = 10*log10(length(x))
} else {
par1 <- as.numeric(par1)
}
par2 <- as.numeric(par2)
par3 <- as.numeric(par3)
par4 <- as.numeric(par4)
par5 <- as.numeric(par5)
if (par6 == 'White Noise') par6 <- 'white' else par6 <- 'ma'
par7 <- as.numeric(par7)
if (par8 != '') par8 <- as.numeric(par8)
ox <- x
if (par8 == '') {
if (par2 == 0) {
x <- log(x)
} else {
x <- (x ^ par2 - 1) / par2
}
} else {
x <- log(x,base=par8)
}
if (par3 > 0) x <- diff(x,lag=1,difference=par3)
if (par4 > 0) x <- diff(x,lag=par5,difference=par4)
bitmap(file='picts.png')
op <- par(mfrow=c(2,1))
plot(ox,type='l',main='Original Time Series',xlab='time',ylab='value')
if (par8=='') {
mytitle <- paste('Working Time Series (lambda=',par2,', d=',par3,', D=',par4,')',sep='')
mysub <- paste('(lambda=',par2,', d=',par3,', D=',par4,', CI=', par7, ', CI type=',par6,')',sep='')
} else {
mytitle <- paste('Working Time Series (base=',par8,', d=',par3,', D=',par4,')',sep='')
mysub <- paste('(base=',par8,', d=',par3,', D=',par4,', CI=', par7, ', CI type=',par6,')',sep='')
}
plot(x,type='l', main=mytitle,xlab='time',ylab='value')
par(op)
dev.off()
bitmap(file='pic1.png')
racf <- acf(x, par1, main='Autocorrelation', xlab='time lag', ylab='ACF', ci.type=par6, ci=par7, sub=mysub)
dev.off()
bitmap(file='pic2.png')
rpacf <- pacf(x,par1,main='Partial Autocorrelation',xlab='lags',ylab='PACF',sub=mysub)
dev.off()
(myacf <- c(racf$acf))
(mypacf <- c(rpacf$acf))
lengthx <- length(x)
sqrtn <- sqrt(lengthx)
load(file='createtable')
a<-table.start()
a<-table.row.start(a)
a<-table.element(a,'Autocorrelation Function',4,TRUE)
a<-table.row.end(a)
a<-table.row.start(a)
a<-table.element(a,'Time lag k',header=TRUE)
a<-table.element(a,hyperlink('basics.htm','ACF(k)','click here for more information about the Autocorrelation Function'),header=TRUE)
a<-table.element(a,'T-STAT',header=TRUE)
a<-table.element(a,'P-value',header=TRUE)
a<-table.row.end(a)
for (i in 2:(par1+1)) {
a<-table.row.start(a)
a<-table.element(a,i-1,header=TRUE)
a<-table.element(a,round(myacf[i],6))
mytstat <- myacf[i]*sqrtn
a<-table.element(a,round(mytstat,4))
a<-table.element(a,round(1-pt(abs(mytstat),lengthx),6))
a<-table.row.end(a)
}
a<-table.end(a)
table.save(a,file='mytable.tab')
a<-table.start()
a<-table.row.start(a)
a<-table.element(a,'Partial Autocorrelation Function',4,TRUE)
a<-table.row.end(a)
a<-table.row.start(a)
a<-table.element(a,'Time lag k',header=TRUE)
a<-table.element(a,hyperlink('basics.htm','PACF(k)','click here for more information about the Partial Autocorrelation Function'),header=TRUE)
a<-table.element(a,'T-STAT',header=TRUE)
a<-table.element(a,'P-value',header=TRUE)
a<-table.row.end(a)
for (i in 1:par1) {
a<-table.row.start(a)
a<-table.element(a,i,header=TRUE)
a<-table.element(a,round(mypacf[i],6))
mytstat <- mypacf[i]*sqrtn
a<-table.element(a,round(mytstat,4))
a<-table.element(a,round(1-pt(abs(mytstat),lengthx),6))
a<-table.row.end(a)
}
a<-table.end(a)
table.save(a,file='mytable1.tab')