Free Statistics

of Irreproducible Research!

Author's title

Author*Unverified author*
R Software Modulerwasp_autocorrelation.wasp
Title produced by software(Partial) Autocorrelation Function
Date of computationSun, 19 Oct 2014 13:11:56 +0100
Cite this page as followsStatistical Computations at FreeStatistics.org, Office for Research Development and Education, URL https://freestatistics.org/blog/index.php?v=date/2014/Oct/19/t1413720808v8guz8tm01ccy6q.htm/, Retrieved Sun, 12 May 2024 02:10:50 +0000
Statistical Computations at FreeStatistics.org, Office for Research Development and Education, URL https://freestatistics.org/blog/index.php?pk=243600, Retrieved Sun, 12 May 2024 02:10:50 +0000
QR Codes:

Original text written by user:
IsPrivate?No (this computation is public)
User-defined keywords
Estimated Impact102
Family? (F = Feedback message, R = changed R code, M = changed R Module, P = changed Parameters, D = changed Data)
-       [(Partial) Autocorrelation Function] [] [2014-10-19 12:11:56] [b14d23c6a1d7f8e7693f95bb395763d5] [Current]
Feedback Forum

Post a new message
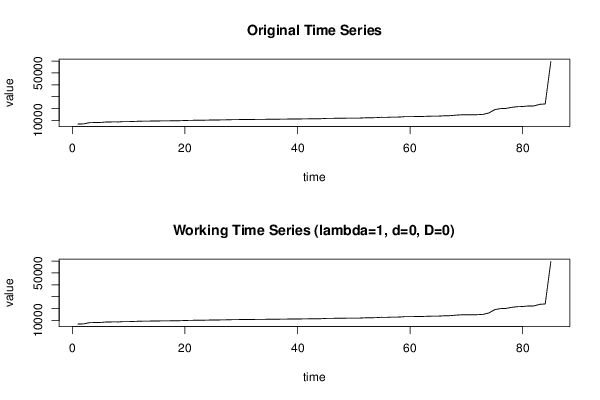
Dataseries X:
6900
7045
8044
8196
8257
8623
8644
8648
8961
8961
9116
9313
9360
9429
9485
9580
9606
9679
9726
9898
10028
10082
10091
10228
10337
10372
10425
10573
10680
10685
10771
10783
10849
10865
10954
10962
11026
11080
11210
11222
11236
11329
11334
11394
11648
11677
11816
11839
11874
11911
11918
12164
12177
12347
12624
12627
12782
12794
13142
13149
13240
13270
13445
13579
13601
13878
13957
14360
14687
14771
14779
14825
15119
16244
18983
19940
20067
20993
21545
21709
22165
22205
23533
23882
59646


Summary of computational transaction
Raw Inputview raw input (R code)
Raw Outputview raw output of R engine
Computing time2 seconds
R Server'Sir Maurice George Kendall' @ kendall.wessa.net

\begin{tabular}{lllllllll}
\hline
Summary of computational transaction \tabularnewline
Raw Input & view raw input (R code)  \tabularnewline
Raw Output & view raw output of R engine  \tabularnewline
Computing time & 2 seconds \tabularnewline
R Server & 'Sir Maurice George Kendall' @ kendall.wessa.net \tabularnewline
\hline
\end{tabular}
%Source: https://freestatistics.org/blog/index.php?pk=243600&T=0

[TABLE]
[ROW][C]Summary of computational transaction[/C][/ROW]
[ROW][C]Raw Input[/C][C]view raw input (R code) [/C][/ROW]
[ROW][C]Raw Output[/C][C]view raw output of R engine [/C][/ROW]
[ROW][C]Computing time[/C][C]2 seconds[/C][/ROW]
[ROW][C]R Server[/C][C]'Sir Maurice George Kendall' @ kendall.wessa.net[/C][/ROW]
[/TABLE]
Source: https://freestatistics.org/blog/index.php?pk=243600&T=0

Globally Unique Identifier (entire table): ba.freestatistics.org/blog/index.php?pk=243600&T=0

As an alternative you can also use a QR Code:  

The GUIDs for individual cells are displayed in the table below:

Summary of computational transaction
Raw Inputview raw input (R code)
Raw Outputview raw output of R engine
Computing time2 seconds
R Server'Sir Maurice George Kendall' @ kendall.wessa.net


Autocorrelation Function
Time lag kACF(k)T-STATP-value
10.4907814.52481e-05
20.4601714.24262.8e-05
30.4207913.87950.000103
40.3976413.66610.000214
50.369093.40280.00051
60.3443283.17450.001045
70.314812.90240.002358
80.2819072.59910.00551
90.2590932.38870.009561
100.2267232.09030.01979
110.1784061.64480.05185
120.1553451.43220.077875
130.1440381.3280.093872
140.1359461.25340.106756
150.1279891.180.120646
160.1188491.09570.138145
170.1069280.98580.163508
180.0948760.87470.192098
190.0871550.80350.211956
200.0774910.71440.238459
210.0710430.6550.257122
220.0631210.58190.281072
230.054810.50530.307319
240.0483740.4460.328371
250.0411180.37910.352784
260.0348160.3210.374505
270.0247290.2280.4101
280.0192340.17730.429835
290.0120960.11150.455734
300.0066540.06130.475615
31-0.001862-0.01720.493173
32-0.008745-0.08060.467966
33-0.013563-0.1250.45039
34-0.021023-0.19380.423389
35-0.025313-0.23340.408017
36-0.030094-0.27740.391055
37-0.034999-0.32270.373865
38-0.039807-0.3670.357266
39-0.045802-0.42230.336946
40-0.050482-0.46540.32141
41-0.057608-0.53110.298361
42-0.062004-0.57170.284533
43-0.065891-0.60750.272574
44-0.070798-0.65270.257848
45-0.074418-0.68610.24726
46-0.078144-0.72050.23661
47-0.083123-0.76640.222793
48-0.08715-0.80350.211969

\begin{tabular}{lllllllll}
\hline
Autocorrelation Function \tabularnewline
Time lag k & ACF(k) & T-STAT & P-value \tabularnewline
1 & 0.490781 & 4.5248 & 1e-05 \tabularnewline
2 & 0.460171 & 4.2426 & 2.8e-05 \tabularnewline
3 & 0.420791 & 3.8795 & 0.000103 \tabularnewline
4 & 0.397641 & 3.6661 & 0.000214 \tabularnewline
5 & 0.36909 & 3.4028 & 0.00051 \tabularnewline
6 & 0.344328 & 3.1745 & 0.001045 \tabularnewline
7 & 0.31481 & 2.9024 & 0.002358 \tabularnewline
8 & 0.281907 & 2.5991 & 0.00551 \tabularnewline
9 & 0.259093 & 2.3887 & 0.009561 \tabularnewline
10 & 0.226723 & 2.0903 & 0.01979 \tabularnewline
11 & 0.178406 & 1.6448 & 0.05185 \tabularnewline
12 & 0.155345 & 1.4322 & 0.077875 \tabularnewline
13 & 0.144038 & 1.328 & 0.093872 \tabularnewline
14 & 0.135946 & 1.2534 & 0.106756 \tabularnewline
15 & 0.127989 & 1.18 & 0.120646 \tabularnewline
16 & 0.118849 & 1.0957 & 0.138145 \tabularnewline
17 & 0.106928 & 0.9858 & 0.163508 \tabularnewline
18 & 0.094876 & 0.8747 & 0.192098 \tabularnewline
19 & 0.087155 & 0.8035 & 0.211956 \tabularnewline
20 & 0.077491 & 0.7144 & 0.238459 \tabularnewline
21 & 0.071043 & 0.655 & 0.257122 \tabularnewline
22 & 0.063121 & 0.5819 & 0.281072 \tabularnewline
23 & 0.05481 & 0.5053 & 0.307319 \tabularnewline
24 & 0.048374 & 0.446 & 0.328371 \tabularnewline
25 & 0.041118 & 0.3791 & 0.352784 \tabularnewline
26 & 0.034816 & 0.321 & 0.374505 \tabularnewline
27 & 0.024729 & 0.228 & 0.4101 \tabularnewline
28 & 0.019234 & 0.1773 & 0.429835 \tabularnewline
29 & 0.012096 & 0.1115 & 0.455734 \tabularnewline
30 & 0.006654 & 0.0613 & 0.475615 \tabularnewline
31 & -0.001862 & -0.0172 & 0.493173 \tabularnewline
32 & -0.008745 & -0.0806 & 0.467966 \tabularnewline
33 & -0.013563 & -0.125 & 0.45039 \tabularnewline
34 & -0.021023 & -0.1938 & 0.423389 \tabularnewline
35 & -0.025313 & -0.2334 & 0.408017 \tabularnewline
36 & -0.030094 & -0.2774 & 0.391055 \tabularnewline
37 & -0.034999 & -0.3227 & 0.373865 \tabularnewline
38 & -0.039807 & -0.367 & 0.357266 \tabularnewline
39 & -0.045802 & -0.4223 & 0.336946 \tabularnewline
40 & -0.050482 & -0.4654 & 0.32141 \tabularnewline
41 & -0.057608 & -0.5311 & 0.298361 \tabularnewline
42 & -0.062004 & -0.5717 & 0.284533 \tabularnewline
43 & -0.065891 & -0.6075 & 0.272574 \tabularnewline
44 & -0.070798 & -0.6527 & 0.257848 \tabularnewline
45 & -0.074418 & -0.6861 & 0.24726 \tabularnewline
46 & -0.078144 & -0.7205 & 0.23661 \tabularnewline
47 & -0.083123 & -0.7664 & 0.222793 \tabularnewline
48 & -0.08715 & -0.8035 & 0.211969 \tabularnewline
\hline
\end{tabular}
%Source: https://freestatistics.org/blog/index.php?pk=243600&T=1

[TABLE]
[ROW][C]Autocorrelation Function[/C][/ROW]
[ROW][C]Time lag k[/C][C]ACF(k)[/C][C]T-STAT[/C][C]P-value[/C][/ROW]
[ROW][C]1[/C][C]0.490781[/C][C]4.5248[/C][C]1e-05[/C][/ROW]
[ROW][C]2[/C][C]0.460171[/C][C]4.2426[/C][C]2.8e-05[/C][/ROW]
[ROW][C]3[/C][C]0.420791[/C][C]3.8795[/C][C]0.000103[/C][/ROW]
[ROW][C]4[/C][C]0.397641[/C][C]3.6661[/C][C]0.000214[/C][/ROW]
[ROW][C]5[/C][C]0.36909[/C][C]3.4028[/C][C]0.00051[/C][/ROW]
[ROW][C]6[/C][C]0.344328[/C][C]3.1745[/C][C]0.001045[/C][/ROW]
[ROW][C]7[/C][C]0.31481[/C][C]2.9024[/C][C]0.002358[/C][/ROW]
[ROW][C]8[/C][C]0.281907[/C][C]2.5991[/C][C]0.00551[/C][/ROW]
[ROW][C]9[/C][C]0.259093[/C][C]2.3887[/C][C]0.009561[/C][/ROW]
[ROW][C]10[/C][C]0.226723[/C][C]2.0903[/C][C]0.01979[/C][/ROW]
[ROW][C]11[/C][C]0.178406[/C][C]1.6448[/C][C]0.05185[/C][/ROW]
[ROW][C]12[/C][C]0.155345[/C][C]1.4322[/C][C]0.077875[/C][/ROW]
[ROW][C]13[/C][C]0.144038[/C][C]1.328[/C][C]0.093872[/C][/ROW]
[ROW][C]14[/C][C]0.135946[/C][C]1.2534[/C][C]0.106756[/C][/ROW]
[ROW][C]15[/C][C]0.127989[/C][C]1.18[/C][C]0.120646[/C][/ROW]
[ROW][C]16[/C][C]0.118849[/C][C]1.0957[/C][C]0.138145[/C][/ROW]
[ROW][C]17[/C][C]0.106928[/C][C]0.9858[/C][C]0.163508[/C][/ROW]
[ROW][C]18[/C][C]0.094876[/C][C]0.8747[/C][C]0.192098[/C][/ROW]
[ROW][C]19[/C][C]0.087155[/C][C]0.8035[/C][C]0.211956[/C][/ROW]
[ROW][C]20[/C][C]0.077491[/C][C]0.7144[/C][C]0.238459[/C][/ROW]
[ROW][C]21[/C][C]0.071043[/C][C]0.655[/C][C]0.257122[/C][/ROW]
[ROW][C]22[/C][C]0.063121[/C][C]0.5819[/C][C]0.281072[/C][/ROW]
[ROW][C]23[/C][C]0.05481[/C][C]0.5053[/C][C]0.307319[/C][/ROW]
[ROW][C]24[/C][C]0.048374[/C][C]0.446[/C][C]0.328371[/C][/ROW]
[ROW][C]25[/C][C]0.041118[/C][C]0.3791[/C][C]0.352784[/C][/ROW]
[ROW][C]26[/C][C]0.034816[/C][C]0.321[/C][C]0.374505[/C][/ROW]
[ROW][C]27[/C][C]0.024729[/C][C]0.228[/C][C]0.4101[/C][/ROW]
[ROW][C]28[/C][C]0.019234[/C][C]0.1773[/C][C]0.429835[/C][/ROW]
[ROW][C]29[/C][C]0.012096[/C][C]0.1115[/C][C]0.455734[/C][/ROW]
[ROW][C]30[/C][C]0.006654[/C][C]0.0613[/C][C]0.475615[/C][/ROW]
[ROW][C]31[/C][C]-0.001862[/C][C]-0.0172[/C][C]0.493173[/C][/ROW]
[ROW][C]32[/C][C]-0.008745[/C][C]-0.0806[/C][C]0.467966[/C][/ROW]
[ROW][C]33[/C][C]-0.013563[/C][C]-0.125[/C][C]0.45039[/C][/ROW]
[ROW][C]34[/C][C]-0.021023[/C][C]-0.1938[/C][C]0.423389[/C][/ROW]
[ROW][C]35[/C][C]-0.025313[/C][C]-0.2334[/C][C]0.408017[/C][/ROW]
[ROW][C]36[/C][C]-0.030094[/C][C]-0.2774[/C][C]0.391055[/C][/ROW]
[ROW][C]37[/C][C]-0.034999[/C][C]-0.3227[/C][C]0.373865[/C][/ROW]
[ROW][C]38[/C][C]-0.039807[/C][C]-0.367[/C][C]0.357266[/C][/ROW]
[ROW][C]39[/C][C]-0.045802[/C][C]-0.4223[/C][C]0.336946[/C][/ROW]
[ROW][C]40[/C][C]-0.050482[/C][C]-0.4654[/C][C]0.32141[/C][/ROW]
[ROW][C]41[/C][C]-0.057608[/C][C]-0.5311[/C][C]0.298361[/C][/ROW]
[ROW][C]42[/C][C]-0.062004[/C][C]-0.5717[/C][C]0.284533[/C][/ROW]
[ROW][C]43[/C][C]-0.065891[/C][C]-0.6075[/C][C]0.272574[/C][/ROW]
[ROW][C]44[/C][C]-0.070798[/C][C]-0.6527[/C][C]0.257848[/C][/ROW]
[ROW][C]45[/C][C]-0.074418[/C][C]-0.6861[/C][C]0.24726[/C][/ROW]
[ROW][C]46[/C][C]-0.078144[/C][C]-0.7205[/C][C]0.23661[/C][/ROW]
[ROW][C]47[/C][C]-0.083123[/C][C]-0.7664[/C][C]0.222793[/C][/ROW]
[ROW][C]48[/C][C]-0.08715[/C][C]-0.8035[/C][C]0.211969[/C][/ROW]
[/TABLE]
Source: https://freestatistics.org/blog/index.php?pk=243600&T=1

Globally Unique Identifier (entire table): ba.freestatistics.org/blog/index.php?pk=243600&T=1

As an alternative you can also use a QR Code:  

The GUIDs for individual cells are displayed in the table below:

Autocorrelation Function
Time lag kACF(k)T-STATP-value
10.4907814.52481e-05
20.4601714.24262.8e-05
30.4207913.87950.000103
40.3976413.66610.000214
50.369093.40280.00051
60.3443283.17450.001045
70.314812.90240.002358
80.2819072.59910.00551
90.2590932.38870.009561
100.2267232.09030.01979
110.1784061.64480.05185
120.1553451.43220.077875
130.1440381.3280.093872
140.1359461.25340.106756
150.1279891.180.120646
160.1188491.09570.138145
170.1069280.98580.163508
180.0948760.87470.192098
190.0871550.80350.211956
200.0774910.71440.238459
210.0710430.6550.257122
220.0631210.58190.281072
230.054810.50530.307319
240.0483740.4460.328371
250.0411180.37910.352784
260.0348160.3210.374505
270.0247290.2280.4101
280.0192340.17730.429835
290.0120960.11150.455734
300.0066540.06130.475615
31-0.001862-0.01720.493173
32-0.008745-0.08060.467966
33-0.013563-0.1250.45039
34-0.021023-0.19380.423389
35-0.025313-0.23340.408017
36-0.030094-0.27740.391055
37-0.034999-0.32270.373865
38-0.039807-0.3670.357266
39-0.045802-0.42230.336946
40-0.050482-0.46540.32141
41-0.057608-0.53110.298361
42-0.062004-0.57170.284533
43-0.065891-0.60750.272574
44-0.070798-0.65270.257848
45-0.074418-0.68610.24726
46-0.078144-0.72050.23661
47-0.083123-0.76640.222793
48-0.08715-0.80350.211969


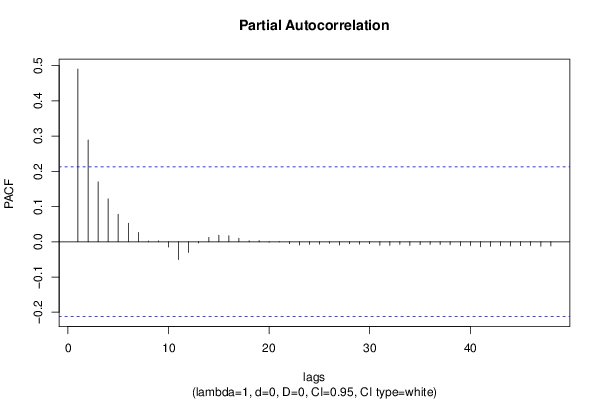
Partial Autocorrelation Function
Time lag kPACF(k)T-STATP-value
10.4907814.52481e-05
20.2888882.66340.004626
30.1701851.5690.060179
40.1218761.12360.132165
50.0781230.72030.23667
60.0526750.48560.314235
70.026180.24140.404925
80.0024960.0230.490846
90.0025550.02360.490631
10-0.014973-0.1380.445266
11-0.050412-0.46480.32164
12-0.030249-0.27890.390508
13-0.003249-0.030.488087
140.0124460.11470.454459
150.0185240.17080.432398
160.017250.1590.43701
170.0100820.0930.463081
180.0032020.02950.48826
190.0033780.03110.487613
20-0.001035-0.00950.496204
21-0.000602-0.00560.497791
22-0.005402-0.04980.480199
23-0.009236-0.08520.466169
24-0.007293-0.06720.473276
25-0.006721-0.0620.475368
26-0.004466-0.04120.483628
27-0.009124-0.08410.466578
28-0.005377-0.04960.480289
29-0.006741-0.06210.475297
30-0.005604-0.05170.479456
31-0.010084-0.0930.463073
32-0.010115-0.09330.462958
33-0.007286-0.06720.473301
34-0.010715-0.09880.460771
35-0.008012-0.07390.470644
36-0.007462-0.06880.472655
37-0.007873-0.07260.471155
38-0.008518-0.07850.468793
39-0.011052-0.10190.45954
40-0.010565-0.09740.461318
41-0.014222-0.13110.447995
42-0.012575-0.11590.453989
43-0.011076-0.10210.459452
44-0.012112-0.11170.455675
45-0.010974-0.10120.459826
46-0.010561-0.09740.461331
47-0.012466-0.11490.454384
48-0.012096-0.11150.455735

\begin{tabular}{lllllllll}
\hline
Partial Autocorrelation Function \tabularnewline
Time lag k & PACF(k) & T-STAT & P-value \tabularnewline
1 & 0.490781 & 4.5248 & 1e-05 \tabularnewline
2 & 0.288888 & 2.6634 & 0.004626 \tabularnewline
3 & 0.170185 & 1.569 & 0.060179 \tabularnewline
4 & 0.121876 & 1.1236 & 0.132165 \tabularnewline
5 & 0.078123 & 0.7203 & 0.23667 \tabularnewline
6 & 0.052675 & 0.4856 & 0.314235 \tabularnewline
7 & 0.02618 & 0.2414 & 0.404925 \tabularnewline
8 & 0.002496 & 0.023 & 0.490846 \tabularnewline
9 & 0.002555 & 0.0236 & 0.490631 \tabularnewline
10 & -0.014973 & -0.138 & 0.445266 \tabularnewline
11 & -0.050412 & -0.4648 & 0.32164 \tabularnewline
12 & -0.030249 & -0.2789 & 0.390508 \tabularnewline
13 & -0.003249 & -0.03 & 0.488087 \tabularnewline
14 & 0.012446 & 0.1147 & 0.454459 \tabularnewline
15 & 0.018524 & 0.1708 & 0.432398 \tabularnewline
16 & 0.01725 & 0.159 & 0.43701 \tabularnewline
17 & 0.010082 & 0.093 & 0.463081 \tabularnewline
18 & 0.003202 & 0.0295 & 0.48826 \tabularnewline
19 & 0.003378 & 0.0311 & 0.487613 \tabularnewline
20 & -0.001035 & -0.0095 & 0.496204 \tabularnewline
21 & -0.000602 & -0.0056 & 0.497791 \tabularnewline
22 & -0.005402 & -0.0498 & 0.480199 \tabularnewline
23 & -0.009236 & -0.0852 & 0.466169 \tabularnewline
24 & -0.007293 & -0.0672 & 0.473276 \tabularnewline
25 & -0.006721 & -0.062 & 0.475368 \tabularnewline
26 & -0.004466 & -0.0412 & 0.483628 \tabularnewline
27 & -0.009124 & -0.0841 & 0.466578 \tabularnewline
28 & -0.005377 & -0.0496 & 0.480289 \tabularnewline
29 & -0.006741 & -0.0621 & 0.475297 \tabularnewline
30 & -0.005604 & -0.0517 & 0.479456 \tabularnewline
31 & -0.010084 & -0.093 & 0.463073 \tabularnewline
32 & -0.010115 & -0.0933 & 0.462958 \tabularnewline
33 & -0.007286 & -0.0672 & 0.473301 \tabularnewline
34 & -0.010715 & -0.0988 & 0.460771 \tabularnewline
35 & -0.008012 & -0.0739 & 0.470644 \tabularnewline
36 & -0.007462 & -0.0688 & 0.472655 \tabularnewline
37 & -0.007873 & -0.0726 & 0.471155 \tabularnewline
38 & -0.008518 & -0.0785 & 0.468793 \tabularnewline
39 & -0.011052 & -0.1019 & 0.45954 \tabularnewline
40 & -0.010565 & -0.0974 & 0.461318 \tabularnewline
41 & -0.014222 & -0.1311 & 0.447995 \tabularnewline
42 & -0.012575 & -0.1159 & 0.453989 \tabularnewline
43 & -0.011076 & -0.1021 & 0.459452 \tabularnewline
44 & -0.012112 & -0.1117 & 0.455675 \tabularnewline
45 & -0.010974 & -0.1012 & 0.459826 \tabularnewline
46 & -0.010561 & -0.0974 & 0.461331 \tabularnewline
47 & -0.012466 & -0.1149 & 0.454384 \tabularnewline
48 & -0.012096 & -0.1115 & 0.455735 \tabularnewline
\hline
\end{tabular}
%Source: https://freestatistics.org/blog/index.php?pk=243600&T=2

[TABLE]
[ROW][C]Partial Autocorrelation Function[/C][/ROW]
[ROW][C]Time lag k[/C][C]PACF(k)[/C][C]T-STAT[/C][C]P-value[/C][/ROW]
[ROW][C]1[/C][C]0.490781[/C][C]4.5248[/C][C]1e-05[/C][/ROW]
[ROW][C]2[/C][C]0.288888[/C][C]2.6634[/C][C]0.004626[/C][/ROW]
[ROW][C]3[/C][C]0.170185[/C][C]1.569[/C][C]0.060179[/C][/ROW]
[ROW][C]4[/C][C]0.121876[/C][C]1.1236[/C][C]0.132165[/C][/ROW]
[ROW][C]5[/C][C]0.078123[/C][C]0.7203[/C][C]0.23667[/C][/ROW]
[ROW][C]6[/C][C]0.052675[/C][C]0.4856[/C][C]0.314235[/C][/ROW]
[ROW][C]7[/C][C]0.02618[/C][C]0.2414[/C][C]0.404925[/C][/ROW]
[ROW][C]8[/C][C]0.002496[/C][C]0.023[/C][C]0.490846[/C][/ROW]
[ROW][C]9[/C][C]0.002555[/C][C]0.0236[/C][C]0.490631[/C][/ROW]
[ROW][C]10[/C][C]-0.014973[/C][C]-0.138[/C][C]0.445266[/C][/ROW]
[ROW][C]11[/C][C]-0.050412[/C][C]-0.4648[/C][C]0.32164[/C][/ROW]
[ROW][C]12[/C][C]-0.030249[/C][C]-0.2789[/C][C]0.390508[/C][/ROW]
[ROW][C]13[/C][C]-0.003249[/C][C]-0.03[/C][C]0.488087[/C][/ROW]
[ROW][C]14[/C][C]0.012446[/C][C]0.1147[/C][C]0.454459[/C][/ROW]
[ROW][C]15[/C][C]0.018524[/C][C]0.1708[/C][C]0.432398[/C][/ROW]
[ROW][C]16[/C][C]0.01725[/C][C]0.159[/C][C]0.43701[/C][/ROW]
[ROW][C]17[/C][C]0.010082[/C][C]0.093[/C][C]0.463081[/C][/ROW]
[ROW][C]18[/C][C]0.003202[/C][C]0.0295[/C][C]0.48826[/C][/ROW]
[ROW][C]19[/C][C]0.003378[/C][C]0.0311[/C][C]0.487613[/C][/ROW]
[ROW][C]20[/C][C]-0.001035[/C][C]-0.0095[/C][C]0.496204[/C][/ROW]
[ROW][C]21[/C][C]-0.000602[/C][C]-0.0056[/C][C]0.497791[/C][/ROW]
[ROW][C]22[/C][C]-0.005402[/C][C]-0.0498[/C][C]0.480199[/C][/ROW]
[ROW][C]23[/C][C]-0.009236[/C][C]-0.0852[/C][C]0.466169[/C][/ROW]
[ROW][C]24[/C][C]-0.007293[/C][C]-0.0672[/C][C]0.473276[/C][/ROW]
[ROW][C]25[/C][C]-0.006721[/C][C]-0.062[/C][C]0.475368[/C][/ROW]
[ROW][C]26[/C][C]-0.004466[/C][C]-0.0412[/C][C]0.483628[/C][/ROW]
[ROW][C]27[/C][C]-0.009124[/C][C]-0.0841[/C][C]0.466578[/C][/ROW]
[ROW][C]28[/C][C]-0.005377[/C][C]-0.0496[/C][C]0.480289[/C][/ROW]
[ROW][C]29[/C][C]-0.006741[/C][C]-0.0621[/C][C]0.475297[/C][/ROW]
[ROW][C]30[/C][C]-0.005604[/C][C]-0.0517[/C][C]0.479456[/C][/ROW]
[ROW][C]31[/C][C]-0.010084[/C][C]-0.093[/C][C]0.463073[/C][/ROW]
[ROW][C]32[/C][C]-0.010115[/C][C]-0.0933[/C][C]0.462958[/C][/ROW]
[ROW][C]33[/C][C]-0.007286[/C][C]-0.0672[/C][C]0.473301[/C][/ROW]
[ROW][C]34[/C][C]-0.010715[/C][C]-0.0988[/C][C]0.460771[/C][/ROW]
[ROW][C]35[/C][C]-0.008012[/C][C]-0.0739[/C][C]0.470644[/C][/ROW]
[ROW][C]36[/C][C]-0.007462[/C][C]-0.0688[/C][C]0.472655[/C][/ROW]
[ROW][C]37[/C][C]-0.007873[/C][C]-0.0726[/C][C]0.471155[/C][/ROW]
[ROW][C]38[/C][C]-0.008518[/C][C]-0.0785[/C][C]0.468793[/C][/ROW]
[ROW][C]39[/C][C]-0.011052[/C][C]-0.1019[/C][C]0.45954[/C][/ROW]
[ROW][C]40[/C][C]-0.010565[/C][C]-0.0974[/C][C]0.461318[/C][/ROW]
[ROW][C]41[/C][C]-0.014222[/C][C]-0.1311[/C][C]0.447995[/C][/ROW]
[ROW][C]42[/C][C]-0.012575[/C][C]-0.1159[/C][C]0.453989[/C][/ROW]
[ROW][C]43[/C][C]-0.011076[/C][C]-0.1021[/C][C]0.459452[/C][/ROW]
[ROW][C]44[/C][C]-0.012112[/C][C]-0.1117[/C][C]0.455675[/C][/ROW]
[ROW][C]45[/C][C]-0.010974[/C][C]-0.1012[/C][C]0.459826[/C][/ROW]
[ROW][C]46[/C][C]-0.010561[/C][C]-0.0974[/C][C]0.461331[/C][/ROW]
[ROW][C]47[/C][C]-0.012466[/C][C]-0.1149[/C][C]0.454384[/C][/ROW]
[ROW][C]48[/C][C]-0.012096[/C][C]-0.1115[/C][C]0.455735[/C][/ROW]
[/TABLE]
Source: https://freestatistics.org/blog/index.php?pk=243600&T=2

Globally Unique Identifier (entire table): ba.freestatistics.org/blog/index.php?pk=243600&T=2

As an alternative you can also use a QR Code:  

The GUIDs for individual cells are displayed in the table below:

Partial Autocorrelation Function
Time lag kPACF(k)T-STATP-value
10.4907814.52481e-05
20.2888882.66340.004626
30.1701851.5690.060179
40.1218761.12360.132165
50.0781230.72030.23667
60.0526750.48560.314235
70.026180.24140.404925
80.0024960.0230.490846
90.0025550.02360.490631
10-0.014973-0.1380.445266
11-0.050412-0.46480.32164
12-0.030249-0.27890.390508
13-0.003249-0.030.488087
140.0124460.11470.454459
150.0185240.17080.432398
160.017250.1590.43701
170.0100820.0930.463081
180.0032020.02950.48826
190.0033780.03110.487613
20-0.001035-0.00950.496204
21-0.000602-0.00560.497791
22-0.005402-0.04980.480199
23-0.009236-0.08520.466169
24-0.007293-0.06720.473276
25-0.006721-0.0620.475368
26-0.004466-0.04120.483628
27-0.009124-0.08410.466578
28-0.005377-0.04960.480289
29-0.006741-0.06210.475297
30-0.005604-0.05170.479456
31-0.010084-0.0930.463073
32-0.010115-0.09330.462958
33-0.007286-0.06720.473301
34-0.010715-0.09880.460771
35-0.008012-0.07390.470644
36-0.007462-0.06880.472655
37-0.007873-0.07260.471155
38-0.008518-0.07850.468793
39-0.011052-0.10190.45954
40-0.010565-0.09740.461318
41-0.014222-0.13110.447995
42-0.012575-0.11590.453989
43-0.011076-0.10210.459452
44-0.012112-0.11170.455675
45-0.010974-0.10120.459826
46-0.010561-0.09740.461331
47-0.012466-0.11490.454384
48-0.012096-0.11150.455735


Parameters (Session):
par1 = 48 ; par2 = 1 ; par3 = 0 ; par4 = 0 ; par5 = 12 ; par6 = White Noise ; par7 = 0.95 ;
Parameters (R input):
par1 = 48 ; par2 = 1 ; par3 = 0 ; par4 = 0 ; par5 = 12 ; par6 = White Noise ; par7 = 0.95 ; par8 = ;
R code (references can be found in the software module):
if (par1 == 'Default') {
par1 = 10*log10(length(x))
} else {
par1 <- as.numeric(par1)
}
par2 <- as.numeric(par2)
par3 <- as.numeric(par3)
par4 <- as.numeric(par4)
par5 <- as.numeric(par5)
if (par6 == 'White Noise') par6 <- 'white' else par6 <- 'ma'
par7 <- as.numeric(par7)
if (par8 != '') par8 <- as.numeric(par8)
ox <- x
if (par8 == '') {
if (par2 == 0) {
x <- log(x)
} else {
x <- (x ^ par2 - 1) / par2
}
} else {
x <- log(x,base=par8)
}
if (par3 > 0) x <- diff(x,lag=1,difference=par3)
if (par4 > 0) x <- diff(x,lag=par5,difference=par4)
bitmap(file='picts.png')
op <- par(mfrow=c(2,1))
plot(ox,type='l',main='Original Time Series',xlab='time',ylab='value')
if (par8=='') {
mytitle <- paste('Working Time Series (lambda=',par2,', d=',par3,', D=',par4,')',sep='')
mysub <- paste('(lambda=',par2,', d=',par3,', D=',par4,', CI=', par7, ', CI type=',par6,')',sep='')
} else {
mytitle <- paste('Working Time Series (base=',par8,', d=',par3,', D=',par4,')',sep='')
mysub <- paste('(base=',par8,', d=',par3,', D=',par4,', CI=', par7, ', CI type=',par6,')',sep='')
}
plot(x,type='l', main=mytitle,xlab='time',ylab='value')
par(op)
dev.off()
bitmap(file='pic1.png')
racf <- acf(x, par1, main='Autocorrelation', xlab='time lag', ylab='ACF', ci.type=par6, ci=par7, sub=mysub)
dev.off()
bitmap(file='pic2.png')
rpacf <- pacf(x,par1,main='Partial Autocorrelation',xlab='lags',ylab='PACF',sub=mysub)
dev.off()
(myacf <- c(racf$acf))
(mypacf <- c(rpacf$acf))
lengthx <- length(x)
sqrtn <- sqrt(lengthx)
load(file='createtable')
a<-table.start()
a<-table.row.start(a)
a<-table.element(a,'Autocorrelation Function',4,TRUE)
a<-table.row.end(a)
a<-table.row.start(a)
a<-table.element(a,'Time lag k',header=TRUE)
a<-table.element(a,hyperlink('basics.htm','ACF(k)','click here for more information about the Autocorrelation Function'),header=TRUE)
a<-table.element(a,'T-STAT',header=TRUE)
a<-table.element(a,'P-value',header=TRUE)
a<-table.row.end(a)
for (i in 2:(par1+1)) {
a<-table.row.start(a)
a<-table.element(a,i-1,header=TRUE)
a<-table.element(a,round(myacf[i],6))
mytstat <- myacf[i]*sqrtn
a<-table.element(a,round(mytstat,4))
a<-table.element(a,round(1-pt(abs(mytstat),lengthx),6))
a<-table.row.end(a)
}
a<-table.end(a)
table.save(a,file='mytable.tab')
a<-table.start()
a<-table.row.start(a)
a<-table.element(a,'Partial Autocorrelation Function',4,TRUE)
a<-table.row.end(a)
a<-table.row.start(a)
a<-table.element(a,'Time lag k',header=TRUE)
a<-table.element(a,hyperlink('basics.htm','PACF(k)','click here for more information about the Partial Autocorrelation Function'),header=TRUE)
a<-table.element(a,'T-STAT',header=TRUE)
a<-table.element(a,'P-value',header=TRUE)
a<-table.row.end(a)
for (i in 1:par1) {
a<-table.row.start(a)
a<-table.element(a,i,header=TRUE)
a<-table.element(a,round(mypacf[i],6))
mytstat <- mypacf[i]*sqrtn
a<-table.element(a,round(mytstat,4))
a<-table.element(a,round(1-pt(abs(mytstat),lengthx),6))
a<-table.row.end(a)
}
a<-table.end(a)
table.save(a,file='mytable1.tab')