Free Statistics

of Irreproducible Research!

Author's title

Author*Unverified author*
R Software Modulerwasp_autocorrelation.wasp
Title produced by software(Partial) Autocorrelation Function
Date of computationSun, 19 Oct 2014 12:31:43 +0100
Cite this page as followsStatistical Computations at FreeStatistics.org, Office for Research Development and Education, URL https://freestatistics.org/blog/index.php?v=date/2014/Oct/19/t1413718338j51my9gbab0qkue.htm/, Retrieved Sun, 12 May 2024 00:46:48 +0000
Statistical Computations at FreeStatistics.org, Office for Research Development and Education, URL https://freestatistics.org/blog/index.php?pk=243587, Retrieved Sun, 12 May 2024 00:46:48 +0000
QR Codes:

Original text written by user:
IsPrivate?No (this computation is public)
User-defined keywords
Estimated Impact128
Family? (F = Feedback message, R = changed R code, M = changed R Module, P = changed Parameters, D = changed Data)
-     [Univariate Data Series] [] [2014-09-17 11:31:44] [94f95ef037a5ad1df99581667eb46a7c]
- R P   [Univariate Data Series] [] [2014-09-18 13:29:36] [94f95ef037a5ad1df99581667eb46a7c]
- RMP       [(Partial) Autocorrelation Function] [] [2014-10-19 11:31:43] [1b1e43390f81e2233427cd22b8161931] [Current]
Feedback Forum

Post a new message
Dataseries X:
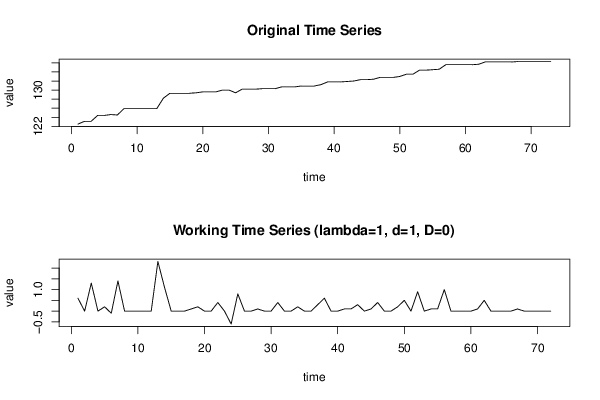
122.5
123.1
123.1
124.4
124.4
124.6
124.5
125.9
125.9
125.9
125.9
125.9
125.9
128.2
129.3
129.3
129.3
129.3
129.4
129.6
129.6
129.6
130
130
129.4
130.2
130.2
130.2
130.3
130.3
130.3
130.7
130.7
130.7
130.9
130.9
130.9
131.2
131.8
131.8
131.8
131.9
132
132.3
132.3
132.4
132.8
132.8
132.8
133
133.5
133.5
134.4
134.4
134.5
134.6
135.6
135.6
135.6
135.6
135.6
135.7
136.2
136.2
136.2
136.2
136.2
136.3
136.3
136.3
136.3
136.3
136.3


Summary of computational transaction
Raw Inputview raw input (R code)
Raw Outputview raw output of R engine
Computing time1 seconds
R Server'George Udny Yule' @ yule.wessa.net

\begin{tabular}{lllllllll}
\hline
Summary of computational transaction \tabularnewline
Raw Input & view raw input (R code)  \tabularnewline
Raw Output & view raw output of R engine  \tabularnewline
Computing time & 1 seconds \tabularnewline
R Server & 'George Udny Yule' @ yule.wessa.net \tabularnewline
\hline
\end{tabular}
%Source: https://freestatistics.org/blog/index.php?pk=243587&T=0

[TABLE]
[ROW][C]Summary of computational transaction[/C][/ROW]
[ROW][C]Raw Input[/C][C]view raw input (R code) [/C][/ROW]
[ROW][C]Raw Output[/C][C]view raw output of R engine [/C][/ROW]
[ROW][C]Computing time[/C][C]1 seconds[/C][/ROW]
[ROW][C]R Server[/C][C]'George Udny Yule' @ yule.wessa.net[/C][/ROW]
[/TABLE]
Source: https://freestatistics.org/blog/index.php?pk=243587&T=0

Globally Unique Identifier (entire table): ba.freestatistics.org/blog/index.php?pk=243587&T=0

As an alternative you can also use a QR Code:  

The GUIDs for individual cells are displayed in the table below:

Summary of computational transaction
Raw Inputview raw input (R code)
Raw Outputview raw output of R engine
Computing time1 seconds
R Server'George Udny Yule' @ yule.wessa.net


Autocorrelation Function
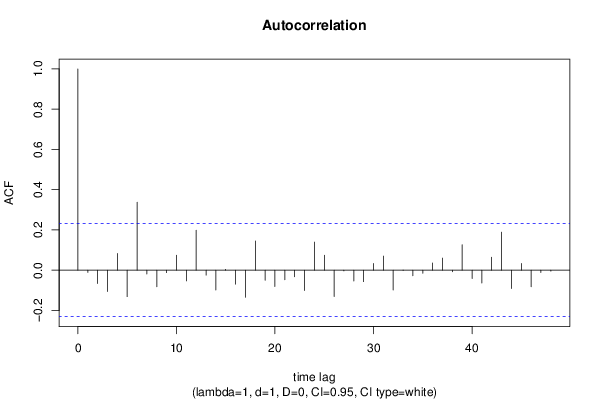
Time lag kACF(k)T-STATP-value
1-0.010978-0.09320.46302
2-0.066116-0.5610.288266
3-0.106065-0.90.185562
40.0828760.70320.242091
5-0.131367-1.11470.134345
60.3377832.86620.002722
7-0.019375-0.16440.434937
8-0.082542-0.70040.242971
9-0.012428-0.10550.458154
100.0745460.63250.264517
11-0.053186-0.45130.326566
120.1983141.68270.048378
13-0.024561-0.20840.417751
14-0.0989-0.83920.202068
150.0041320.03510.486066
16-0.069472-0.58950.278688
17-0.134913-1.14480.128046
180.1446211.22710.111882
19-0.05042-0.42780.335025
20-0.081471-0.69130.245798
21-0.047287-0.40120.344715
22-0.03284-0.27870.390652
23-0.101159-0.85840.196771
240.1394351.18310.120321
250.0741280.6290.265671
26-0.13115-1.11280.134739
27-0.003496-0.02970.488209
28-0.05395-0.45780.324245
29-0.056899-0.48280.315349
300.0330860.28070.389857
310.0699460.59350.277349
32-0.098466-0.83550.203098
33-0.001054-0.00890.496445
34-0.028224-0.23950.405704
35-0.015517-0.13170.447808
360.0359290.30490.380672
370.0600770.50980.305885
38-0.008308-0.07050.471998
390.1267061.07510.142951
40-0.041639-0.35330.362442
41-0.063925-0.54240.294603
420.0644650.5470.293033
430.1889751.60350.056601
44-0.090972-0.77190.221343
450.0328010.27830.390779
46-0.082017-0.69590.244353
47-0.011904-0.1010.459912
48-0.004951-0.0420.483303

\begin{tabular}{lllllllll}
\hline
Autocorrelation Function \tabularnewline
Time lag k & ACF(k) & T-STAT & P-value \tabularnewline
1 & -0.010978 & -0.0932 & 0.46302 \tabularnewline
2 & -0.066116 & -0.561 & 0.288266 \tabularnewline
3 & -0.106065 & -0.9 & 0.185562 \tabularnewline
4 & 0.082876 & 0.7032 & 0.242091 \tabularnewline
5 & -0.131367 & -1.1147 & 0.134345 \tabularnewline
6 & 0.337783 & 2.8662 & 0.002722 \tabularnewline
7 & -0.019375 & -0.1644 & 0.434937 \tabularnewline
8 & -0.082542 & -0.7004 & 0.242971 \tabularnewline
9 & -0.012428 & -0.1055 & 0.458154 \tabularnewline
10 & 0.074546 & 0.6325 & 0.264517 \tabularnewline
11 & -0.053186 & -0.4513 & 0.326566 \tabularnewline
12 & 0.198314 & 1.6827 & 0.048378 \tabularnewline
13 & -0.024561 & -0.2084 & 0.417751 \tabularnewline
14 & -0.0989 & -0.8392 & 0.202068 \tabularnewline
15 & 0.004132 & 0.0351 & 0.486066 \tabularnewline
16 & -0.069472 & -0.5895 & 0.278688 \tabularnewline
17 & -0.134913 & -1.1448 & 0.128046 \tabularnewline
18 & 0.144621 & 1.2271 & 0.111882 \tabularnewline
19 & -0.05042 & -0.4278 & 0.335025 \tabularnewline
20 & -0.081471 & -0.6913 & 0.245798 \tabularnewline
21 & -0.047287 & -0.4012 & 0.344715 \tabularnewline
22 & -0.03284 & -0.2787 & 0.390652 \tabularnewline
23 & -0.101159 & -0.8584 & 0.196771 \tabularnewline
24 & 0.139435 & 1.1831 & 0.120321 \tabularnewline
25 & 0.074128 & 0.629 & 0.265671 \tabularnewline
26 & -0.13115 & -1.1128 & 0.134739 \tabularnewline
27 & -0.003496 & -0.0297 & 0.488209 \tabularnewline
28 & -0.05395 & -0.4578 & 0.324245 \tabularnewline
29 & -0.056899 & -0.4828 & 0.315349 \tabularnewline
30 & 0.033086 & 0.2807 & 0.389857 \tabularnewline
31 & 0.069946 & 0.5935 & 0.277349 \tabularnewline
32 & -0.098466 & -0.8355 & 0.203098 \tabularnewline
33 & -0.001054 & -0.0089 & 0.496445 \tabularnewline
34 & -0.028224 & -0.2395 & 0.405704 \tabularnewline
35 & -0.015517 & -0.1317 & 0.447808 \tabularnewline
36 & 0.035929 & 0.3049 & 0.380672 \tabularnewline
37 & 0.060077 & 0.5098 & 0.305885 \tabularnewline
38 & -0.008308 & -0.0705 & 0.471998 \tabularnewline
39 & 0.126706 & 1.0751 & 0.142951 \tabularnewline
40 & -0.041639 & -0.3533 & 0.362442 \tabularnewline
41 & -0.063925 & -0.5424 & 0.294603 \tabularnewline
42 & 0.064465 & 0.547 & 0.293033 \tabularnewline
43 & 0.188975 & 1.6035 & 0.056601 \tabularnewline
44 & -0.090972 & -0.7719 & 0.221343 \tabularnewline
45 & 0.032801 & 0.2783 & 0.390779 \tabularnewline
46 & -0.082017 & -0.6959 & 0.244353 \tabularnewline
47 & -0.011904 & -0.101 & 0.459912 \tabularnewline
48 & -0.004951 & -0.042 & 0.483303 \tabularnewline
\hline
\end{tabular}
%Source: https://freestatistics.org/blog/index.php?pk=243587&T=1

[TABLE]
[ROW][C]Autocorrelation Function[/C][/ROW]
[ROW][C]Time lag k[/C][C]ACF(k)[/C][C]T-STAT[/C][C]P-value[/C][/ROW]
[ROW][C]1[/C][C]-0.010978[/C][C]-0.0932[/C][C]0.46302[/C][/ROW]
[ROW][C]2[/C][C]-0.066116[/C][C]-0.561[/C][C]0.288266[/C][/ROW]
[ROW][C]3[/C][C]-0.106065[/C][C]-0.9[/C][C]0.185562[/C][/ROW]
[ROW][C]4[/C][C]0.082876[/C][C]0.7032[/C][C]0.242091[/C][/ROW]
[ROW][C]5[/C][C]-0.131367[/C][C]-1.1147[/C][C]0.134345[/C][/ROW]
[ROW][C]6[/C][C]0.337783[/C][C]2.8662[/C][C]0.002722[/C][/ROW]
[ROW][C]7[/C][C]-0.019375[/C][C]-0.1644[/C][C]0.434937[/C][/ROW]
[ROW][C]8[/C][C]-0.082542[/C][C]-0.7004[/C][C]0.242971[/C][/ROW]
[ROW][C]9[/C][C]-0.012428[/C][C]-0.1055[/C][C]0.458154[/C][/ROW]
[ROW][C]10[/C][C]0.074546[/C][C]0.6325[/C][C]0.264517[/C][/ROW]
[ROW][C]11[/C][C]-0.053186[/C][C]-0.4513[/C][C]0.326566[/C][/ROW]
[ROW][C]12[/C][C]0.198314[/C][C]1.6827[/C][C]0.048378[/C][/ROW]
[ROW][C]13[/C][C]-0.024561[/C][C]-0.2084[/C][C]0.417751[/C][/ROW]
[ROW][C]14[/C][C]-0.0989[/C][C]-0.8392[/C][C]0.202068[/C][/ROW]
[ROW][C]15[/C][C]0.004132[/C][C]0.0351[/C][C]0.486066[/C][/ROW]
[ROW][C]16[/C][C]-0.069472[/C][C]-0.5895[/C][C]0.278688[/C][/ROW]
[ROW][C]17[/C][C]-0.134913[/C][C]-1.1448[/C][C]0.128046[/C][/ROW]
[ROW][C]18[/C][C]0.144621[/C][C]1.2271[/C][C]0.111882[/C][/ROW]
[ROW][C]19[/C][C]-0.05042[/C][C]-0.4278[/C][C]0.335025[/C][/ROW]
[ROW][C]20[/C][C]-0.081471[/C][C]-0.6913[/C][C]0.245798[/C][/ROW]
[ROW][C]21[/C][C]-0.047287[/C][C]-0.4012[/C][C]0.344715[/C][/ROW]
[ROW][C]22[/C][C]-0.03284[/C][C]-0.2787[/C][C]0.390652[/C][/ROW]
[ROW][C]23[/C][C]-0.101159[/C][C]-0.8584[/C][C]0.196771[/C][/ROW]
[ROW][C]24[/C][C]0.139435[/C][C]1.1831[/C][C]0.120321[/C][/ROW]
[ROW][C]25[/C][C]0.074128[/C][C]0.629[/C][C]0.265671[/C][/ROW]
[ROW][C]26[/C][C]-0.13115[/C][C]-1.1128[/C][C]0.134739[/C][/ROW]
[ROW][C]27[/C][C]-0.003496[/C][C]-0.0297[/C][C]0.488209[/C][/ROW]
[ROW][C]28[/C][C]-0.05395[/C][C]-0.4578[/C][C]0.324245[/C][/ROW]
[ROW][C]29[/C][C]-0.056899[/C][C]-0.4828[/C][C]0.315349[/C][/ROW]
[ROW][C]30[/C][C]0.033086[/C][C]0.2807[/C][C]0.389857[/C][/ROW]
[ROW][C]31[/C][C]0.069946[/C][C]0.5935[/C][C]0.277349[/C][/ROW]
[ROW][C]32[/C][C]-0.098466[/C][C]-0.8355[/C][C]0.203098[/C][/ROW]
[ROW][C]33[/C][C]-0.001054[/C][C]-0.0089[/C][C]0.496445[/C][/ROW]
[ROW][C]34[/C][C]-0.028224[/C][C]-0.2395[/C][C]0.405704[/C][/ROW]
[ROW][C]35[/C][C]-0.015517[/C][C]-0.1317[/C][C]0.447808[/C][/ROW]
[ROW][C]36[/C][C]0.035929[/C][C]0.3049[/C][C]0.380672[/C][/ROW]
[ROW][C]37[/C][C]0.060077[/C][C]0.5098[/C][C]0.305885[/C][/ROW]
[ROW][C]38[/C][C]-0.008308[/C][C]-0.0705[/C][C]0.471998[/C][/ROW]
[ROW][C]39[/C][C]0.126706[/C][C]1.0751[/C][C]0.142951[/C][/ROW]
[ROW][C]40[/C][C]-0.041639[/C][C]-0.3533[/C][C]0.362442[/C][/ROW]
[ROW][C]41[/C][C]-0.063925[/C][C]-0.5424[/C][C]0.294603[/C][/ROW]
[ROW][C]42[/C][C]0.064465[/C][C]0.547[/C][C]0.293033[/C][/ROW]
[ROW][C]43[/C][C]0.188975[/C][C]1.6035[/C][C]0.056601[/C][/ROW]
[ROW][C]44[/C][C]-0.090972[/C][C]-0.7719[/C][C]0.221343[/C][/ROW]
[ROW][C]45[/C][C]0.032801[/C][C]0.2783[/C][C]0.390779[/C][/ROW]
[ROW][C]46[/C][C]-0.082017[/C][C]-0.6959[/C][C]0.244353[/C][/ROW]
[ROW][C]47[/C][C]-0.011904[/C][C]-0.101[/C][C]0.459912[/C][/ROW]
[ROW][C]48[/C][C]-0.004951[/C][C]-0.042[/C][C]0.483303[/C][/ROW]
[/TABLE]
Source: https://freestatistics.org/blog/index.php?pk=243587&T=1

Globally Unique Identifier (entire table): ba.freestatistics.org/blog/index.php?pk=243587&T=1

As an alternative you can also use a QR Code:  

The GUIDs for individual cells are displayed in the table below:

Autocorrelation Function
Time lag kACF(k)T-STATP-value
1-0.010978-0.09320.46302
2-0.066116-0.5610.288266
3-0.106065-0.90.185562
40.0828760.70320.242091
5-0.131367-1.11470.134345
60.3377832.86620.002722
7-0.019375-0.16440.434937
8-0.082542-0.70040.242971
9-0.012428-0.10550.458154
100.0745460.63250.264517
11-0.053186-0.45130.326566
120.1983141.68270.048378
13-0.024561-0.20840.417751
14-0.0989-0.83920.202068
150.0041320.03510.486066
16-0.069472-0.58950.278688
17-0.134913-1.14480.128046
180.1446211.22710.111882
19-0.05042-0.42780.335025
20-0.081471-0.69130.245798
21-0.047287-0.40120.344715
22-0.03284-0.27870.390652
23-0.101159-0.85840.196771
240.1394351.18310.120321
250.0741280.6290.265671
26-0.13115-1.11280.134739
27-0.003496-0.02970.488209
28-0.05395-0.45780.324245
29-0.056899-0.48280.315349
300.0330860.28070.389857
310.0699460.59350.277349
32-0.098466-0.83550.203098
33-0.001054-0.00890.496445
34-0.028224-0.23950.405704
35-0.015517-0.13170.447808
360.0359290.30490.380672
370.0600770.50980.305885
38-0.008308-0.07050.471998
390.1267061.07510.142951
40-0.041639-0.35330.362442
41-0.063925-0.54240.294603
420.0644650.5470.293033
430.1889751.60350.056601
44-0.090972-0.77190.221343
450.0328010.27830.390779
46-0.082017-0.69590.244353
47-0.011904-0.1010.459912
48-0.004951-0.0420.483303


Partial Autocorrelation Function
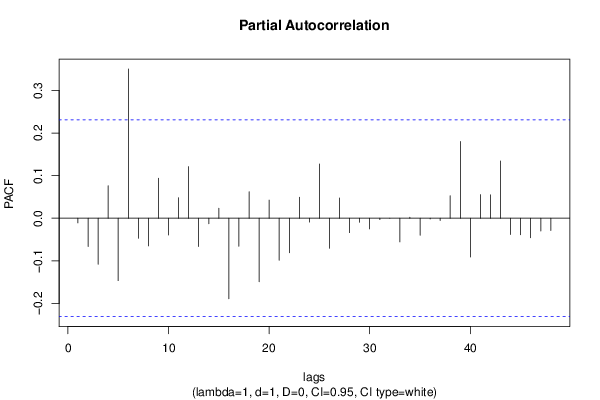
Time lag kPACF(k)T-STATP-value
1-0.010978-0.09320.46302
2-0.066244-0.56210.287896
3-0.108053-0.91690.181137
40.0764590.64880.259273
5-0.146517-1.24320.108906
60.3504172.97340.002002
7-0.046917-0.39810.345865
8-0.064916-0.55080.291728
90.0937990.79590.21435
10-0.03934-0.33380.369748
110.0483180.410.341515
120.1212161.02850.153568
13-0.066547-0.56470.287028
14-0.013037-0.11060.456112
150.0233650.19830.421702
16-0.189167-1.60510.056421
17-0.065884-0.5590.288934
180.0622540.52820.299477
19-0.149251-1.26640.10472
200.04260.36150.359402
21-0.098717-0.83760.202503
22-0.081049-0.68770.246918
230.0492160.41760.338738
24-0.009052-0.07680.469495
250.1272961.08010.141841
26-0.07062-0.59920.275449
270.0473630.40190.344479
28-0.033723-0.28620.387792
29-0.009469-0.08030.468091
30-0.024948-0.21170.416474
31-0.003262-0.02770.488999
32-0.000203-0.00170.499315
33-0.055437-0.47040.319747
340.0025040.02120.491553
35-0.039844-0.33810.368142
36-0.001661-0.01410.494397
37-0.005159-0.04380.482604
380.0528550.44850.327572
390.1802381.52940.065277
40-0.090971-0.77190.221346
410.0554410.47040.319735
420.0549530.46630.321207
430.1343031.13960.129115
44-0.0381-0.32330.373705
45-0.038682-0.32820.371846
46-0.045703-0.38780.349654
47-0.029906-0.25380.400202
48-0.028635-0.2430.404358

\begin{tabular}{lllllllll}
\hline
Partial Autocorrelation Function \tabularnewline
Time lag k & PACF(k) & T-STAT & P-value \tabularnewline
1 & -0.010978 & -0.0932 & 0.46302 \tabularnewline
2 & -0.066244 & -0.5621 & 0.287896 \tabularnewline
3 & -0.108053 & -0.9169 & 0.181137 \tabularnewline
4 & 0.076459 & 0.6488 & 0.259273 \tabularnewline
5 & -0.146517 & -1.2432 & 0.108906 \tabularnewline
6 & 0.350417 & 2.9734 & 0.002002 \tabularnewline
7 & -0.046917 & -0.3981 & 0.345865 \tabularnewline
8 & -0.064916 & -0.5508 & 0.291728 \tabularnewline
9 & 0.093799 & 0.7959 & 0.21435 \tabularnewline
10 & -0.03934 & -0.3338 & 0.369748 \tabularnewline
11 & 0.048318 & 0.41 & 0.341515 \tabularnewline
12 & 0.121216 & 1.0285 & 0.153568 \tabularnewline
13 & -0.066547 & -0.5647 & 0.287028 \tabularnewline
14 & -0.013037 & -0.1106 & 0.456112 \tabularnewline
15 & 0.023365 & 0.1983 & 0.421702 \tabularnewline
16 & -0.189167 & -1.6051 & 0.056421 \tabularnewline
17 & -0.065884 & -0.559 & 0.288934 \tabularnewline
18 & 0.062254 & 0.5282 & 0.299477 \tabularnewline
19 & -0.149251 & -1.2664 & 0.10472 \tabularnewline
20 & 0.0426 & 0.3615 & 0.359402 \tabularnewline
21 & -0.098717 & -0.8376 & 0.202503 \tabularnewline
22 & -0.081049 & -0.6877 & 0.246918 \tabularnewline
23 & 0.049216 & 0.4176 & 0.338738 \tabularnewline
24 & -0.009052 & -0.0768 & 0.469495 \tabularnewline
25 & 0.127296 & 1.0801 & 0.141841 \tabularnewline
26 & -0.07062 & -0.5992 & 0.275449 \tabularnewline
27 & 0.047363 & 0.4019 & 0.344479 \tabularnewline
28 & -0.033723 & -0.2862 & 0.387792 \tabularnewline
29 & -0.009469 & -0.0803 & 0.468091 \tabularnewline
30 & -0.024948 & -0.2117 & 0.416474 \tabularnewline
31 & -0.003262 & -0.0277 & 0.488999 \tabularnewline
32 & -0.000203 & -0.0017 & 0.499315 \tabularnewline
33 & -0.055437 & -0.4704 & 0.319747 \tabularnewline
34 & 0.002504 & 0.0212 & 0.491553 \tabularnewline
35 & -0.039844 & -0.3381 & 0.368142 \tabularnewline
36 & -0.001661 & -0.0141 & 0.494397 \tabularnewline
37 & -0.005159 & -0.0438 & 0.482604 \tabularnewline
38 & 0.052855 & 0.4485 & 0.327572 \tabularnewline
39 & 0.180238 & 1.5294 & 0.065277 \tabularnewline
40 & -0.090971 & -0.7719 & 0.221346 \tabularnewline
41 & 0.055441 & 0.4704 & 0.319735 \tabularnewline
42 & 0.054953 & 0.4663 & 0.321207 \tabularnewline
43 & 0.134303 & 1.1396 & 0.129115 \tabularnewline
44 & -0.0381 & -0.3233 & 0.373705 \tabularnewline
45 & -0.038682 & -0.3282 & 0.371846 \tabularnewline
46 & -0.045703 & -0.3878 & 0.349654 \tabularnewline
47 & -0.029906 & -0.2538 & 0.400202 \tabularnewline
48 & -0.028635 & -0.243 & 0.404358 \tabularnewline
\hline
\end{tabular}
%Source: https://freestatistics.org/blog/index.php?pk=243587&T=2

[TABLE]
[ROW][C]Partial Autocorrelation Function[/C][/ROW]
[ROW][C]Time lag k[/C][C]PACF(k)[/C][C]T-STAT[/C][C]P-value[/C][/ROW]
[ROW][C]1[/C][C]-0.010978[/C][C]-0.0932[/C][C]0.46302[/C][/ROW]
[ROW][C]2[/C][C]-0.066244[/C][C]-0.5621[/C][C]0.287896[/C][/ROW]
[ROW][C]3[/C][C]-0.108053[/C][C]-0.9169[/C][C]0.181137[/C][/ROW]
[ROW][C]4[/C][C]0.076459[/C][C]0.6488[/C][C]0.259273[/C][/ROW]
[ROW][C]5[/C][C]-0.146517[/C][C]-1.2432[/C][C]0.108906[/C][/ROW]
[ROW][C]6[/C][C]0.350417[/C][C]2.9734[/C][C]0.002002[/C][/ROW]
[ROW][C]7[/C][C]-0.046917[/C][C]-0.3981[/C][C]0.345865[/C][/ROW]
[ROW][C]8[/C][C]-0.064916[/C][C]-0.5508[/C][C]0.291728[/C][/ROW]
[ROW][C]9[/C][C]0.093799[/C][C]0.7959[/C][C]0.21435[/C][/ROW]
[ROW][C]10[/C][C]-0.03934[/C][C]-0.3338[/C][C]0.369748[/C][/ROW]
[ROW][C]11[/C][C]0.048318[/C][C]0.41[/C][C]0.341515[/C][/ROW]
[ROW][C]12[/C][C]0.121216[/C][C]1.0285[/C][C]0.153568[/C][/ROW]
[ROW][C]13[/C][C]-0.066547[/C][C]-0.5647[/C][C]0.287028[/C][/ROW]
[ROW][C]14[/C][C]-0.013037[/C][C]-0.1106[/C][C]0.456112[/C][/ROW]
[ROW][C]15[/C][C]0.023365[/C][C]0.1983[/C][C]0.421702[/C][/ROW]
[ROW][C]16[/C][C]-0.189167[/C][C]-1.6051[/C][C]0.056421[/C][/ROW]
[ROW][C]17[/C][C]-0.065884[/C][C]-0.559[/C][C]0.288934[/C][/ROW]
[ROW][C]18[/C][C]0.062254[/C][C]0.5282[/C][C]0.299477[/C][/ROW]
[ROW][C]19[/C][C]-0.149251[/C][C]-1.2664[/C][C]0.10472[/C][/ROW]
[ROW][C]20[/C][C]0.0426[/C][C]0.3615[/C][C]0.359402[/C][/ROW]
[ROW][C]21[/C][C]-0.098717[/C][C]-0.8376[/C][C]0.202503[/C][/ROW]
[ROW][C]22[/C][C]-0.081049[/C][C]-0.6877[/C][C]0.246918[/C][/ROW]
[ROW][C]23[/C][C]0.049216[/C][C]0.4176[/C][C]0.338738[/C][/ROW]
[ROW][C]24[/C][C]-0.009052[/C][C]-0.0768[/C][C]0.469495[/C][/ROW]
[ROW][C]25[/C][C]0.127296[/C][C]1.0801[/C][C]0.141841[/C][/ROW]
[ROW][C]26[/C][C]-0.07062[/C][C]-0.5992[/C][C]0.275449[/C][/ROW]
[ROW][C]27[/C][C]0.047363[/C][C]0.4019[/C][C]0.344479[/C][/ROW]
[ROW][C]28[/C][C]-0.033723[/C][C]-0.2862[/C][C]0.387792[/C][/ROW]
[ROW][C]29[/C][C]-0.009469[/C][C]-0.0803[/C][C]0.468091[/C][/ROW]
[ROW][C]30[/C][C]-0.024948[/C][C]-0.2117[/C][C]0.416474[/C][/ROW]
[ROW][C]31[/C][C]-0.003262[/C][C]-0.0277[/C][C]0.488999[/C][/ROW]
[ROW][C]32[/C][C]-0.000203[/C][C]-0.0017[/C][C]0.499315[/C][/ROW]
[ROW][C]33[/C][C]-0.055437[/C][C]-0.4704[/C][C]0.319747[/C][/ROW]
[ROW][C]34[/C][C]0.002504[/C][C]0.0212[/C][C]0.491553[/C][/ROW]
[ROW][C]35[/C][C]-0.039844[/C][C]-0.3381[/C][C]0.368142[/C][/ROW]
[ROW][C]36[/C][C]-0.001661[/C][C]-0.0141[/C][C]0.494397[/C][/ROW]
[ROW][C]37[/C][C]-0.005159[/C][C]-0.0438[/C][C]0.482604[/C][/ROW]
[ROW][C]38[/C][C]0.052855[/C][C]0.4485[/C][C]0.327572[/C][/ROW]
[ROW][C]39[/C][C]0.180238[/C][C]1.5294[/C][C]0.065277[/C][/ROW]
[ROW][C]40[/C][C]-0.090971[/C][C]-0.7719[/C][C]0.221346[/C][/ROW]
[ROW][C]41[/C][C]0.055441[/C][C]0.4704[/C][C]0.319735[/C][/ROW]
[ROW][C]42[/C][C]0.054953[/C][C]0.4663[/C][C]0.321207[/C][/ROW]
[ROW][C]43[/C][C]0.134303[/C][C]1.1396[/C][C]0.129115[/C][/ROW]
[ROW][C]44[/C][C]-0.0381[/C][C]-0.3233[/C][C]0.373705[/C][/ROW]
[ROW][C]45[/C][C]-0.038682[/C][C]-0.3282[/C][C]0.371846[/C][/ROW]
[ROW][C]46[/C][C]-0.045703[/C][C]-0.3878[/C][C]0.349654[/C][/ROW]
[ROW][C]47[/C][C]-0.029906[/C][C]-0.2538[/C][C]0.400202[/C][/ROW]
[ROW][C]48[/C][C]-0.028635[/C][C]-0.243[/C][C]0.404358[/C][/ROW]
[/TABLE]
Source: https://freestatistics.org/blog/index.php?pk=243587&T=2

Globally Unique Identifier (entire table): ba.freestatistics.org/blog/index.php?pk=243587&T=2

As an alternative you can also use a QR Code:  

The GUIDs for individual cells are displayed in the table below:

Partial Autocorrelation Function
Time lag kPACF(k)T-STATP-value
1-0.010978-0.09320.46302
2-0.066244-0.56210.287896
3-0.108053-0.91690.181137
40.0764590.64880.259273
5-0.146517-1.24320.108906
60.3504172.97340.002002
7-0.046917-0.39810.345865
8-0.064916-0.55080.291728
90.0937990.79590.21435
10-0.03934-0.33380.369748
110.0483180.410.341515
120.1212161.02850.153568
13-0.066547-0.56470.287028
14-0.013037-0.11060.456112
150.0233650.19830.421702
16-0.189167-1.60510.056421
17-0.065884-0.5590.288934
180.0622540.52820.299477
19-0.149251-1.26640.10472
200.04260.36150.359402
21-0.098717-0.83760.202503
22-0.081049-0.68770.246918
230.0492160.41760.338738
24-0.009052-0.07680.469495
250.1272961.08010.141841
26-0.07062-0.59920.275449
270.0473630.40190.344479
28-0.033723-0.28620.387792
29-0.009469-0.08030.468091
30-0.024948-0.21170.416474
31-0.003262-0.02770.488999
32-0.000203-0.00170.499315
33-0.055437-0.47040.319747
340.0025040.02120.491553
35-0.039844-0.33810.368142
36-0.001661-0.01410.494397
37-0.005159-0.04380.482604
380.0528550.44850.327572
390.1802381.52940.065277
40-0.090971-0.77190.221346
410.0554410.47040.319735
420.0549530.46630.321207
430.1343031.13960.129115
44-0.0381-0.32330.373705
45-0.038682-0.32820.371846
46-0.045703-0.38780.349654
47-0.029906-0.25380.400202
48-0.028635-0.2430.404358


Parameters (Session):
par1 = 48 ; par2 = 1 ; par3 = 1 ; par4 = 0 ; par5 = 12 ; par6 = White Noise ; par7 = 0.95 ;
Parameters (R input):
par1 = 48 ; par2 = 1 ; par3 = 1 ; par4 = 0 ; par5 = 12 ; par6 = White Noise ; par7 = 0.95 ; par8 = ;
R code (references can be found in the software module):
par8 <- ''
par7 <- '0.95'
par6 <- 'White Noise'
par5 <- '12'
par4 <- '0'
par3 <- '0'
par2 <- '1'
par1 <- '48'
if (par1 == 'Default') {
par1 = 10*log10(length(x))
} else {
par1 <- as.numeric(par1)
}
par2 <- as.numeric(par2)
par3 <- as.numeric(par3)
par4 <- as.numeric(par4)
par5 <- as.numeric(par5)
if (par6 == 'White Noise') par6 <- 'white' else par6 <- 'ma'
par7 <- as.numeric(par7)
if (par8 != '') par8 <- as.numeric(par8)
ox <- x
if (par8 == '') {
if (par2 == 0) {
x <- log(x)
} else {
x <- (x ^ par2 - 1) / par2
}
} else {
x <- log(x,base=par8)
}
if (par3 > 0) x <- diff(x,lag=1,difference=par3)
if (par4 > 0) x <- diff(x,lag=par5,difference=par4)
bitmap(file='picts.png')
op <- par(mfrow=c(2,1))
plot(ox,type='l',main='Original Time Series',xlab='time',ylab='value')
if (par8=='') {
mytitle <- paste('Working Time Series (lambda=',par2,', d=',par3,', D=',par4,')',sep='')
mysub <- paste('(lambda=',par2,', d=',par3,', D=',par4,', CI=', par7, ', CI type=',par6,')',sep='')
} else {
mytitle <- paste('Working Time Series (base=',par8,', d=',par3,', D=',par4,')',sep='')
mysub <- paste('(base=',par8,', d=',par3,', D=',par4,', CI=', par7, ', CI type=',par6,')',sep='')
}
plot(x,type='l', main=mytitle,xlab='time',ylab='value')
par(op)
dev.off()
bitmap(file='pic1.png')
racf <- acf(x, par1, main='Autocorrelation', xlab='time lag', ylab='ACF', ci.type=par6, ci=par7, sub=mysub)
dev.off()
bitmap(file='pic2.png')
rpacf <- pacf(x,par1,main='Partial Autocorrelation',xlab='lags',ylab='PACF',sub=mysub)
dev.off()
(myacf <- c(racf$acf))
(mypacf <- c(rpacf$acf))
lengthx <- length(x)
sqrtn <- sqrt(lengthx)
load(file='createtable')
a<-table.start()
a<-table.row.start(a)
a<-table.element(a,'Autocorrelation Function',4,TRUE)
a<-table.row.end(a)
a<-table.row.start(a)
a<-table.element(a,'Time lag k',header=TRUE)
a<-table.element(a,hyperlink('basics.htm','ACF(k)','click here for more information about the Autocorrelation Function'),header=TRUE)
a<-table.element(a,'T-STAT',header=TRUE)
a<-table.element(a,'P-value',header=TRUE)
a<-table.row.end(a)
for (i in 2:(par1+1)) {
a<-table.row.start(a)
a<-table.element(a,i-1,header=TRUE)
a<-table.element(a,round(myacf[i],6))
mytstat <- myacf[i]*sqrtn
a<-table.element(a,round(mytstat,4))
a<-table.element(a,round(1-pt(abs(mytstat),lengthx),6))
a<-table.row.end(a)
}
a<-table.end(a)
table.save(a,file='mytable.tab')
a<-table.start()
a<-table.row.start(a)
a<-table.element(a,'Partial Autocorrelation Function',4,TRUE)
a<-table.row.end(a)
a<-table.row.start(a)
a<-table.element(a,'Time lag k',header=TRUE)
a<-table.element(a,hyperlink('basics.htm','PACF(k)','click here for more information about the Partial Autocorrelation Function'),header=TRUE)
a<-table.element(a,'T-STAT',header=TRUE)
a<-table.element(a,'P-value',header=TRUE)
a<-table.row.end(a)
for (i in 1:par1) {
a<-table.row.start(a)
a<-table.element(a,i,header=TRUE)
a<-table.element(a,round(mypacf[i],6))
mytstat <- mypacf[i]*sqrtn
a<-table.element(a,round(mytstat,4))
a<-table.element(a,round(1-pt(abs(mytstat),lengthx),6))
a<-table.row.end(a)
}
a<-table.end(a)
table.save(a,file='mytable1.tab')