Free Statistics

of Irreproducible Research!

Author's title

Author*Unverified author*
R Software Modulerwasp_autocorrelation.wasp
Title produced by software(Partial) Autocorrelation Function
Date of computationSun, 19 Oct 2014 12:28:43 +0100
Cite this page as followsStatistical Computations at FreeStatistics.org, Office for Research Development and Education, URL https://freestatistics.org/blog/index.php?v=date/2014/Oct/19/t1413718164z0lhbglcsx1npe8.htm/, Retrieved Sat, 11 May 2024 09:42:24 +0000
Statistical Computations at FreeStatistics.org, Office for Research Development and Education, URL https://freestatistics.org/blog/index.php?pk=243585, Retrieved Sat, 11 May 2024 09:42:24 +0000
QR Codes:

Original text written by user:
IsPrivate?No (this computation is public)
User-defined keywords
Estimated Impact135
Family? (F = Feedback message, R = changed R code, M = changed R Module, P = changed Parameters, D = changed Data)
-     [Univariate Data Series] [] [2014-09-17 11:31:44] [94f95ef037a5ad1df99581667eb46a7c]
- R P   [Univariate Data Series] [] [2014-09-18 13:29:36] [94f95ef037a5ad1df99581667eb46a7c]
- RMP       [(Partial) Autocorrelation Function] [] [2014-10-19 11:28:43] [1b1e43390f81e2233427cd22b8161931] [Current]
Feedback Forum

Post a new message
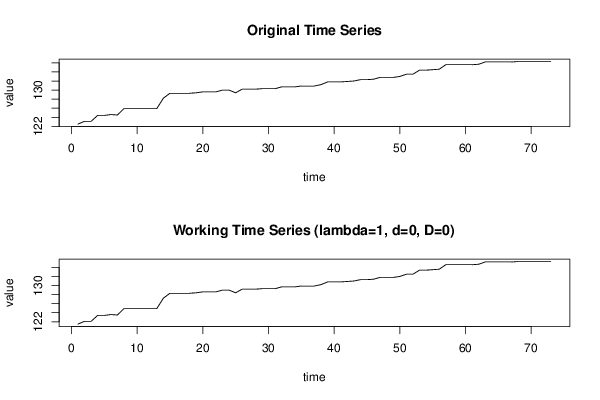
Dataseries X:
122.5
123.1
123.1
124.4
124.4
124.6
124.5
125.9
125.9
125.9
125.9
125.9
125.9
128.2
129.3
129.3
129.3
129.3
129.4
129.6
129.6
129.6
130
130
129.4
130.2
130.2
130.2
130.3
130.3
130.3
130.7
130.7
130.7
130.9
130.9
130.9
131.2
131.8
131.8
131.8
131.9
132
132.3
132.3
132.4
132.8
132.8
132.8
133
133.5
133.5
134.4
134.4
134.5
134.6
135.6
135.6
135.6
135.6
135.6
135.7
136.2
136.2
136.2
136.2
136.2
136.3
136.3
136.3
136.3
136.3
136.3


Summary of computational transaction
Raw Inputview raw input (R code)
Raw Outputview raw output of R engine
Computing time1 seconds
R Server'Herman Ole Andreas Wold' @ wold.wessa.net

\begin{tabular}{lllllllll}
\hline
Summary of computational transaction \tabularnewline
Raw Input & view raw input (R code)  \tabularnewline
Raw Output & view raw output of R engine  \tabularnewline
Computing time & 1 seconds \tabularnewline
R Server & 'Herman Ole Andreas Wold' @ wold.wessa.net \tabularnewline
\hline
\end{tabular}
%Source: https://freestatistics.org/blog/index.php?pk=243585&T=0

[TABLE]
[ROW][C]Summary of computational transaction[/C][/ROW]
[ROW][C]Raw Input[/C][C]view raw input (R code) [/C][/ROW]
[ROW][C]Raw Output[/C][C]view raw output of R engine [/C][/ROW]
[ROW][C]Computing time[/C][C]1 seconds[/C][/ROW]
[ROW][C]R Server[/C][C]'Herman Ole Andreas Wold' @ wold.wessa.net[/C][/ROW]
[/TABLE]
Source: https://freestatistics.org/blog/index.php?pk=243585&T=0

Globally Unique Identifier (entire table): ba.freestatistics.org/blog/index.php?pk=243585&T=0

As an alternative you can also use a QR Code:  

The GUIDs for individual cells are displayed in the table below:

Summary of computational transaction
Raw Inputview raw input (R code)
Raw Outputview raw output of R engine
Computing time1 seconds
R Server'Herman Ole Andreas Wold' @ wold.wessa.net


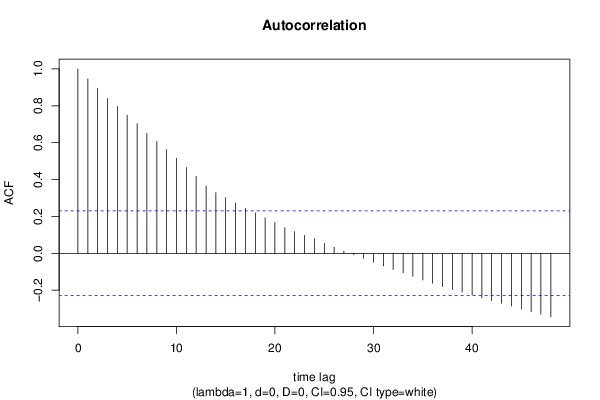
Autocorrelation Function
Time lag kACF(k)T-STATP-value
10.9455188.07850
20.8936397.63530
30.84017.17780
40.7961146.8020
50.7488996.39860
60.7025716.00280
70.6496855.55090
80.6063055.18031e-06
90.5617684.79974e-06
100.5152254.40211.8e-05
110.4656323.97848.1e-05
120.4169063.5620.000326
130.3642063.11180.001327
140.3286912.80830.003192
150.3016462.57730.005989
160.2729122.33180.011238
170.2433112.07890.020573
180.2185051.86690.032965
190.1917771.63850.052806
200.1662251.42020.079899
210.1400761.19680.117627
220.1173411.00260.159692
230.0968540.82750.205319
240.0785970.67150.252
250.0533720.4560.32487
260.0324560.27730.391166
270.0117080.10.460296
28-0.008415-0.07190.471441
29-0.027941-0.23870.405994
30-0.048157-0.41140.340974
31-0.068662-0.58660.279625
32-0.087535-0.74790.228463
33-0.106081-0.90640.183865
34-0.125942-1.07610.142724
35-0.145179-1.24040.109398
36-0.162633-1.38950.084446
37-0.180312-1.54060.063871
38-0.197468-1.68720.04792
39-0.210799-1.80110.037911
40-0.225791-1.92920.028799
41-0.241473-2.06310.021328
42-0.256792-2.1940.015708
43-0.27128-2.31780.011633
44-0.286645-2.44910.008361
45-0.302103-2.58120.005927
46-0.317804-2.71530.00413
47-0.330416-2.82310.003063
48-0.344037-2.93950.0022

\begin{tabular}{lllllllll}
\hline
Autocorrelation Function \tabularnewline
Time lag k & ACF(k) & T-STAT & P-value \tabularnewline
1 & 0.945518 & 8.0785 & 0 \tabularnewline
2 & 0.893639 & 7.6353 & 0 \tabularnewline
3 & 0.8401 & 7.1778 & 0 \tabularnewline
4 & 0.796114 & 6.802 & 0 \tabularnewline
5 & 0.748899 & 6.3986 & 0 \tabularnewline
6 & 0.702571 & 6.0028 & 0 \tabularnewline
7 & 0.649685 & 5.5509 & 0 \tabularnewline
8 & 0.606305 & 5.1803 & 1e-06 \tabularnewline
9 & 0.561768 & 4.7997 & 4e-06 \tabularnewline
10 & 0.515225 & 4.4021 & 1.8e-05 \tabularnewline
11 & 0.465632 & 3.9784 & 8.1e-05 \tabularnewline
12 & 0.416906 & 3.562 & 0.000326 \tabularnewline
13 & 0.364206 & 3.1118 & 0.001327 \tabularnewline
14 & 0.328691 & 2.8083 & 0.003192 \tabularnewline
15 & 0.301646 & 2.5773 & 0.005989 \tabularnewline
16 & 0.272912 & 2.3318 & 0.011238 \tabularnewline
17 & 0.243311 & 2.0789 & 0.020573 \tabularnewline
18 & 0.218505 & 1.8669 & 0.032965 \tabularnewline
19 & 0.191777 & 1.6385 & 0.052806 \tabularnewline
20 & 0.166225 & 1.4202 & 0.079899 \tabularnewline
21 & 0.140076 & 1.1968 & 0.117627 \tabularnewline
22 & 0.117341 & 1.0026 & 0.159692 \tabularnewline
23 & 0.096854 & 0.8275 & 0.205319 \tabularnewline
24 & 0.078597 & 0.6715 & 0.252 \tabularnewline
25 & 0.053372 & 0.456 & 0.32487 \tabularnewline
26 & 0.032456 & 0.2773 & 0.391166 \tabularnewline
27 & 0.011708 & 0.1 & 0.460296 \tabularnewline
28 & -0.008415 & -0.0719 & 0.471441 \tabularnewline
29 & -0.027941 & -0.2387 & 0.405994 \tabularnewline
30 & -0.048157 & -0.4114 & 0.340974 \tabularnewline
31 & -0.068662 & -0.5866 & 0.279625 \tabularnewline
32 & -0.087535 & -0.7479 & 0.228463 \tabularnewline
33 & -0.106081 & -0.9064 & 0.183865 \tabularnewline
34 & -0.125942 & -1.0761 & 0.142724 \tabularnewline
35 & -0.145179 & -1.2404 & 0.109398 \tabularnewline
36 & -0.162633 & -1.3895 & 0.084446 \tabularnewline
37 & -0.180312 & -1.5406 & 0.063871 \tabularnewline
38 & -0.197468 & -1.6872 & 0.04792 \tabularnewline
39 & -0.210799 & -1.8011 & 0.037911 \tabularnewline
40 & -0.225791 & -1.9292 & 0.028799 \tabularnewline
41 & -0.241473 & -2.0631 & 0.021328 \tabularnewline
42 & -0.256792 & -2.194 & 0.015708 \tabularnewline
43 & -0.27128 & -2.3178 & 0.011633 \tabularnewline
44 & -0.286645 & -2.4491 & 0.008361 \tabularnewline
45 & -0.302103 & -2.5812 & 0.005927 \tabularnewline
46 & -0.317804 & -2.7153 & 0.00413 \tabularnewline
47 & -0.330416 & -2.8231 & 0.003063 \tabularnewline
48 & -0.344037 & -2.9395 & 0.0022 \tabularnewline
\hline
\end{tabular}
%Source: https://freestatistics.org/blog/index.php?pk=243585&T=1

[TABLE]
[ROW][C]Autocorrelation Function[/C][/ROW]
[ROW][C]Time lag k[/C][C]ACF(k)[/C][C]T-STAT[/C][C]P-value[/C][/ROW]
[ROW][C]1[/C][C]0.945518[/C][C]8.0785[/C][C]0[/C][/ROW]
[ROW][C]2[/C][C]0.893639[/C][C]7.6353[/C][C]0[/C][/ROW]
[ROW][C]3[/C][C]0.8401[/C][C]7.1778[/C][C]0[/C][/ROW]
[ROW][C]4[/C][C]0.796114[/C][C]6.802[/C][C]0[/C][/ROW]
[ROW][C]5[/C][C]0.748899[/C][C]6.3986[/C][C]0[/C][/ROW]
[ROW][C]6[/C][C]0.702571[/C][C]6.0028[/C][C]0[/C][/ROW]
[ROW][C]7[/C][C]0.649685[/C][C]5.5509[/C][C]0[/C][/ROW]
[ROW][C]8[/C][C]0.606305[/C][C]5.1803[/C][C]1e-06[/C][/ROW]
[ROW][C]9[/C][C]0.561768[/C][C]4.7997[/C][C]4e-06[/C][/ROW]
[ROW][C]10[/C][C]0.515225[/C][C]4.4021[/C][C]1.8e-05[/C][/ROW]
[ROW][C]11[/C][C]0.465632[/C][C]3.9784[/C][C]8.1e-05[/C][/ROW]
[ROW][C]12[/C][C]0.416906[/C][C]3.562[/C][C]0.000326[/C][/ROW]
[ROW][C]13[/C][C]0.364206[/C][C]3.1118[/C][C]0.001327[/C][/ROW]
[ROW][C]14[/C][C]0.328691[/C][C]2.8083[/C][C]0.003192[/C][/ROW]
[ROW][C]15[/C][C]0.301646[/C][C]2.5773[/C][C]0.005989[/C][/ROW]
[ROW][C]16[/C][C]0.272912[/C][C]2.3318[/C][C]0.011238[/C][/ROW]
[ROW][C]17[/C][C]0.243311[/C][C]2.0789[/C][C]0.020573[/C][/ROW]
[ROW][C]18[/C][C]0.218505[/C][C]1.8669[/C][C]0.032965[/C][/ROW]
[ROW][C]19[/C][C]0.191777[/C][C]1.6385[/C][C]0.052806[/C][/ROW]
[ROW][C]20[/C][C]0.166225[/C][C]1.4202[/C][C]0.079899[/C][/ROW]
[ROW][C]21[/C][C]0.140076[/C][C]1.1968[/C][C]0.117627[/C][/ROW]
[ROW][C]22[/C][C]0.117341[/C][C]1.0026[/C][C]0.159692[/C][/ROW]
[ROW][C]23[/C][C]0.096854[/C][C]0.8275[/C][C]0.205319[/C][/ROW]
[ROW][C]24[/C][C]0.078597[/C][C]0.6715[/C][C]0.252[/C][/ROW]
[ROW][C]25[/C][C]0.053372[/C][C]0.456[/C][C]0.32487[/C][/ROW]
[ROW][C]26[/C][C]0.032456[/C][C]0.2773[/C][C]0.391166[/C][/ROW]
[ROW][C]27[/C][C]0.011708[/C][C]0.1[/C][C]0.460296[/C][/ROW]
[ROW][C]28[/C][C]-0.008415[/C][C]-0.0719[/C][C]0.471441[/C][/ROW]
[ROW][C]29[/C][C]-0.027941[/C][C]-0.2387[/C][C]0.405994[/C][/ROW]
[ROW][C]30[/C][C]-0.048157[/C][C]-0.4114[/C][C]0.340974[/C][/ROW]
[ROW][C]31[/C][C]-0.068662[/C][C]-0.5866[/C][C]0.279625[/C][/ROW]
[ROW][C]32[/C][C]-0.087535[/C][C]-0.7479[/C][C]0.228463[/C][/ROW]
[ROW][C]33[/C][C]-0.106081[/C][C]-0.9064[/C][C]0.183865[/C][/ROW]
[ROW][C]34[/C][C]-0.125942[/C][C]-1.0761[/C][C]0.142724[/C][/ROW]
[ROW][C]35[/C][C]-0.145179[/C][C]-1.2404[/C][C]0.109398[/C][/ROW]
[ROW][C]36[/C][C]-0.162633[/C][C]-1.3895[/C][C]0.084446[/C][/ROW]
[ROW][C]37[/C][C]-0.180312[/C][C]-1.5406[/C][C]0.063871[/C][/ROW]
[ROW][C]38[/C][C]-0.197468[/C][C]-1.6872[/C][C]0.04792[/C][/ROW]
[ROW][C]39[/C][C]-0.210799[/C][C]-1.8011[/C][C]0.037911[/C][/ROW]
[ROW][C]40[/C][C]-0.225791[/C][C]-1.9292[/C][C]0.028799[/C][/ROW]
[ROW][C]41[/C][C]-0.241473[/C][C]-2.0631[/C][C]0.021328[/C][/ROW]
[ROW][C]42[/C][C]-0.256792[/C][C]-2.194[/C][C]0.015708[/C][/ROW]
[ROW][C]43[/C][C]-0.27128[/C][C]-2.3178[/C][C]0.011633[/C][/ROW]
[ROW][C]44[/C][C]-0.286645[/C][C]-2.4491[/C][C]0.008361[/C][/ROW]
[ROW][C]45[/C][C]-0.302103[/C][C]-2.5812[/C][C]0.005927[/C][/ROW]
[ROW][C]46[/C][C]-0.317804[/C][C]-2.7153[/C][C]0.00413[/C][/ROW]
[ROW][C]47[/C][C]-0.330416[/C][C]-2.8231[/C][C]0.003063[/C][/ROW]
[ROW][C]48[/C][C]-0.344037[/C][C]-2.9395[/C][C]0.0022[/C][/ROW]
[/TABLE]
Source: https://freestatistics.org/blog/index.php?pk=243585&T=1

Globally Unique Identifier (entire table): ba.freestatistics.org/blog/index.php?pk=243585&T=1

As an alternative you can also use a QR Code:  

The GUIDs for individual cells are displayed in the table below:

Autocorrelation Function
Time lag kACF(k)T-STATP-value
10.9455188.07850
20.8936397.63530
30.84017.17780
40.7961146.8020
50.7488996.39860
60.7025716.00280
70.6496855.55090
80.6063055.18031e-06
90.5617684.79974e-06
100.5152254.40211.8e-05
110.4656323.97848.1e-05
120.4169063.5620.000326
130.3642063.11180.001327
140.3286912.80830.003192
150.3016462.57730.005989
160.2729122.33180.011238
170.2433112.07890.020573
180.2185051.86690.032965
190.1917771.63850.052806
200.1662251.42020.079899
210.1400761.19680.117627
220.1173411.00260.159692
230.0968540.82750.205319
240.0785970.67150.252
250.0533720.4560.32487
260.0324560.27730.391166
270.0117080.10.460296
28-0.008415-0.07190.471441
29-0.027941-0.23870.405994
30-0.048157-0.41140.340974
31-0.068662-0.58660.279625
32-0.087535-0.74790.228463
33-0.106081-0.90640.183865
34-0.125942-1.07610.142724
35-0.145179-1.24040.109398
36-0.162633-1.38950.084446
37-0.180312-1.54060.063871
38-0.197468-1.68720.04792
39-0.210799-1.80110.037911
40-0.225791-1.92920.028799
41-0.241473-2.06310.021328
42-0.256792-2.1940.015708
43-0.27128-2.31780.011633
44-0.286645-2.44910.008361
45-0.302103-2.58120.005927
46-0.317804-2.71530.00413
47-0.330416-2.82310.003063
48-0.344037-2.93950.0022


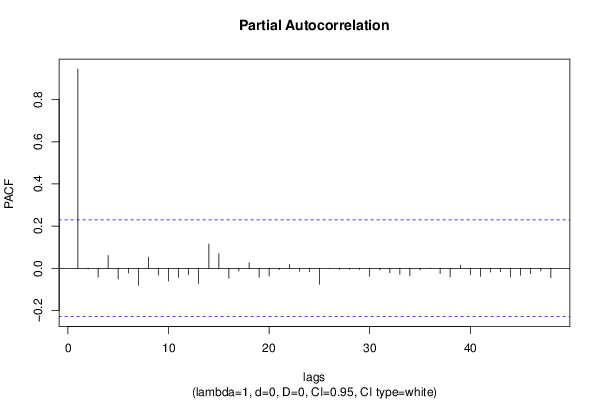
Partial Autocorrelation Function
Time lag kPACF(k)T-STATP-value
10.9455188.07850
2-0.003448-0.02950.48829
3-0.042509-0.36320.358752
40.0604930.51680.303412
5-0.051279-0.43810.331292
6-0.022355-0.1910.424526
7-0.081049-0.69250.245416
80.0520350.44460.328967
9-0.032275-0.27580.391757
10-0.060272-0.5150.304068
11-0.043865-0.37480.354455
12-0.030949-0.26440.396097
13-0.071704-0.61260.271009
140.1154170.98610.163665
150.0694320.59320.277432
16-0.047175-0.40310.344038
17-0.012684-0.10840.456998
180.0262160.2240.411695
19-0.042784-0.36550.357879
20-0.036918-0.31540.376669
21-0.005448-0.04660.481499
220.0185260.15830.437333
23-0.014551-0.12430.450702
24-0.015925-0.13610.446073
25-0.076073-0.650.258878
26-0.002213-0.01890.492482
27-0.006158-0.05260.479093
28-0.004521-0.03860.484648
29-0.005324-0.04550.481921
30-0.038036-0.3250.373065
31-0.007614-0.06510.474155
32-0.02074-0.17720.429919
33-0.027801-0.23750.406454
34-0.035937-0.3070.379842
35-0.007745-0.06620.473709
360.0004520.00390.498464
37-0.025204-0.21530.415051
38-0.040868-0.34920.363981
390.0143430.12250.4514
40-0.030683-0.26220.39697
41-0.039092-0.3340.369668
42-0.017983-0.15360.439156
43-0.016108-0.13760.445457
44-0.040648-0.34730.364685
45-0.032775-0.280.390125
46-0.025935-0.22160.412626
47-0.011771-0.10060.460084
48-0.045295-0.3870.34994

\begin{tabular}{lllllllll}
\hline
Partial Autocorrelation Function \tabularnewline
Time lag k & PACF(k) & T-STAT & P-value \tabularnewline
1 & 0.945518 & 8.0785 & 0 \tabularnewline
2 & -0.003448 & -0.0295 & 0.48829 \tabularnewline
3 & -0.042509 & -0.3632 & 0.358752 \tabularnewline
4 & 0.060493 & 0.5168 & 0.303412 \tabularnewline
5 & -0.051279 & -0.4381 & 0.331292 \tabularnewline
6 & -0.022355 & -0.191 & 0.424526 \tabularnewline
7 & -0.081049 & -0.6925 & 0.245416 \tabularnewline
8 & 0.052035 & 0.4446 & 0.328967 \tabularnewline
9 & -0.032275 & -0.2758 & 0.391757 \tabularnewline
10 & -0.060272 & -0.515 & 0.304068 \tabularnewline
11 & -0.043865 & -0.3748 & 0.354455 \tabularnewline
12 & -0.030949 & -0.2644 & 0.396097 \tabularnewline
13 & -0.071704 & -0.6126 & 0.271009 \tabularnewline
14 & 0.115417 & 0.9861 & 0.163665 \tabularnewline
15 & 0.069432 & 0.5932 & 0.277432 \tabularnewline
16 & -0.047175 & -0.4031 & 0.344038 \tabularnewline
17 & -0.012684 & -0.1084 & 0.456998 \tabularnewline
18 & 0.026216 & 0.224 & 0.411695 \tabularnewline
19 & -0.042784 & -0.3655 & 0.357879 \tabularnewline
20 & -0.036918 & -0.3154 & 0.376669 \tabularnewline
21 & -0.005448 & -0.0466 & 0.481499 \tabularnewline
22 & 0.018526 & 0.1583 & 0.437333 \tabularnewline
23 & -0.014551 & -0.1243 & 0.450702 \tabularnewline
24 & -0.015925 & -0.1361 & 0.446073 \tabularnewline
25 & -0.076073 & -0.65 & 0.258878 \tabularnewline
26 & -0.002213 & -0.0189 & 0.492482 \tabularnewline
27 & -0.006158 & -0.0526 & 0.479093 \tabularnewline
28 & -0.004521 & -0.0386 & 0.484648 \tabularnewline
29 & -0.005324 & -0.0455 & 0.481921 \tabularnewline
30 & -0.038036 & -0.325 & 0.373065 \tabularnewline
31 & -0.007614 & -0.0651 & 0.474155 \tabularnewline
32 & -0.02074 & -0.1772 & 0.429919 \tabularnewline
33 & -0.027801 & -0.2375 & 0.406454 \tabularnewline
34 & -0.035937 & -0.307 & 0.379842 \tabularnewline
35 & -0.007745 & -0.0662 & 0.473709 \tabularnewline
36 & 0.000452 & 0.0039 & 0.498464 \tabularnewline
37 & -0.025204 & -0.2153 & 0.415051 \tabularnewline
38 & -0.040868 & -0.3492 & 0.363981 \tabularnewline
39 & 0.014343 & 0.1225 & 0.4514 \tabularnewline
40 & -0.030683 & -0.2622 & 0.39697 \tabularnewline
41 & -0.039092 & -0.334 & 0.369668 \tabularnewline
42 & -0.017983 & -0.1536 & 0.439156 \tabularnewline
43 & -0.016108 & -0.1376 & 0.445457 \tabularnewline
44 & -0.040648 & -0.3473 & 0.364685 \tabularnewline
45 & -0.032775 & -0.28 & 0.390125 \tabularnewline
46 & -0.025935 & -0.2216 & 0.412626 \tabularnewline
47 & -0.011771 & -0.1006 & 0.460084 \tabularnewline
48 & -0.045295 & -0.387 & 0.34994 \tabularnewline
\hline
\end{tabular}
%Source: https://freestatistics.org/blog/index.php?pk=243585&T=2

[TABLE]
[ROW][C]Partial Autocorrelation Function[/C][/ROW]
[ROW][C]Time lag k[/C][C]PACF(k)[/C][C]T-STAT[/C][C]P-value[/C][/ROW]
[ROW][C]1[/C][C]0.945518[/C][C]8.0785[/C][C]0[/C][/ROW]
[ROW][C]2[/C][C]-0.003448[/C][C]-0.0295[/C][C]0.48829[/C][/ROW]
[ROW][C]3[/C][C]-0.042509[/C][C]-0.3632[/C][C]0.358752[/C][/ROW]
[ROW][C]4[/C][C]0.060493[/C][C]0.5168[/C][C]0.303412[/C][/ROW]
[ROW][C]5[/C][C]-0.051279[/C][C]-0.4381[/C][C]0.331292[/C][/ROW]
[ROW][C]6[/C][C]-0.022355[/C][C]-0.191[/C][C]0.424526[/C][/ROW]
[ROW][C]7[/C][C]-0.081049[/C][C]-0.6925[/C][C]0.245416[/C][/ROW]
[ROW][C]8[/C][C]0.052035[/C][C]0.4446[/C][C]0.328967[/C][/ROW]
[ROW][C]9[/C][C]-0.032275[/C][C]-0.2758[/C][C]0.391757[/C][/ROW]
[ROW][C]10[/C][C]-0.060272[/C][C]-0.515[/C][C]0.304068[/C][/ROW]
[ROW][C]11[/C][C]-0.043865[/C][C]-0.3748[/C][C]0.354455[/C][/ROW]
[ROW][C]12[/C][C]-0.030949[/C][C]-0.2644[/C][C]0.396097[/C][/ROW]
[ROW][C]13[/C][C]-0.071704[/C][C]-0.6126[/C][C]0.271009[/C][/ROW]
[ROW][C]14[/C][C]0.115417[/C][C]0.9861[/C][C]0.163665[/C][/ROW]
[ROW][C]15[/C][C]0.069432[/C][C]0.5932[/C][C]0.277432[/C][/ROW]
[ROW][C]16[/C][C]-0.047175[/C][C]-0.4031[/C][C]0.344038[/C][/ROW]
[ROW][C]17[/C][C]-0.012684[/C][C]-0.1084[/C][C]0.456998[/C][/ROW]
[ROW][C]18[/C][C]0.026216[/C][C]0.224[/C][C]0.411695[/C][/ROW]
[ROW][C]19[/C][C]-0.042784[/C][C]-0.3655[/C][C]0.357879[/C][/ROW]
[ROW][C]20[/C][C]-0.036918[/C][C]-0.3154[/C][C]0.376669[/C][/ROW]
[ROW][C]21[/C][C]-0.005448[/C][C]-0.0466[/C][C]0.481499[/C][/ROW]
[ROW][C]22[/C][C]0.018526[/C][C]0.1583[/C][C]0.437333[/C][/ROW]
[ROW][C]23[/C][C]-0.014551[/C][C]-0.1243[/C][C]0.450702[/C][/ROW]
[ROW][C]24[/C][C]-0.015925[/C][C]-0.1361[/C][C]0.446073[/C][/ROW]
[ROW][C]25[/C][C]-0.076073[/C][C]-0.65[/C][C]0.258878[/C][/ROW]
[ROW][C]26[/C][C]-0.002213[/C][C]-0.0189[/C][C]0.492482[/C][/ROW]
[ROW][C]27[/C][C]-0.006158[/C][C]-0.0526[/C][C]0.479093[/C][/ROW]
[ROW][C]28[/C][C]-0.004521[/C][C]-0.0386[/C][C]0.484648[/C][/ROW]
[ROW][C]29[/C][C]-0.005324[/C][C]-0.0455[/C][C]0.481921[/C][/ROW]
[ROW][C]30[/C][C]-0.038036[/C][C]-0.325[/C][C]0.373065[/C][/ROW]
[ROW][C]31[/C][C]-0.007614[/C][C]-0.0651[/C][C]0.474155[/C][/ROW]
[ROW][C]32[/C][C]-0.02074[/C][C]-0.1772[/C][C]0.429919[/C][/ROW]
[ROW][C]33[/C][C]-0.027801[/C][C]-0.2375[/C][C]0.406454[/C][/ROW]
[ROW][C]34[/C][C]-0.035937[/C][C]-0.307[/C][C]0.379842[/C][/ROW]
[ROW][C]35[/C][C]-0.007745[/C][C]-0.0662[/C][C]0.473709[/C][/ROW]
[ROW][C]36[/C][C]0.000452[/C][C]0.0039[/C][C]0.498464[/C][/ROW]
[ROW][C]37[/C][C]-0.025204[/C][C]-0.2153[/C][C]0.415051[/C][/ROW]
[ROW][C]38[/C][C]-0.040868[/C][C]-0.3492[/C][C]0.363981[/C][/ROW]
[ROW][C]39[/C][C]0.014343[/C][C]0.1225[/C][C]0.4514[/C][/ROW]
[ROW][C]40[/C][C]-0.030683[/C][C]-0.2622[/C][C]0.39697[/C][/ROW]
[ROW][C]41[/C][C]-0.039092[/C][C]-0.334[/C][C]0.369668[/C][/ROW]
[ROW][C]42[/C][C]-0.017983[/C][C]-0.1536[/C][C]0.439156[/C][/ROW]
[ROW][C]43[/C][C]-0.016108[/C][C]-0.1376[/C][C]0.445457[/C][/ROW]
[ROW][C]44[/C][C]-0.040648[/C][C]-0.3473[/C][C]0.364685[/C][/ROW]
[ROW][C]45[/C][C]-0.032775[/C][C]-0.28[/C][C]0.390125[/C][/ROW]
[ROW][C]46[/C][C]-0.025935[/C][C]-0.2216[/C][C]0.412626[/C][/ROW]
[ROW][C]47[/C][C]-0.011771[/C][C]-0.1006[/C][C]0.460084[/C][/ROW]
[ROW][C]48[/C][C]-0.045295[/C][C]-0.387[/C][C]0.34994[/C][/ROW]
[/TABLE]
Source: https://freestatistics.org/blog/index.php?pk=243585&T=2

Globally Unique Identifier (entire table): ba.freestatistics.org/blog/index.php?pk=243585&T=2

As an alternative you can also use a QR Code:  

The GUIDs for individual cells are displayed in the table below:

Partial Autocorrelation Function
Time lag kPACF(k)T-STATP-value
10.9455188.07850
2-0.003448-0.02950.48829
3-0.042509-0.36320.358752
40.0604930.51680.303412
5-0.051279-0.43810.331292
6-0.022355-0.1910.424526
7-0.081049-0.69250.245416
80.0520350.44460.328967
9-0.032275-0.27580.391757
10-0.060272-0.5150.304068
11-0.043865-0.37480.354455
12-0.030949-0.26440.396097
13-0.071704-0.61260.271009
140.1154170.98610.163665
150.0694320.59320.277432
16-0.047175-0.40310.344038
17-0.012684-0.10840.456998
180.0262160.2240.411695
19-0.042784-0.36550.357879
20-0.036918-0.31540.376669
21-0.005448-0.04660.481499
220.0185260.15830.437333
23-0.014551-0.12430.450702
24-0.015925-0.13610.446073
25-0.076073-0.650.258878
26-0.002213-0.01890.492482
27-0.006158-0.05260.479093
28-0.004521-0.03860.484648
29-0.005324-0.04550.481921
30-0.038036-0.3250.373065
31-0.007614-0.06510.474155
32-0.02074-0.17720.429919
33-0.027801-0.23750.406454
34-0.035937-0.3070.379842
35-0.007745-0.06620.473709
360.0004520.00390.498464
37-0.025204-0.21530.415051
38-0.040868-0.34920.363981
390.0143430.12250.4514
40-0.030683-0.26220.39697
41-0.039092-0.3340.369668
42-0.017983-0.15360.439156
43-0.016108-0.13760.445457
44-0.040648-0.34730.364685
45-0.032775-0.280.390125
46-0.025935-0.22160.412626
47-0.011771-0.10060.460084
48-0.045295-0.3870.34994


Parameters (Session):
par1 = 48 ; par2 = 1 ; par3 = 0 ; par4 = 0 ; par5 = 12 ; par6 = White Noise ; par7 = 0.95 ;
Parameters (R input):
par1 = 48 ; par2 = 1 ; par3 = 0 ; par4 = 0 ; par5 = 12 ; par6 = White Noise ; par7 = 0.95 ; par8 = ;
R code (references can be found in the software module):
if (par1 == 'Default') {
par1 = 10*log10(length(x))
} else {
par1 <- as.numeric(par1)
}
par2 <- as.numeric(par2)
par3 <- as.numeric(par3)
par4 <- as.numeric(par4)
par5 <- as.numeric(par5)
if (par6 == 'White Noise') par6 <- 'white' else par6 <- 'ma'
par7 <- as.numeric(par7)
if (par8 != '') par8 <- as.numeric(par8)
ox <- x
if (par8 == '') {
if (par2 == 0) {
x <- log(x)
} else {
x <- (x ^ par2 - 1) / par2
}
} else {
x <- log(x,base=par8)
}
if (par3 > 0) x <- diff(x,lag=1,difference=par3)
if (par4 > 0) x <- diff(x,lag=par5,difference=par4)
bitmap(file='picts.png')
op <- par(mfrow=c(2,1))
plot(ox,type='l',main='Original Time Series',xlab='time',ylab='value')
if (par8=='') {
mytitle <- paste('Working Time Series (lambda=',par2,', d=',par3,', D=',par4,')',sep='')
mysub <- paste('(lambda=',par2,', d=',par3,', D=',par4,', CI=', par7, ', CI type=',par6,')',sep='')
} else {
mytitle <- paste('Working Time Series (base=',par8,', d=',par3,', D=',par4,')',sep='')
mysub <- paste('(base=',par8,', d=',par3,', D=',par4,', CI=', par7, ', CI type=',par6,')',sep='')
}
plot(x,type='l', main=mytitle,xlab='time',ylab='value')
par(op)
dev.off()
bitmap(file='pic1.png')
racf <- acf(x, par1, main='Autocorrelation', xlab='time lag', ylab='ACF', ci.type=par6, ci=par7, sub=mysub)
dev.off()
bitmap(file='pic2.png')
rpacf <- pacf(x,par1,main='Partial Autocorrelation',xlab='lags',ylab='PACF',sub=mysub)
dev.off()
(myacf <- c(racf$acf))
(mypacf <- c(rpacf$acf))
lengthx <- length(x)
sqrtn <- sqrt(lengthx)
load(file='createtable')
a<-table.start()
a<-table.row.start(a)
a<-table.element(a,'Autocorrelation Function',4,TRUE)
a<-table.row.end(a)
a<-table.row.start(a)
a<-table.element(a,'Time lag k',header=TRUE)
a<-table.element(a,hyperlink('basics.htm','ACF(k)','click here for more information about the Autocorrelation Function'),header=TRUE)
a<-table.element(a,'T-STAT',header=TRUE)
a<-table.element(a,'P-value',header=TRUE)
a<-table.row.end(a)
for (i in 2:(par1+1)) {
a<-table.row.start(a)
a<-table.element(a,i-1,header=TRUE)
a<-table.element(a,round(myacf[i],6))
mytstat <- myacf[i]*sqrtn
a<-table.element(a,round(mytstat,4))
a<-table.element(a,round(1-pt(abs(mytstat),lengthx),6))
a<-table.row.end(a)
}
a<-table.end(a)
table.save(a,file='mytable.tab')
a<-table.start()
a<-table.row.start(a)
a<-table.element(a,'Partial Autocorrelation Function',4,TRUE)
a<-table.row.end(a)
a<-table.row.start(a)
a<-table.element(a,'Time lag k',header=TRUE)
a<-table.element(a,hyperlink('basics.htm','PACF(k)','click here for more information about the Partial Autocorrelation Function'),header=TRUE)
a<-table.element(a,'T-STAT',header=TRUE)
a<-table.element(a,'P-value',header=TRUE)
a<-table.row.end(a)
for (i in 1:par1) {
a<-table.row.start(a)
a<-table.element(a,i,header=TRUE)
a<-table.element(a,round(mypacf[i],6))
mytstat <- mypacf[i]*sqrtn
a<-table.element(a,round(mytstat,4))
a<-table.element(a,round(1-pt(abs(mytstat),lengthx),6))
a<-table.row.end(a)
}
a<-table.end(a)
table.save(a,file='mytable1.tab')