Free Statistics

of Irreproducible Research!

Author's title

Author*Unverified author*
R Software Modulerwasp_autocorrelation.wasp
Title produced by software(Partial) Autocorrelation Function
Date of computationSat, 18 Oct 2014 19:21:51 +0100
Cite this page as followsStatistical Computations at FreeStatistics.org, Office for Research Development and Education, URL https://freestatistics.org/blog/index.php?v=date/2014/Oct/18/t1413656545h92a52c06fh7lgo.htm/, Retrieved Sun, 12 May 2024 13:16:30 +0000
Statistical Computations at FreeStatistics.org, Office for Research Development and Education, URL https://freestatistics.org/blog/index.php?pk=243549, Retrieved Sun, 12 May 2024 13:16:30 +0000
QR Codes:

Original text written by user:
IsPrivate?No (this computation is public)
User-defined keywords
Estimated Impact64
Family? (F = Feedback message, R = changed R code, M = changed R Module, P = changed Parameters, D = changed Data)
-       [(Partial) Autocorrelation Function] [] [2014-10-18 18:21:51] [09c39f9cdae305b47e6b113e2a46d5a6] [Current]
Feedback Forum

Post a new message
Dataseries X:
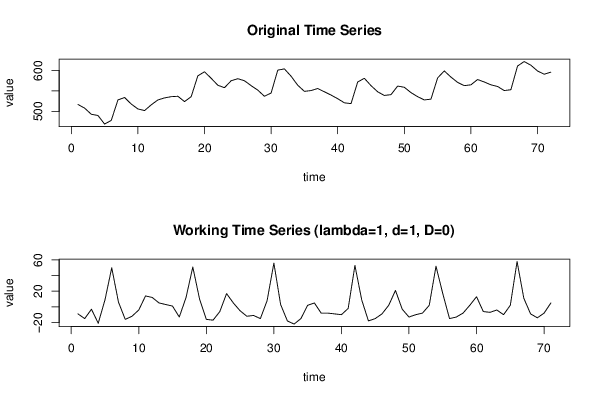
517
508
493
490
469
478
528
534
518
506
502
516
528
533
536
537
524
536
587
597
581
564
558
575
580
575
563
552
537
545
601
604
586
564
549
551
556
548
540
531
521
519
572
581
563
548
539
541
562
559
546
536
528
530
582
599
584
571
563
565
578
572
565
561
551
553
611
622
613
599
591
596


Summary of computational transaction
Raw Inputview raw input (R code)
Raw Outputview raw output of R engine
Computing time2 seconds
R Server'George Udny Yule' @ yule.wessa.net

\begin{tabular}{lllllllll}
\hline
Summary of computational transaction \tabularnewline
Raw Input & view raw input (R code)  \tabularnewline
Raw Output & view raw output of R engine  \tabularnewline
Computing time & 2 seconds \tabularnewline
R Server & 'George Udny Yule' @ yule.wessa.net \tabularnewline
\hline
\end{tabular}
%Source: https://freestatistics.org/blog/index.php?pk=243549&T=0

[TABLE]
[ROW][C]Summary of computational transaction[/C][/ROW]
[ROW][C]Raw Input[/C][C]view raw input (R code) [/C][/ROW]
[ROW][C]Raw Output[/C][C]view raw output of R engine [/C][/ROW]
[ROW][C]Computing time[/C][C]2 seconds[/C][/ROW]
[ROW][C]R Server[/C][C]'George Udny Yule' @ yule.wessa.net[/C][/ROW]
[/TABLE]
Source: https://freestatistics.org/blog/index.php?pk=243549&T=0

Globally Unique Identifier (entire table): ba.freestatistics.org/blog/index.php?pk=243549&T=0

As an alternative you can also use a QR Code:  

The GUIDs for individual cells are displayed in the table below:

Summary of computational transaction
Raw Inputview raw input (R code)
Raw Outputview raw output of R engine
Computing time2 seconds
R Server'George Udny Yule' @ yule.wessa.net


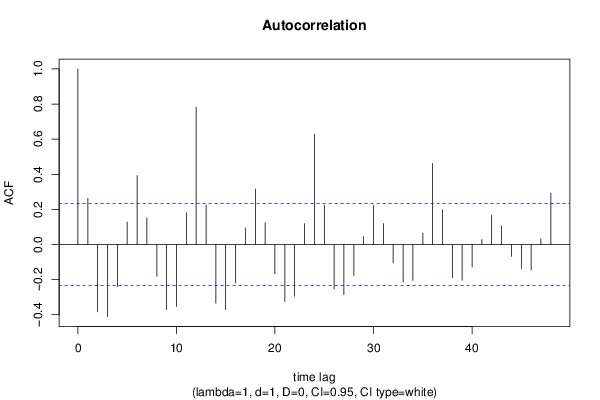
Autocorrelation Function
Time lag kACF(k)T-STATP-value
10.2630262.21630.014938
2-0.383545-3.23180.000933
3-0.411347-3.46610.00045
4-0.241243-2.03270.022909
50.1284871.08270.141313
60.3921723.30450.000747
70.1516811.27810.102691
8-0.181525-1.52960.065285
9-0.370359-3.12070.001304
10-0.35315-2.97570.001997
110.1813911.52840.065425
120.7834856.60180
130.2251051.89680.030963
14-0.334327-2.81710.003136
15-0.371359-3.12910.001272
16-0.21979-1.8520.034093
170.0941080.7930.215219
180.3156172.65940.004834
190.1240771.04550.149671
20-0.167524-1.41160.08122
21-0.325022-2.73870.003896
22-0.294888-2.48480.007661
230.1184040.99770.160909
240.6271835.28471e-06
250.2234531.88280.031909
26-0.253219-2.13370.018163
27-0.284333-2.39580.009611
28-0.177133-1.49250.069993
290.0443890.3740.354749
300.2226151.87580.032398
310.119441.00640.158816
32-0.104503-0.88060.190764
33-0.213804-1.80150.037931
34-0.204904-1.72650.044299
350.0654080.55110.291636
360.4609753.88420.000114
370.197531.66440.050218
38-0.1897-1.59840.057193
39-0.203647-1.7160.045265
40-0.12801-1.07860.142201
410.0278760.23490.407485
420.1655841.39520.083646
430.1048740.88370.189925
44-0.067646-0.570.28524
45-0.136965-1.15410.126168
46-0.145483-1.22590.11215
470.0326790.27540.391922
480.2935232.47330.007892

\begin{tabular}{lllllllll}
\hline
Autocorrelation Function \tabularnewline
Time lag k & ACF(k) & T-STAT & P-value \tabularnewline
1 & 0.263026 & 2.2163 & 0.014938 \tabularnewline
2 & -0.383545 & -3.2318 & 0.000933 \tabularnewline
3 & -0.411347 & -3.4661 & 0.00045 \tabularnewline
4 & -0.241243 & -2.0327 & 0.022909 \tabularnewline
5 & 0.128487 & 1.0827 & 0.141313 \tabularnewline
6 & 0.392172 & 3.3045 & 0.000747 \tabularnewline
7 & 0.151681 & 1.2781 & 0.102691 \tabularnewline
8 & -0.181525 & -1.5296 & 0.065285 \tabularnewline
9 & -0.370359 & -3.1207 & 0.001304 \tabularnewline
10 & -0.35315 & -2.9757 & 0.001997 \tabularnewline
11 & 0.181391 & 1.5284 & 0.065425 \tabularnewline
12 & 0.783485 & 6.6018 & 0 \tabularnewline
13 & 0.225105 & 1.8968 & 0.030963 \tabularnewline
14 & -0.334327 & -2.8171 & 0.003136 \tabularnewline
15 & -0.371359 & -3.1291 & 0.001272 \tabularnewline
16 & -0.21979 & -1.852 & 0.034093 \tabularnewline
17 & 0.094108 & 0.793 & 0.215219 \tabularnewline
18 & 0.315617 & 2.6594 & 0.004834 \tabularnewline
19 & 0.124077 & 1.0455 & 0.149671 \tabularnewline
20 & -0.167524 & -1.4116 & 0.08122 \tabularnewline
21 & -0.325022 & -2.7387 & 0.003896 \tabularnewline
22 & -0.294888 & -2.4848 & 0.007661 \tabularnewline
23 & 0.118404 & 0.9977 & 0.160909 \tabularnewline
24 & 0.627183 & 5.2847 & 1e-06 \tabularnewline
25 & 0.223453 & 1.8828 & 0.031909 \tabularnewline
26 & -0.253219 & -2.1337 & 0.018163 \tabularnewline
27 & -0.284333 & -2.3958 & 0.009611 \tabularnewline
28 & -0.177133 & -1.4925 & 0.069993 \tabularnewline
29 & 0.044389 & 0.374 & 0.354749 \tabularnewline
30 & 0.222615 & 1.8758 & 0.032398 \tabularnewline
31 & 0.11944 & 1.0064 & 0.158816 \tabularnewline
32 & -0.104503 & -0.8806 & 0.190764 \tabularnewline
33 & -0.213804 & -1.8015 & 0.037931 \tabularnewline
34 & -0.204904 & -1.7265 & 0.044299 \tabularnewline
35 & 0.065408 & 0.5511 & 0.291636 \tabularnewline
36 & 0.460975 & 3.8842 & 0.000114 \tabularnewline
37 & 0.19753 & 1.6644 & 0.050218 \tabularnewline
38 & -0.1897 & -1.5984 & 0.057193 \tabularnewline
39 & -0.203647 & -1.716 & 0.045265 \tabularnewline
40 & -0.12801 & -1.0786 & 0.142201 \tabularnewline
41 & 0.027876 & 0.2349 & 0.407485 \tabularnewline
42 & 0.165584 & 1.3952 & 0.083646 \tabularnewline
43 & 0.104874 & 0.8837 & 0.189925 \tabularnewline
44 & -0.067646 & -0.57 & 0.28524 \tabularnewline
45 & -0.136965 & -1.1541 & 0.126168 \tabularnewline
46 & -0.145483 & -1.2259 & 0.11215 \tabularnewline
47 & 0.032679 & 0.2754 & 0.391922 \tabularnewline
48 & 0.293523 & 2.4733 & 0.007892 \tabularnewline
\hline
\end{tabular}
%Source: https://freestatistics.org/blog/index.php?pk=243549&T=1

[TABLE]
[ROW][C]Autocorrelation Function[/C][/ROW]
[ROW][C]Time lag k[/C][C]ACF(k)[/C][C]T-STAT[/C][C]P-value[/C][/ROW]
[ROW][C]1[/C][C]0.263026[/C][C]2.2163[/C][C]0.014938[/C][/ROW]
[ROW][C]2[/C][C]-0.383545[/C][C]-3.2318[/C][C]0.000933[/C][/ROW]
[ROW][C]3[/C][C]-0.411347[/C][C]-3.4661[/C][C]0.00045[/C][/ROW]
[ROW][C]4[/C][C]-0.241243[/C][C]-2.0327[/C][C]0.022909[/C][/ROW]
[ROW][C]5[/C][C]0.128487[/C][C]1.0827[/C][C]0.141313[/C][/ROW]
[ROW][C]6[/C][C]0.392172[/C][C]3.3045[/C][C]0.000747[/C][/ROW]
[ROW][C]7[/C][C]0.151681[/C][C]1.2781[/C][C]0.102691[/C][/ROW]
[ROW][C]8[/C][C]-0.181525[/C][C]-1.5296[/C][C]0.065285[/C][/ROW]
[ROW][C]9[/C][C]-0.370359[/C][C]-3.1207[/C][C]0.001304[/C][/ROW]
[ROW][C]10[/C][C]-0.35315[/C][C]-2.9757[/C][C]0.001997[/C][/ROW]
[ROW][C]11[/C][C]0.181391[/C][C]1.5284[/C][C]0.065425[/C][/ROW]
[ROW][C]12[/C][C]0.783485[/C][C]6.6018[/C][C]0[/C][/ROW]
[ROW][C]13[/C][C]0.225105[/C][C]1.8968[/C][C]0.030963[/C][/ROW]
[ROW][C]14[/C][C]-0.334327[/C][C]-2.8171[/C][C]0.003136[/C][/ROW]
[ROW][C]15[/C][C]-0.371359[/C][C]-3.1291[/C][C]0.001272[/C][/ROW]
[ROW][C]16[/C][C]-0.21979[/C][C]-1.852[/C][C]0.034093[/C][/ROW]
[ROW][C]17[/C][C]0.094108[/C][C]0.793[/C][C]0.215219[/C][/ROW]
[ROW][C]18[/C][C]0.315617[/C][C]2.6594[/C][C]0.004834[/C][/ROW]
[ROW][C]19[/C][C]0.124077[/C][C]1.0455[/C][C]0.149671[/C][/ROW]
[ROW][C]20[/C][C]-0.167524[/C][C]-1.4116[/C][C]0.08122[/C][/ROW]
[ROW][C]21[/C][C]-0.325022[/C][C]-2.7387[/C][C]0.003896[/C][/ROW]
[ROW][C]22[/C][C]-0.294888[/C][C]-2.4848[/C][C]0.007661[/C][/ROW]
[ROW][C]23[/C][C]0.118404[/C][C]0.9977[/C][C]0.160909[/C][/ROW]
[ROW][C]24[/C][C]0.627183[/C][C]5.2847[/C][C]1e-06[/C][/ROW]
[ROW][C]25[/C][C]0.223453[/C][C]1.8828[/C][C]0.031909[/C][/ROW]
[ROW][C]26[/C][C]-0.253219[/C][C]-2.1337[/C][C]0.018163[/C][/ROW]
[ROW][C]27[/C][C]-0.284333[/C][C]-2.3958[/C][C]0.009611[/C][/ROW]
[ROW][C]28[/C][C]-0.177133[/C][C]-1.4925[/C][C]0.069993[/C][/ROW]
[ROW][C]29[/C][C]0.044389[/C][C]0.374[/C][C]0.354749[/C][/ROW]
[ROW][C]30[/C][C]0.222615[/C][C]1.8758[/C][C]0.032398[/C][/ROW]
[ROW][C]31[/C][C]0.11944[/C][C]1.0064[/C][C]0.158816[/C][/ROW]
[ROW][C]32[/C][C]-0.104503[/C][C]-0.8806[/C][C]0.190764[/C][/ROW]
[ROW][C]33[/C][C]-0.213804[/C][C]-1.8015[/C][C]0.037931[/C][/ROW]
[ROW][C]34[/C][C]-0.204904[/C][C]-1.7265[/C][C]0.044299[/C][/ROW]
[ROW][C]35[/C][C]0.065408[/C][C]0.5511[/C][C]0.291636[/C][/ROW]
[ROW][C]36[/C][C]0.460975[/C][C]3.8842[/C][C]0.000114[/C][/ROW]
[ROW][C]37[/C][C]0.19753[/C][C]1.6644[/C][C]0.050218[/C][/ROW]
[ROW][C]38[/C][C]-0.1897[/C][C]-1.5984[/C][C]0.057193[/C][/ROW]
[ROW][C]39[/C][C]-0.203647[/C][C]-1.716[/C][C]0.045265[/C][/ROW]
[ROW][C]40[/C][C]-0.12801[/C][C]-1.0786[/C][C]0.142201[/C][/ROW]
[ROW][C]41[/C][C]0.027876[/C][C]0.2349[/C][C]0.407485[/C][/ROW]
[ROW][C]42[/C][C]0.165584[/C][C]1.3952[/C][C]0.083646[/C][/ROW]
[ROW][C]43[/C][C]0.104874[/C][C]0.8837[/C][C]0.189925[/C][/ROW]
[ROW][C]44[/C][C]-0.067646[/C][C]-0.57[/C][C]0.28524[/C][/ROW]
[ROW][C]45[/C][C]-0.136965[/C][C]-1.1541[/C][C]0.126168[/C][/ROW]
[ROW][C]46[/C][C]-0.145483[/C][C]-1.2259[/C][C]0.11215[/C][/ROW]
[ROW][C]47[/C][C]0.032679[/C][C]0.2754[/C][C]0.391922[/C][/ROW]
[ROW][C]48[/C][C]0.293523[/C][C]2.4733[/C][C]0.007892[/C][/ROW]
[/TABLE]
Source: https://freestatistics.org/blog/index.php?pk=243549&T=1

Globally Unique Identifier (entire table): ba.freestatistics.org/blog/index.php?pk=243549&T=1

As an alternative you can also use a QR Code:  

The GUIDs for individual cells are displayed in the table below:

Autocorrelation Function
Time lag kACF(k)T-STATP-value
10.2630262.21630.014938
2-0.383545-3.23180.000933
3-0.411347-3.46610.00045
4-0.241243-2.03270.022909
50.1284871.08270.141313
60.3921723.30450.000747
70.1516811.27810.102691
8-0.181525-1.52960.065285
9-0.370359-3.12070.001304
10-0.35315-2.97570.001997
110.1813911.52840.065425
120.7834856.60180
130.2251051.89680.030963
14-0.334327-2.81710.003136
15-0.371359-3.12910.001272
16-0.21979-1.8520.034093
170.0941080.7930.215219
180.3156172.65940.004834
190.1240771.04550.149671
20-0.167524-1.41160.08122
21-0.325022-2.73870.003896
22-0.294888-2.48480.007661
230.1184040.99770.160909
240.6271835.28471e-06
250.2234531.88280.031909
26-0.253219-2.13370.018163
27-0.284333-2.39580.009611
28-0.177133-1.49250.069993
290.0443890.3740.354749
300.2226151.87580.032398
310.119441.00640.158816
32-0.104503-0.88060.190764
33-0.213804-1.80150.037931
34-0.204904-1.72650.044299
350.0654080.55110.291636
360.4609753.88420.000114
370.197531.66440.050218
38-0.1897-1.59840.057193
39-0.203647-1.7160.045265
40-0.12801-1.07860.142201
410.0278760.23490.407485
420.1655841.39520.083646
430.1048740.88370.189925
44-0.067646-0.570.28524
45-0.136965-1.15410.126168
46-0.145483-1.22590.11215
470.0326790.27540.391922
480.2935232.47330.007892


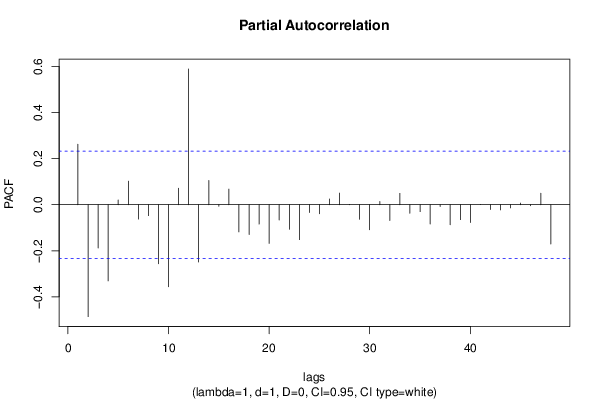
Partial Autocorrelation Function
Time lag kPACF(k)T-STATP-value
10.2630262.21630.014938
2-0.486376-4.09835.5e-05
3-0.187819-1.58260.058979
4-0.331095-2.78990.003383
50.0208930.1760.430379
60.102440.86320.195473
7-0.062481-0.52650.300099
8-0.047546-0.40060.344948
9-0.256827-2.16410.016912
10-0.356259-3.00190.001851
110.0718290.60520.273473
120.5899724.97122e-06
13-0.248596-2.09470.019883
140.1056550.89030.188165
15-0.00669-0.05640.477603
160.0679660.57270.284331
17-0.118185-0.99580.161353
18-0.129081-1.08770.140212
19-0.084206-0.70950.240159
20-0.168131-1.41670.080472
21-0.066788-0.56280.287684
22-0.106592-0.89820.186069
23-0.151652-1.27780.102734
24-0.033903-0.28570.387981
25-0.039004-0.32870.371691
260.0245940.20720.418211
270.0505520.4260.335712
280.0011280.00950.496222
29-0.063049-0.53130.298449
30-0.108729-0.91620.18134
310.0136950.11540.454229
32-0.068373-0.57610.283179
330.0494060.41630.339222
34-0.03737-0.31490.376886
35-0.029967-0.25250.400691
36-0.084099-0.70860.240436
37-0.008143-0.06860.472745
38-0.087191-0.73470.232476
39-0.064883-0.54670.293144
40-0.07706-0.64930.259113
410.0003280.00280.498902
42-0.020708-0.17450.43099
43-0.022357-0.18840.425555
44-0.013752-0.11590.454039
450.0068620.05780.477028
46-0.004232-0.03570.485826
470.0500520.42170.337242
48-0.170892-1.440.077137

\begin{tabular}{lllllllll}
\hline
Partial Autocorrelation Function \tabularnewline
Time lag k & PACF(k) & T-STAT & P-value \tabularnewline
1 & 0.263026 & 2.2163 & 0.014938 \tabularnewline
2 & -0.486376 & -4.0983 & 5.5e-05 \tabularnewline
3 & -0.187819 & -1.5826 & 0.058979 \tabularnewline
4 & -0.331095 & -2.7899 & 0.003383 \tabularnewline
5 & 0.020893 & 0.176 & 0.430379 \tabularnewline
6 & 0.10244 & 0.8632 & 0.195473 \tabularnewline
7 & -0.062481 & -0.5265 & 0.300099 \tabularnewline
8 & -0.047546 & -0.4006 & 0.344948 \tabularnewline
9 & -0.256827 & -2.1641 & 0.016912 \tabularnewline
10 & -0.356259 & -3.0019 & 0.001851 \tabularnewline
11 & 0.071829 & 0.6052 & 0.273473 \tabularnewline
12 & 0.589972 & 4.9712 & 2e-06 \tabularnewline
13 & -0.248596 & -2.0947 & 0.019883 \tabularnewline
14 & 0.105655 & 0.8903 & 0.188165 \tabularnewline
15 & -0.00669 & -0.0564 & 0.477603 \tabularnewline
16 & 0.067966 & 0.5727 & 0.284331 \tabularnewline
17 & -0.118185 & -0.9958 & 0.161353 \tabularnewline
18 & -0.129081 & -1.0877 & 0.140212 \tabularnewline
19 & -0.084206 & -0.7095 & 0.240159 \tabularnewline
20 & -0.168131 & -1.4167 & 0.080472 \tabularnewline
21 & -0.066788 & -0.5628 & 0.287684 \tabularnewline
22 & -0.106592 & -0.8982 & 0.186069 \tabularnewline
23 & -0.151652 & -1.2778 & 0.102734 \tabularnewline
24 & -0.033903 & -0.2857 & 0.387981 \tabularnewline
25 & -0.039004 & -0.3287 & 0.371691 \tabularnewline
26 & 0.024594 & 0.2072 & 0.418211 \tabularnewline
27 & 0.050552 & 0.426 & 0.335712 \tabularnewline
28 & 0.001128 & 0.0095 & 0.496222 \tabularnewline
29 & -0.063049 & -0.5313 & 0.298449 \tabularnewline
30 & -0.108729 & -0.9162 & 0.18134 \tabularnewline
31 & 0.013695 & 0.1154 & 0.454229 \tabularnewline
32 & -0.068373 & -0.5761 & 0.283179 \tabularnewline
33 & 0.049406 & 0.4163 & 0.339222 \tabularnewline
34 & -0.03737 & -0.3149 & 0.376886 \tabularnewline
35 & -0.029967 & -0.2525 & 0.400691 \tabularnewline
36 & -0.084099 & -0.7086 & 0.240436 \tabularnewline
37 & -0.008143 & -0.0686 & 0.472745 \tabularnewline
38 & -0.087191 & -0.7347 & 0.232476 \tabularnewline
39 & -0.064883 & -0.5467 & 0.293144 \tabularnewline
40 & -0.07706 & -0.6493 & 0.259113 \tabularnewline
41 & 0.000328 & 0.0028 & 0.498902 \tabularnewline
42 & -0.020708 & -0.1745 & 0.43099 \tabularnewline
43 & -0.022357 & -0.1884 & 0.425555 \tabularnewline
44 & -0.013752 & -0.1159 & 0.454039 \tabularnewline
45 & 0.006862 & 0.0578 & 0.477028 \tabularnewline
46 & -0.004232 & -0.0357 & 0.485826 \tabularnewline
47 & 0.050052 & 0.4217 & 0.337242 \tabularnewline
48 & -0.170892 & -1.44 & 0.077137 \tabularnewline
\hline
\end{tabular}
%Source: https://freestatistics.org/blog/index.php?pk=243549&T=2

[TABLE]
[ROW][C]Partial Autocorrelation Function[/C][/ROW]
[ROW][C]Time lag k[/C][C]PACF(k)[/C][C]T-STAT[/C][C]P-value[/C][/ROW]
[ROW][C]1[/C][C]0.263026[/C][C]2.2163[/C][C]0.014938[/C][/ROW]
[ROW][C]2[/C][C]-0.486376[/C][C]-4.0983[/C][C]5.5e-05[/C][/ROW]
[ROW][C]3[/C][C]-0.187819[/C][C]-1.5826[/C][C]0.058979[/C][/ROW]
[ROW][C]4[/C][C]-0.331095[/C][C]-2.7899[/C][C]0.003383[/C][/ROW]
[ROW][C]5[/C][C]0.020893[/C][C]0.176[/C][C]0.430379[/C][/ROW]
[ROW][C]6[/C][C]0.10244[/C][C]0.8632[/C][C]0.195473[/C][/ROW]
[ROW][C]7[/C][C]-0.062481[/C][C]-0.5265[/C][C]0.300099[/C][/ROW]
[ROW][C]8[/C][C]-0.047546[/C][C]-0.4006[/C][C]0.344948[/C][/ROW]
[ROW][C]9[/C][C]-0.256827[/C][C]-2.1641[/C][C]0.016912[/C][/ROW]
[ROW][C]10[/C][C]-0.356259[/C][C]-3.0019[/C][C]0.001851[/C][/ROW]
[ROW][C]11[/C][C]0.071829[/C][C]0.6052[/C][C]0.273473[/C][/ROW]
[ROW][C]12[/C][C]0.589972[/C][C]4.9712[/C][C]2e-06[/C][/ROW]
[ROW][C]13[/C][C]-0.248596[/C][C]-2.0947[/C][C]0.019883[/C][/ROW]
[ROW][C]14[/C][C]0.105655[/C][C]0.8903[/C][C]0.188165[/C][/ROW]
[ROW][C]15[/C][C]-0.00669[/C][C]-0.0564[/C][C]0.477603[/C][/ROW]
[ROW][C]16[/C][C]0.067966[/C][C]0.5727[/C][C]0.284331[/C][/ROW]
[ROW][C]17[/C][C]-0.118185[/C][C]-0.9958[/C][C]0.161353[/C][/ROW]
[ROW][C]18[/C][C]-0.129081[/C][C]-1.0877[/C][C]0.140212[/C][/ROW]
[ROW][C]19[/C][C]-0.084206[/C][C]-0.7095[/C][C]0.240159[/C][/ROW]
[ROW][C]20[/C][C]-0.168131[/C][C]-1.4167[/C][C]0.080472[/C][/ROW]
[ROW][C]21[/C][C]-0.066788[/C][C]-0.5628[/C][C]0.287684[/C][/ROW]
[ROW][C]22[/C][C]-0.106592[/C][C]-0.8982[/C][C]0.186069[/C][/ROW]
[ROW][C]23[/C][C]-0.151652[/C][C]-1.2778[/C][C]0.102734[/C][/ROW]
[ROW][C]24[/C][C]-0.033903[/C][C]-0.2857[/C][C]0.387981[/C][/ROW]
[ROW][C]25[/C][C]-0.039004[/C][C]-0.3287[/C][C]0.371691[/C][/ROW]
[ROW][C]26[/C][C]0.024594[/C][C]0.2072[/C][C]0.418211[/C][/ROW]
[ROW][C]27[/C][C]0.050552[/C][C]0.426[/C][C]0.335712[/C][/ROW]
[ROW][C]28[/C][C]0.001128[/C][C]0.0095[/C][C]0.496222[/C][/ROW]
[ROW][C]29[/C][C]-0.063049[/C][C]-0.5313[/C][C]0.298449[/C][/ROW]
[ROW][C]30[/C][C]-0.108729[/C][C]-0.9162[/C][C]0.18134[/C][/ROW]
[ROW][C]31[/C][C]0.013695[/C][C]0.1154[/C][C]0.454229[/C][/ROW]
[ROW][C]32[/C][C]-0.068373[/C][C]-0.5761[/C][C]0.283179[/C][/ROW]
[ROW][C]33[/C][C]0.049406[/C][C]0.4163[/C][C]0.339222[/C][/ROW]
[ROW][C]34[/C][C]-0.03737[/C][C]-0.3149[/C][C]0.376886[/C][/ROW]
[ROW][C]35[/C][C]-0.029967[/C][C]-0.2525[/C][C]0.400691[/C][/ROW]
[ROW][C]36[/C][C]-0.084099[/C][C]-0.7086[/C][C]0.240436[/C][/ROW]
[ROW][C]37[/C][C]-0.008143[/C][C]-0.0686[/C][C]0.472745[/C][/ROW]
[ROW][C]38[/C][C]-0.087191[/C][C]-0.7347[/C][C]0.232476[/C][/ROW]
[ROW][C]39[/C][C]-0.064883[/C][C]-0.5467[/C][C]0.293144[/C][/ROW]
[ROW][C]40[/C][C]-0.07706[/C][C]-0.6493[/C][C]0.259113[/C][/ROW]
[ROW][C]41[/C][C]0.000328[/C][C]0.0028[/C][C]0.498902[/C][/ROW]
[ROW][C]42[/C][C]-0.020708[/C][C]-0.1745[/C][C]0.43099[/C][/ROW]
[ROW][C]43[/C][C]-0.022357[/C][C]-0.1884[/C][C]0.425555[/C][/ROW]
[ROW][C]44[/C][C]-0.013752[/C][C]-0.1159[/C][C]0.454039[/C][/ROW]
[ROW][C]45[/C][C]0.006862[/C][C]0.0578[/C][C]0.477028[/C][/ROW]
[ROW][C]46[/C][C]-0.004232[/C][C]-0.0357[/C][C]0.485826[/C][/ROW]
[ROW][C]47[/C][C]0.050052[/C][C]0.4217[/C][C]0.337242[/C][/ROW]
[ROW][C]48[/C][C]-0.170892[/C][C]-1.44[/C][C]0.077137[/C][/ROW]
[/TABLE]
Source: https://freestatistics.org/blog/index.php?pk=243549&T=2

Globally Unique Identifier (entire table): ba.freestatistics.org/blog/index.php?pk=243549&T=2

As an alternative you can also use a QR Code:  

The GUIDs for individual cells are displayed in the table below:

Partial Autocorrelation Function
Time lag kPACF(k)T-STATP-value
10.2630262.21630.014938
2-0.486376-4.09835.5e-05
3-0.187819-1.58260.058979
4-0.331095-2.78990.003383
50.0208930.1760.430379
60.102440.86320.195473
7-0.062481-0.52650.300099
8-0.047546-0.40060.344948
9-0.256827-2.16410.016912
10-0.356259-3.00190.001851
110.0718290.60520.273473
120.5899724.97122e-06
13-0.248596-2.09470.019883
140.1056550.89030.188165
15-0.00669-0.05640.477603
160.0679660.57270.284331
17-0.118185-0.99580.161353
18-0.129081-1.08770.140212
19-0.084206-0.70950.240159
20-0.168131-1.41670.080472
21-0.066788-0.56280.287684
22-0.106592-0.89820.186069
23-0.151652-1.27780.102734
24-0.033903-0.28570.387981
25-0.039004-0.32870.371691
260.0245940.20720.418211
270.0505520.4260.335712
280.0011280.00950.496222
29-0.063049-0.53130.298449
30-0.108729-0.91620.18134
310.0136950.11540.454229
32-0.068373-0.57610.283179
330.0494060.41630.339222
34-0.03737-0.31490.376886
35-0.029967-0.25250.400691
36-0.084099-0.70860.240436
37-0.008143-0.06860.472745
38-0.087191-0.73470.232476
39-0.064883-0.54670.293144
40-0.07706-0.64930.259113
410.0003280.00280.498902
42-0.020708-0.17450.43099
43-0.022357-0.18840.425555
44-0.013752-0.11590.454039
450.0068620.05780.477028
46-0.004232-0.03570.485826
470.0500520.42170.337242
48-0.170892-1.440.077137


Parameters (Session):
par1 = 48 ; par2 = 1 ; par3 = 1 ; par4 = 0 ; par5 = 12 ; par6 = White Noise ; par7 = 0.95 ;
Parameters (R input):
par1 = 48 ; par2 = 1 ; par3 = 1 ; par4 = 0 ; par5 = 12 ; par6 = White Noise ; par7 = 0.95 ; par8 = ;
R code (references can be found in the software module):
par8 <- ''
par7 <- '0.95'
par6 <- 'White Noise'
par5 <- '12'
par4 <- '0'
par3 <- '0'
par2 <- '1'
par1 <- '48'
if (par1 == 'Default') {
par1 = 10*log10(length(x))
} else {
par1 <- as.numeric(par1)
}
par2 <- as.numeric(par2)
par3 <- as.numeric(par3)
par4 <- as.numeric(par4)
par5 <- as.numeric(par5)
if (par6 == 'White Noise') par6 <- 'white' else par6 <- 'ma'
par7 <- as.numeric(par7)
if (par8 != '') par8 <- as.numeric(par8)
ox <- x
if (par8 == '') {
if (par2 == 0) {
x <- log(x)
} else {
x <- (x ^ par2 - 1) / par2
}
} else {
x <- log(x,base=par8)
}
if (par3 > 0) x <- diff(x,lag=1,difference=par3)
if (par4 > 0) x <- diff(x,lag=par5,difference=par4)
bitmap(file='picts.png')
op <- par(mfrow=c(2,1))
plot(ox,type='l',main='Original Time Series',xlab='time',ylab='value')
if (par8=='') {
mytitle <- paste('Working Time Series (lambda=',par2,', d=',par3,', D=',par4,')',sep='')
mysub <- paste('(lambda=',par2,', d=',par3,', D=',par4,', CI=', par7, ', CI type=',par6,')',sep='')
} else {
mytitle <- paste('Working Time Series (base=',par8,', d=',par3,', D=',par4,')',sep='')
mysub <- paste('(base=',par8,', d=',par3,', D=',par4,', CI=', par7, ', CI type=',par6,')',sep='')
}
plot(x,type='l', main=mytitle,xlab='time',ylab='value')
par(op)
dev.off()
bitmap(file='pic1.png')
racf <- acf(x, par1, main='Autocorrelation', xlab='time lag', ylab='ACF', ci.type=par6, ci=par7, sub=mysub)
dev.off()
bitmap(file='pic2.png')
rpacf <- pacf(x,par1,main='Partial Autocorrelation',xlab='lags',ylab='PACF',sub=mysub)
dev.off()
(myacf <- c(racf$acf))
(mypacf <- c(rpacf$acf))
lengthx <- length(x)
sqrtn <- sqrt(lengthx)
load(file='createtable')
a<-table.start()
a<-table.row.start(a)
a<-table.element(a,'Autocorrelation Function',4,TRUE)
a<-table.row.end(a)
a<-table.row.start(a)
a<-table.element(a,'Time lag k',header=TRUE)
a<-table.element(a,hyperlink('basics.htm','ACF(k)','click here for more information about the Autocorrelation Function'),header=TRUE)
a<-table.element(a,'T-STAT',header=TRUE)
a<-table.element(a,'P-value',header=TRUE)
a<-table.row.end(a)
for (i in 2:(par1+1)) {
a<-table.row.start(a)
a<-table.element(a,i-1,header=TRUE)
a<-table.element(a,round(myacf[i],6))
mytstat <- myacf[i]*sqrtn
a<-table.element(a,round(mytstat,4))
a<-table.element(a,round(1-pt(abs(mytstat),lengthx),6))
a<-table.row.end(a)
}
a<-table.end(a)
table.save(a,file='mytable.tab')
a<-table.start()
a<-table.row.start(a)
a<-table.element(a,'Partial Autocorrelation Function',4,TRUE)
a<-table.row.end(a)
a<-table.row.start(a)
a<-table.element(a,'Time lag k',header=TRUE)
a<-table.element(a,hyperlink('basics.htm','PACF(k)','click here for more information about the Partial Autocorrelation Function'),header=TRUE)
a<-table.element(a,'T-STAT',header=TRUE)
a<-table.element(a,'P-value',header=TRUE)
a<-table.row.end(a)
for (i in 1:par1) {
a<-table.row.start(a)
a<-table.element(a,i,header=TRUE)
a<-table.element(a,round(mypacf[i],6))
mytstat <- mypacf[i]*sqrtn
a<-table.element(a,round(mytstat,4))
a<-table.element(a,round(1-pt(abs(mytstat),lengthx),6))
a<-table.row.end(a)
}
a<-table.end(a)
table.save(a,file='mytable1.tab')