Free Statistics

of Irreproducible Research!

Author's title

Author*Unverified author*
R Software Modulerwasp_autocorrelation.wasp
Title produced by software(Partial) Autocorrelation Function
Date of computationSat, 18 Oct 2014 19:18:07 +0100
Cite this page as followsStatistical Computations at FreeStatistics.org, Office for Research Development and Education, URL https://freestatistics.org/blog/index.php?v=date/2014/Oct/18/t1413656320xioidbf15ib5q2o.htm/, Retrieved Sun, 12 May 2024 18:11:08 +0000
Statistical Computations at FreeStatistics.org, Office for Research Development and Education, URL https://freestatistics.org/blog/index.php?pk=243548, Retrieved Sun, 12 May 2024 18:11:08 +0000
QR Codes:

Original text written by user:
IsPrivate?No (this computation is public)
User-defined keywords
Estimated Impact79
Family? (F = Feedback message, R = changed R code, M = changed R Module, P = changed Parameters, D = changed Data)
-       [(Partial) Autocorrelation Function] [] [2014-10-18 18:18:07] [09c39f9cdae305b47e6b113e2a46d5a6] [Current]
Feedback Forum

Post a new message
Dataseries X:
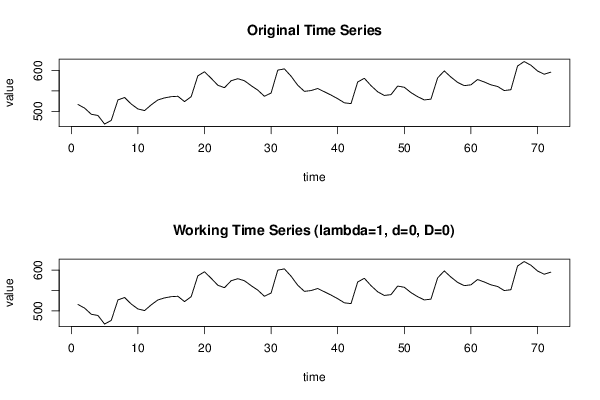
517
508
493
490
469
478
528
534
518
506
502
516
528
533
536
537
524
536
587
597
581
564
558
575
580
575
563
552
537
545
601
604
586
564
549
551
556
548
540
531
521
519
572
581
563
548
539
541
562
559
546
536
528
530
582
599
584
571
563
565
578
572
565
561
551
553
611
622
613
599
591
596


Summary of computational transaction
Raw Inputview raw input (R code)
Raw Outputview raw output of R engine
Computing time2 seconds
R Server'George Udny Yule' @ yule.wessa.net

\begin{tabular}{lllllllll}
\hline
Summary of computational transaction \tabularnewline
Raw Input & view raw input (R code)  \tabularnewline
Raw Output & view raw output of R engine  \tabularnewline
Computing time & 2 seconds \tabularnewline
R Server & 'George Udny Yule' @ yule.wessa.net \tabularnewline
\hline
\end{tabular}
%Source: https://freestatistics.org/blog/index.php?pk=243548&T=0

[TABLE]
[ROW][C]Summary of computational transaction[/C][/ROW]
[ROW][C]Raw Input[/C][C]view raw input (R code) [/C][/ROW]
[ROW][C]Raw Output[/C][C]view raw output of R engine [/C][/ROW]
[ROW][C]Computing time[/C][C]2 seconds[/C][/ROW]
[ROW][C]R Server[/C][C]'George Udny Yule' @ yule.wessa.net[/C][/ROW]
[/TABLE]
Source: https://freestatistics.org/blog/index.php?pk=243548&T=0

Globally Unique Identifier (entire table): ba.freestatistics.org/blog/index.php?pk=243548&T=0

As an alternative you can also use a QR Code:  

The GUIDs for individual cells are displayed in the table below:

Summary of computational transaction
Raw Inputview raw input (R code)
Raw Outputview raw output of R engine
Computing time2 seconds
R Server'George Udny Yule' @ yule.wessa.net


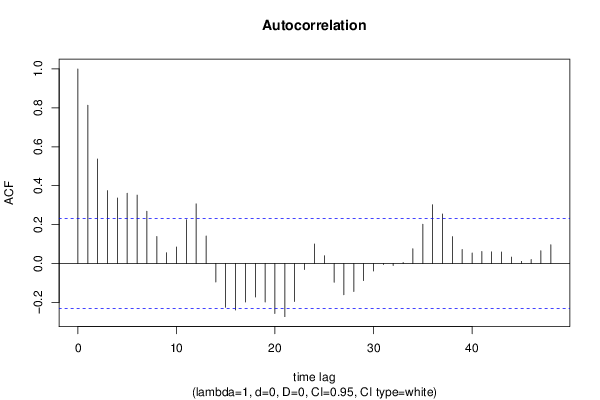
Autocorrelation Function
Time lag kACF(k)T-STATP-value
10.8133736.90170
20.5371044.55751e-05
30.3744013.17690.001097
40.3364912.85520.002807
50.3609583.06280.001541
60.3514192.98190.001953
70.2683662.27720.012874
80.1387831.17760.121414
90.0551890.46830.320494
100.0850680.72180.236369
110.2246531.90620.030305
120.3064262.60010.00565
130.1414821.20050.116937
14-0.095033-0.80640.211339
15-0.224859-1.9080.03019
16-0.239727-2.03410.022811
17-0.197961-1.67980.04867
18-0.172931-1.46740.073316
19-0.198019-1.68020.048622
20-0.257545-2.18530.016059
21-0.273483-2.32060.011573
22-0.195778-1.66120.050508
23-0.031164-0.26440.396099
240.1004930.85270.198324
250.0392380.33290.370072
26-0.09702-0.82320.206544
27-0.16056-1.36240.08866
28-0.144417-1.22540.112205
29-0.088137-0.74790.228489
30-0.038502-0.32670.372422
31-0.005124-0.04350.482721
32-0.010233-0.08680.465525
330.0052780.04480.482203
340.0757410.64270.261235
350.2017531.71190.045607
360.3019122.56180.006253
370.2543512.15820.017122
380.1381961.17260.122405
390.0714890.60660.273012
400.0539290.45760.324307
410.0618740.5250.300592
420.0594790.50470.307656
430.0589560.50030.30921
440.032510.27590.391725
450.0108230.09180.463542
460.0201070.17060.432502
470.0651390.55270.291082
480.0961440.81580.20865

\begin{tabular}{lllllllll}
\hline
Autocorrelation Function \tabularnewline
Time lag k & ACF(k) & T-STAT & P-value \tabularnewline
1 & 0.813373 & 6.9017 & 0 \tabularnewline
2 & 0.537104 & 4.5575 & 1e-05 \tabularnewline
3 & 0.374401 & 3.1769 & 0.001097 \tabularnewline
4 & 0.336491 & 2.8552 & 0.002807 \tabularnewline
5 & 0.360958 & 3.0628 & 0.001541 \tabularnewline
6 & 0.351419 & 2.9819 & 0.001953 \tabularnewline
7 & 0.268366 & 2.2772 & 0.012874 \tabularnewline
8 & 0.138783 & 1.1776 & 0.121414 \tabularnewline
9 & 0.055189 & 0.4683 & 0.320494 \tabularnewline
10 & 0.085068 & 0.7218 & 0.236369 \tabularnewline
11 & 0.224653 & 1.9062 & 0.030305 \tabularnewline
12 & 0.306426 & 2.6001 & 0.00565 \tabularnewline
13 & 0.141482 & 1.2005 & 0.116937 \tabularnewline
14 & -0.095033 & -0.8064 & 0.211339 \tabularnewline
15 & -0.224859 & -1.908 & 0.03019 \tabularnewline
16 & -0.239727 & -2.0341 & 0.022811 \tabularnewline
17 & -0.197961 & -1.6798 & 0.04867 \tabularnewline
18 & -0.172931 & -1.4674 & 0.073316 \tabularnewline
19 & -0.198019 & -1.6802 & 0.048622 \tabularnewline
20 & -0.257545 & -2.1853 & 0.016059 \tabularnewline
21 & -0.273483 & -2.3206 & 0.011573 \tabularnewline
22 & -0.195778 & -1.6612 & 0.050508 \tabularnewline
23 & -0.031164 & -0.2644 & 0.396099 \tabularnewline
24 & 0.100493 & 0.8527 & 0.198324 \tabularnewline
25 & 0.039238 & 0.3329 & 0.370072 \tabularnewline
26 & -0.09702 & -0.8232 & 0.206544 \tabularnewline
27 & -0.16056 & -1.3624 & 0.08866 \tabularnewline
28 & -0.144417 & -1.2254 & 0.112205 \tabularnewline
29 & -0.088137 & -0.7479 & 0.228489 \tabularnewline
30 & -0.038502 & -0.3267 & 0.372422 \tabularnewline
31 & -0.005124 & -0.0435 & 0.482721 \tabularnewline
32 & -0.010233 & -0.0868 & 0.465525 \tabularnewline
33 & 0.005278 & 0.0448 & 0.482203 \tabularnewline
34 & 0.075741 & 0.6427 & 0.261235 \tabularnewline
35 & 0.201753 & 1.7119 & 0.045607 \tabularnewline
36 & 0.301912 & 2.5618 & 0.006253 \tabularnewline
37 & 0.254351 & 2.1582 & 0.017122 \tabularnewline
38 & 0.138196 & 1.1726 & 0.122405 \tabularnewline
39 & 0.071489 & 0.6066 & 0.273012 \tabularnewline
40 & 0.053929 & 0.4576 & 0.324307 \tabularnewline
41 & 0.061874 & 0.525 & 0.300592 \tabularnewline
42 & 0.059479 & 0.5047 & 0.307656 \tabularnewline
43 & 0.058956 & 0.5003 & 0.30921 \tabularnewline
44 & 0.03251 & 0.2759 & 0.391725 \tabularnewline
45 & 0.010823 & 0.0918 & 0.463542 \tabularnewline
46 & 0.020107 & 0.1706 & 0.432502 \tabularnewline
47 & 0.065139 & 0.5527 & 0.291082 \tabularnewline
48 & 0.096144 & 0.8158 & 0.20865 \tabularnewline
\hline
\end{tabular}
%Source: https://freestatistics.org/blog/index.php?pk=243548&T=1

[TABLE]
[ROW][C]Autocorrelation Function[/C][/ROW]
[ROW][C]Time lag k[/C][C]ACF(k)[/C][C]T-STAT[/C][C]P-value[/C][/ROW]
[ROW][C]1[/C][C]0.813373[/C][C]6.9017[/C][C]0[/C][/ROW]
[ROW][C]2[/C][C]0.537104[/C][C]4.5575[/C][C]1e-05[/C][/ROW]
[ROW][C]3[/C][C]0.374401[/C][C]3.1769[/C][C]0.001097[/C][/ROW]
[ROW][C]4[/C][C]0.336491[/C][C]2.8552[/C][C]0.002807[/C][/ROW]
[ROW][C]5[/C][C]0.360958[/C][C]3.0628[/C][C]0.001541[/C][/ROW]
[ROW][C]6[/C][C]0.351419[/C][C]2.9819[/C][C]0.001953[/C][/ROW]
[ROW][C]7[/C][C]0.268366[/C][C]2.2772[/C][C]0.012874[/C][/ROW]
[ROW][C]8[/C][C]0.138783[/C][C]1.1776[/C][C]0.121414[/C][/ROW]
[ROW][C]9[/C][C]0.055189[/C][C]0.4683[/C][C]0.320494[/C][/ROW]
[ROW][C]10[/C][C]0.085068[/C][C]0.7218[/C][C]0.236369[/C][/ROW]
[ROW][C]11[/C][C]0.224653[/C][C]1.9062[/C][C]0.030305[/C][/ROW]
[ROW][C]12[/C][C]0.306426[/C][C]2.6001[/C][C]0.00565[/C][/ROW]
[ROW][C]13[/C][C]0.141482[/C][C]1.2005[/C][C]0.116937[/C][/ROW]
[ROW][C]14[/C][C]-0.095033[/C][C]-0.8064[/C][C]0.211339[/C][/ROW]
[ROW][C]15[/C][C]-0.224859[/C][C]-1.908[/C][C]0.03019[/C][/ROW]
[ROW][C]16[/C][C]-0.239727[/C][C]-2.0341[/C][C]0.022811[/C][/ROW]
[ROW][C]17[/C][C]-0.197961[/C][C]-1.6798[/C][C]0.04867[/C][/ROW]
[ROW][C]18[/C][C]-0.172931[/C][C]-1.4674[/C][C]0.073316[/C][/ROW]
[ROW][C]19[/C][C]-0.198019[/C][C]-1.6802[/C][C]0.048622[/C][/ROW]
[ROW][C]20[/C][C]-0.257545[/C][C]-2.1853[/C][C]0.016059[/C][/ROW]
[ROW][C]21[/C][C]-0.273483[/C][C]-2.3206[/C][C]0.011573[/C][/ROW]
[ROW][C]22[/C][C]-0.195778[/C][C]-1.6612[/C][C]0.050508[/C][/ROW]
[ROW][C]23[/C][C]-0.031164[/C][C]-0.2644[/C][C]0.396099[/C][/ROW]
[ROW][C]24[/C][C]0.100493[/C][C]0.8527[/C][C]0.198324[/C][/ROW]
[ROW][C]25[/C][C]0.039238[/C][C]0.3329[/C][C]0.370072[/C][/ROW]
[ROW][C]26[/C][C]-0.09702[/C][C]-0.8232[/C][C]0.206544[/C][/ROW]
[ROW][C]27[/C][C]-0.16056[/C][C]-1.3624[/C][C]0.08866[/C][/ROW]
[ROW][C]28[/C][C]-0.144417[/C][C]-1.2254[/C][C]0.112205[/C][/ROW]
[ROW][C]29[/C][C]-0.088137[/C][C]-0.7479[/C][C]0.228489[/C][/ROW]
[ROW][C]30[/C][C]-0.038502[/C][C]-0.3267[/C][C]0.372422[/C][/ROW]
[ROW][C]31[/C][C]-0.005124[/C][C]-0.0435[/C][C]0.482721[/C][/ROW]
[ROW][C]32[/C][C]-0.010233[/C][C]-0.0868[/C][C]0.465525[/C][/ROW]
[ROW][C]33[/C][C]0.005278[/C][C]0.0448[/C][C]0.482203[/C][/ROW]
[ROW][C]34[/C][C]0.075741[/C][C]0.6427[/C][C]0.261235[/C][/ROW]
[ROW][C]35[/C][C]0.201753[/C][C]1.7119[/C][C]0.045607[/C][/ROW]
[ROW][C]36[/C][C]0.301912[/C][C]2.5618[/C][C]0.006253[/C][/ROW]
[ROW][C]37[/C][C]0.254351[/C][C]2.1582[/C][C]0.017122[/C][/ROW]
[ROW][C]38[/C][C]0.138196[/C][C]1.1726[/C][C]0.122405[/C][/ROW]
[ROW][C]39[/C][C]0.071489[/C][C]0.6066[/C][C]0.273012[/C][/ROW]
[ROW][C]40[/C][C]0.053929[/C][C]0.4576[/C][C]0.324307[/C][/ROW]
[ROW][C]41[/C][C]0.061874[/C][C]0.525[/C][C]0.300592[/C][/ROW]
[ROW][C]42[/C][C]0.059479[/C][C]0.5047[/C][C]0.307656[/C][/ROW]
[ROW][C]43[/C][C]0.058956[/C][C]0.5003[/C][C]0.30921[/C][/ROW]
[ROW][C]44[/C][C]0.03251[/C][C]0.2759[/C][C]0.391725[/C][/ROW]
[ROW][C]45[/C][C]0.010823[/C][C]0.0918[/C][C]0.463542[/C][/ROW]
[ROW][C]46[/C][C]0.020107[/C][C]0.1706[/C][C]0.432502[/C][/ROW]
[ROW][C]47[/C][C]0.065139[/C][C]0.5527[/C][C]0.291082[/C][/ROW]
[ROW][C]48[/C][C]0.096144[/C][C]0.8158[/C][C]0.20865[/C][/ROW]
[/TABLE]
Source: https://freestatistics.org/blog/index.php?pk=243548&T=1

Globally Unique Identifier (entire table): ba.freestatistics.org/blog/index.php?pk=243548&T=1

As an alternative you can also use a QR Code:  

The GUIDs for individual cells are displayed in the table below:

Autocorrelation Function
Time lag kACF(k)T-STATP-value
10.8133736.90170
20.5371044.55751e-05
30.3744013.17690.001097
40.3364912.85520.002807
50.3609583.06280.001541
60.3514192.98190.001953
70.2683662.27720.012874
80.1387831.17760.121414
90.0551890.46830.320494
100.0850680.72180.236369
110.2246531.90620.030305
120.3064262.60010.00565
130.1414821.20050.116937
14-0.095033-0.80640.211339
15-0.224859-1.9080.03019
16-0.239727-2.03410.022811
17-0.197961-1.67980.04867
18-0.172931-1.46740.073316
19-0.198019-1.68020.048622
20-0.257545-2.18530.016059
21-0.273483-2.32060.011573
22-0.195778-1.66120.050508
23-0.031164-0.26440.396099
240.1004930.85270.198324
250.0392380.33290.370072
26-0.09702-0.82320.206544
27-0.16056-1.36240.08866
28-0.144417-1.22540.112205
29-0.088137-0.74790.228489
30-0.038502-0.32670.372422
31-0.005124-0.04350.482721
32-0.010233-0.08680.465525
330.0052780.04480.482203
340.0757410.64270.261235
350.2017531.71190.045607
360.3019122.56180.006253
370.2543512.15820.017122
380.1381961.17260.122405
390.0714890.60660.273012
400.0539290.45760.324307
410.0618740.5250.300592
420.0594790.50470.307656
430.0589560.50030.30921
440.032510.27590.391725
450.0108230.09180.463542
460.0201070.17060.432502
470.0651390.55270.291082
480.0961440.81580.20865


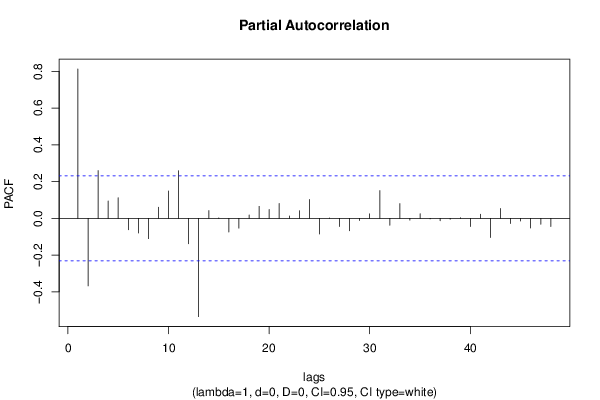
Partial Autocorrelation Function
Time lag kPACF(k)T-STATP-value
10.8133736.90170
2-0.367795-3.12080.001298
30.2597442.2040.015361
40.0940860.79830.213647
50.1125780.95530.171322
6-0.062019-0.52620.300168
7-0.079368-0.67350.251405
8-0.110375-0.93660.176057
90.0601880.51070.305557
100.1492561.26650.104712
110.2590372.1980.015583
12-0.13822-1.17280.122364
13-0.53512-4.54061.1e-05
140.0421440.35760.360843
150.0024710.0210.491663
16-0.074431-0.63160.264833
17-0.053112-0.45070.326792
180.0181890.15430.438886
190.0651370.55270.291089
200.0487140.41340.340287
210.0805280.68330.248304
220.0125920.10680.457605
230.0412730.35020.363601
240.1030670.87450.192364
25-0.085524-0.72570.235189
260.0015730.01330.494695
27-0.044547-0.3780.353273
28-0.067162-0.56990.285264
29-0.012174-0.10330.459006
300.0245690.20850.417724
310.1511961.28290.101814
32-0.03722-0.31580.376525
330.0804310.68250.248563
34-0.009799-0.08310.466983
350.025060.21260.416104
36-0.002751-0.02330.490721
37-0.013526-0.11480.454472
38-0.004967-0.04210.483248
390.0037950.03220.487201
40-0.044557-0.37810.353243
410.0219590.18630.426355
42-0.104348-0.88540.189438
430.0537780.45630.324765
44-0.028471-0.24160.404895
45-0.014003-0.11880.452876
46-0.052623-0.44650.328282
47-0.031729-0.26920.394261
48-0.043985-0.37320.355039

\begin{tabular}{lllllllll}
\hline
Partial Autocorrelation Function \tabularnewline
Time lag k & PACF(k) & T-STAT & P-value \tabularnewline
1 & 0.813373 & 6.9017 & 0 \tabularnewline
2 & -0.367795 & -3.1208 & 0.001298 \tabularnewline
3 & 0.259744 & 2.204 & 0.015361 \tabularnewline
4 & 0.094086 & 0.7983 & 0.213647 \tabularnewline
5 & 0.112578 & 0.9553 & 0.171322 \tabularnewline
6 & -0.062019 & -0.5262 & 0.300168 \tabularnewline
7 & -0.079368 & -0.6735 & 0.251405 \tabularnewline
8 & -0.110375 & -0.9366 & 0.176057 \tabularnewline
9 & 0.060188 & 0.5107 & 0.305557 \tabularnewline
10 & 0.149256 & 1.2665 & 0.104712 \tabularnewline
11 & 0.259037 & 2.198 & 0.015583 \tabularnewline
12 & -0.13822 & -1.1728 & 0.122364 \tabularnewline
13 & -0.53512 & -4.5406 & 1.1e-05 \tabularnewline
14 & 0.042144 & 0.3576 & 0.360843 \tabularnewline
15 & 0.002471 & 0.021 & 0.491663 \tabularnewline
16 & -0.074431 & -0.6316 & 0.264833 \tabularnewline
17 & -0.053112 & -0.4507 & 0.326792 \tabularnewline
18 & 0.018189 & 0.1543 & 0.438886 \tabularnewline
19 & 0.065137 & 0.5527 & 0.291089 \tabularnewline
20 & 0.048714 & 0.4134 & 0.340287 \tabularnewline
21 & 0.080528 & 0.6833 & 0.248304 \tabularnewline
22 & 0.012592 & 0.1068 & 0.457605 \tabularnewline
23 & 0.041273 & 0.3502 & 0.363601 \tabularnewline
24 & 0.103067 & 0.8745 & 0.192364 \tabularnewline
25 & -0.085524 & -0.7257 & 0.235189 \tabularnewline
26 & 0.001573 & 0.0133 & 0.494695 \tabularnewline
27 & -0.044547 & -0.378 & 0.353273 \tabularnewline
28 & -0.067162 & -0.5699 & 0.285264 \tabularnewline
29 & -0.012174 & -0.1033 & 0.459006 \tabularnewline
30 & 0.024569 & 0.2085 & 0.417724 \tabularnewline
31 & 0.151196 & 1.2829 & 0.101814 \tabularnewline
32 & -0.03722 & -0.3158 & 0.376525 \tabularnewline
33 & 0.080431 & 0.6825 & 0.248563 \tabularnewline
34 & -0.009799 & -0.0831 & 0.466983 \tabularnewline
35 & 0.02506 & 0.2126 & 0.416104 \tabularnewline
36 & -0.002751 & -0.0233 & 0.490721 \tabularnewline
37 & -0.013526 & -0.1148 & 0.454472 \tabularnewline
38 & -0.004967 & -0.0421 & 0.483248 \tabularnewline
39 & 0.003795 & 0.0322 & 0.487201 \tabularnewline
40 & -0.044557 & -0.3781 & 0.353243 \tabularnewline
41 & 0.021959 & 0.1863 & 0.426355 \tabularnewline
42 & -0.104348 & -0.8854 & 0.189438 \tabularnewline
43 & 0.053778 & 0.4563 & 0.324765 \tabularnewline
44 & -0.028471 & -0.2416 & 0.404895 \tabularnewline
45 & -0.014003 & -0.1188 & 0.452876 \tabularnewline
46 & -0.052623 & -0.4465 & 0.328282 \tabularnewline
47 & -0.031729 & -0.2692 & 0.394261 \tabularnewline
48 & -0.043985 & -0.3732 & 0.355039 \tabularnewline
\hline
\end{tabular}
%Source: https://freestatistics.org/blog/index.php?pk=243548&T=2

[TABLE]
[ROW][C]Partial Autocorrelation Function[/C][/ROW]
[ROW][C]Time lag k[/C][C]PACF(k)[/C][C]T-STAT[/C][C]P-value[/C][/ROW]
[ROW][C]1[/C][C]0.813373[/C][C]6.9017[/C][C]0[/C][/ROW]
[ROW][C]2[/C][C]-0.367795[/C][C]-3.1208[/C][C]0.001298[/C][/ROW]
[ROW][C]3[/C][C]0.259744[/C][C]2.204[/C][C]0.015361[/C][/ROW]
[ROW][C]4[/C][C]0.094086[/C][C]0.7983[/C][C]0.213647[/C][/ROW]
[ROW][C]5[/C][C]0.112578[/C][C]0.9553[/C][C]0.171322[/C][/ROW]
[ROW][C]6[/C][C]-0.062019[/C][C]-0.5262[/C][C]0.300168[/C][/ROW]
[ROW][C]7[/C][C]-0.079368[/C][C]-0.6735[/C][C]0.251405[/C][/ROW]
[ROW][C]8[/C][C]-0.110375[/C][C]-0.9366[/C][C]0.176057[/C][/ROW]
[ROW][C]9[/C][C]0.060188[/C][C]0.5107[/C][C]0.305557[/C][/ROW]
[ROW][C]10[/C][C]0.149256[/C][C]1.2665[/C][C]0.104712[/C][/ROW]
[ROW][C]11[/C][C]0.259037[/C][C]2.198[/C][C]0.015583[/C][/ROW]
[ROW][C]12[/C][C]-0.13822[/C][C]-1.1728[/C][C]0.122364[/C][/ROW]
[ROW][C]13[/C][C]-0.53512[/C][C]-4.5406[/C][C]1.1e-05[/C][/ROW]
[ROW][C]14[/C][C]0.042144[/C][C]0.3576[/C][C]0.360843[/C][/ROW]
[ROW][C]15[/C][C]0.002471[/C][C]0.021[/C][C]0.491663[/C][/ROW]
[ROW][C]16[/C][C]-0.074431[/C][C]-0.6316[/C][C]0.264833[/C][/ROW]
[ROW][C]17[/C][C]-0.053112[/C][C]-0.4507[/C][C]0.326792[/C][/ROW]
[ROW][C]18[/C][C]0.018189[/C][C]0.1543[/C][C]0.438886[/C][/ROW]
[ROW][C]19[/C][C]0.065137[/C][C]0.5527[/C][C]0.291089[/C][/ROW]
[ROW][C]20[/C][C]0.048714[/C][C]0.4134[/C][C]0.340287[/C][/ROW]
[ROW][C]21[/C][C]0.080528[/C][C]0.6833[/C][C]0.248304[/C][/ROW]
[ROW][C]22[/C][C]0.012592[/C][C]0.1068[/C][C]0.457605[/C][/ROW]
[ROW][C]23[/C][C]0.041273[/C][C]0.3502[/C][C]0.363601[/C][/ROW]
[ROW][C]24[/C][C]0.103067[/C][C]0.8745[/C][C]0.192364[/C][/ROW]
[ROW][C]25[/C][C]-0.085524[/C][C]-0.7257[/C][C]0.235189[/C][/ROW]
[ROW][C]26[/C][C]0.001573[/C][C]0.0133[/C][C]0.494695[/C][/ROW]
[ROW][C]27[/C][C]-0.044547[/C][C]-0.378[/C][C]0.353273[/C][/ROW]
[ROW][C]28[/C][C]-0.067162[/C][C]-0.5699[/C][C]0.285264[/C][/ROW]
[ROW][C]29[/C][C]-0.012174[/C][C]-0.1033[/C][C]0.459006[/C][/ROW]
[ROW][C]30[/C][C]0.024569[/C][C]0.2085[/C][C]0.417724[/C][/ROW]
[ROW][C]31[/C][C]0.151196[/C][C]1.2829[/C][C]0.101814[/C][/ROW]
[ROW][C]32[/C][C]-0.03722[/C][C]-0.3158[/C][C]0.376525[/C][/ROW]
[ROW][C]33[/C][C]0.080431[/C][C]0.6825[/C][C]0.248563[/C][/ROW]
[ROW][C]34[/C][C]-0.009799[/C][C]-0.0831[/C][C]0.466983[/C][/ROW]
[ROW][C]35[/C][C]0.02506[/C][C]0.2126[/C][C]0.416104[/C][/ROW]
[ROW][C]36[/C][C]-0.002751[/C][C]-0.0233[/C][C]0.490721[/C][/ROW]
[ROW][C]37[/C][C]-0.013526[/C][C]-0.1148[/C][C]0.454472[/C][/ROW]
[ROW][C]38[/C][C]-0.004967[/C][C]-0.0421[/C][C]0.483248[/C][/ROW]
[ROW][C]39[/C][C]0.003795[/C][C]0.0322[/C][C]0.487201[/C][/ROW]
[ROW][C]40[/C][C]-0.044557[/C][C]-0.3781[/C][C]0.353243[/C][/ROW]
[ROW][C]41[/C][C]0.021959[/C][C]0.1863[/C][C]0.426355[/C][/ROW]
[ROW][C]42[/C][C]-0.104348[/C][C]-0.8854[/C][C]0.189438[/C][/ROW]
[ROW][C]43[/C][C]0.053778[/C][C]0.4563[/C][C]0.324765[/C][/ROW]
[ROW][C]44[/C][C]-0.028471[/C][C]-0.2416[/C][C]0.404895[/C][/ROW]
[ROW][C]45[/C][C]-0.014003[/C][C]-0.1188[/C][C]0.452876[/C][/ROW]
[ROW][C]46[/C][C]-0.052623[/C][C]-0.4465[/C][C]0.328282[/C][/ROW]
[ROW][C]47[/C][C]-0.031729[/C][C]-0.2692[/C][C]0.394261[/C][/ROW]
[ROW][C]48[/C][C]-0.043985[/C][C]-0.3732[/C][C]0.355039[/C][/ROW]
[/TABLE]
Source: https://freestatistics.org/blog/index.php?pk=243548&T=2

Globally Unique Identifier (entire table): ba.freestatistics.org/blog/index.php?pk=243548&T=2

As an alternative you can also use a QR Code:  

The GUIDs for individual cells are displayed in the table below:

Partial Autocorrelation Function
Time lag kPACF(k)T-STATP-value
10.8133736.90170
2-0.367795-3.12080.001298
30.2597442.2040.015361
40.0940860.79830.213647
50.1125780.95530.171322
6-0.062019-0.52620.300168
7-0.079368-0.67350.251405
8-0.110375-0.93660.176057
90.0601880.51070.305557
100.1492561.26650.104712
110.2590372.1980.015583
12-0.13822-1.17280.122364
13-0.53512-4.54061.1e-05
140.0421440.35760.360843
150.0024710.0210.491663
16-0.074431-0.63160.264833
17-0.053112-0.45070.326792
180.0181890.15430.438886
190.0651370.55270.291089
200.0487140.41340.340287
210.0805280.68330.248304
220.0125920.10680.457605
230.0412730.35020.363601
240.1030670.87450.192364
25-0.085524-0.72570.235189
260.0015730.01330.494695
27-0.044547-0.3780.353273
28-0.067162-0.56990.285264
29-0.012174-0.10330.459006
300.0245690.20850.417724
310.1511961.28290.101814
32-0.03722-0.31580.376525
330.0804310.68250.248563
34-0.009799-0.08310.466983
350.025060.21260.416104
36-0.002751-0.02330.490721
37-0.013526-0.11480.454472
38-0.004967-0.04210.483248
390.0037950.03220.487201
40-0.044557-0.37810.353243
410.0219590.18630.426355
42-0.104348-0.88540.189438
430.0537780.45630.324765
44-0.028471-0.24160.404895
45-0.014003-0.11880.452876
46-0.052623-0.44650.328282
47-0.031729-0.26920.394261
48-0.043985-0.37320.355039


Parameters (Session):
par1 = 48 ; par2 = 1 ; par3 = 0 ; par4 = 0 ; par5 = 12 ; par6 = White Noise ; par7 = 0.95 ;
Parameters (R input):
par1 = 48 ; par2 = 1 ; par3 = 0 ; par4 = 0 ; par5 = 12 ; par6 = White Noise ; par7 = 0.95 ; par8 = ;
R code (references can be found in the software module):
if (par1 == 'Default') {
par1 = 10*log10(length(x))
} else {
par1 <- as.numeric(par1)
}
par2 <- as.numeric(par2)
par3 <- as.numeric(par3)
par4 <- as.numeric(par4)
par5 <- as.numeric(par5)
if (par6 == 'White Noise') par6 <- 'white' else par6 <- 'ma'
par7 <- as.numeric(par7)
if (par8 != '') par8 <- as.numeric(par8)
ox <- x
if (par8 == '') {
if (par2 == 0) {
x <- log(x)
} else {
x <- (x ^ par2 - 1) / par2
}
} else {
x <- log(x,base=par8)
}
if (par3 > 0) x <- diff(x,lag=1,difference=par3)
if (par4 > 0) x <- diff(x,lag=par5,difference=par4)
bitmap(file='picts.png')
op <- par(mfrow=c(2,1))
plot(ox,type='l',main='Original Time Series',xlab='time',ylab='value')
if (par8=='') {
mytitle <- paste('Working Time Series (lambda=',par2,', d=',par3,', D=',par4,')',sep='')
mysub <- paste('(lambda=',par2,', d=',par3,', D=',par4,', CI=', par7, ', CI type=',par6,')',sep='')
} else {
mytitle <- paste('Working Time Series (base=',par8,', d=',par3,', D=',par4,')',sep='')
mysub <- paste('(base=',par8,', d=',par3,', D=',par4,', CI=', par7, ', CI type=',par6,')',sep='')
}
plot(x,type='l', main=mytitle,xlab='time',ylab='value')
par(op)
dev.off()
bitmap(file='pic1.png')
racf <- acf(x, par1, main='Autocorrelation', xlab='time lag', ylab='ACF', ci.type=par6, ci=par7, sub=mysub)
dev.off()
bitmap(file='pic2.png')
rpacf <- pacf(x,par1,main='Partial Autocorrelation',xlab='lags',ylab='PACF',sub=mysub)
dev.off()
(myacf <- c(racf$acf))
(mypacf <- c(rpacf$acf))
lengthx <- length(x)
sqrtn <- sqrt(lengthx)
load(file='createtable')
a<-table.start()
a<-table.row.start(a)
a<-table.element(a,'Autocorrelation Function',4,TRUE)
a<-table.row.end(a)
a<-table.row.start(a)
a<-table.element(a,'Time lag k',header=TRUE)
a<-table.element(a,hyperlink('basics.htm','ACF(k)','click here for more information about the Autocorrelation Function'),header=TRUE)
a<-table.element(a,'T-STAT',header=TRUE)
a<-table.element(a,'P-value',header=TRUE)
a<-table.row.end(a)
for (i in 2:(par1+1)) {
a<-table.row.start(a)
a<-table.element(a,i-1,header=TRUE)
a<-table.element(a,round(myacf[i],6))
mytstat <- myacf[i]*sqrtn
a<-table.element(a,round(mytstat,4))
a<-table.element(a,round(1-pt(abs(mytstat),lengthx),6))
a<-table.row.end(a)
}
a<-table.end(a)
table.save(a,file='mytable.tab')
a<-table.start()
a<-table.row.start(a)
a<-table.element(a,'Partial Autocorrelation Function',4,TRUE)
a<-table.row.end(a)
a<-table.row.start(a)
a<-table.element(a,'Time lag k',header=TRUE)
a<-table.element(a,hyperlink('basics.htm','PACF(k)','click here for more information about the Partial Autocorrelation Function'),header=TRUE)
a<-table.element(a,'T-STAT',header=TRUE)
a<-table.element(a,'P-value',header=TRUE)
a<-table.row.end(a)
for (i in 1:par1) {
a<-table.row.start(a)
a<-table.element(a,i,header=TRUE)
a<-table.element(a,round(mypacf[i],6))
mytstat <- mypacf[i]*sqrtn
a<-table.element(a,round(mytstat,4))
a<-table.element(a,round(1-pt(abs(mytstat),lengthx),6))
a<-table.row.end(a)
}
a<-table.end(a)
table.save(a,file='mytable1.tab')