Free Statistics

of Irreproducible Research!

Author's title

Author*Unverified author*
R Software Modulerwasp_autocorrelation.wasp
Title produced by software(Partial) Autocorrelation Function
Date of computationSat, 18 Oct 2014 19:04:52 +0100
Cite this page as followsStatistical Computations at FreeStatistics.org, Office for Research Development and Education, URL https://freestatistics.org/blog/index.php?v=date/2014/Oct/18/t1413655662nt22wyv7zpfap8d.htm/, Retrieved Mon, 13 May 2024 02:52:09 +0000
Statistical Computations at FreeStatistics.org, Office for Research Development and Education, URL https://freestatistics.org/blog/index.php?pk=243546, Retrieved Mon, 13 May 2024 02:52:09 +0000
QR Codes:

Original text written by user:
IsPrivate?No (this computation is public)
User-defined keywords
Estimated Impact72
Family? (F = Feedback message, R = changed R code, M = changed R Module, P = changed Parameters, D = changed Data)
-       [(Partial) Autocorrelation Function] [] [2014-10-18 18:04:52] [beda3c52974d0e45a2203fe962302ec0] [Current]
Feedback Forum

Post a new message
Dataseries X:
101.1
101.35
101.45
101.49
101.68
101.92
102.04
102.55
104.02
105.41
105.48
105.54
105.16
105.16
105.16
105.16
105.16
105.17
105.17
105.54
106.9
107.27
107.31
107.39
107.41
107.46
113.14
117
119.28
119.39
119.5
119.67
119.67
119.73
119.77
119.77
119.78
119.78
119.78
121.28
122.44
122.72
122.75
122.8
122.81
122.83
122.83
122.83
122.84
122.85
123.61
124.74
125.1
125.29
125.45
125.51
125.55
125.57
125.81
127.41
127.75
127.76
127.8
128.23
130.01
130.07
130.17
130.21
130.22
130.23
130.23
130.23
130.23
130.24
130.13
130.14
130.79
131.38
131.61
131.72
131.89
131.89
131.96
131.99
132
132.06
132.11
132.88
135.48
136.56
136.96
137.4
138.32
138.82
138.96
138.94
139
139.19
139.22
139.37
140.74
141.17
141.51
142.94
144.81
145.41
146.11
146.23


Summary of computational transaction
Raw Inputview raw input (R code)
Raw Outputview raw output of R engine
Computing time1 seconds
R Server'Sir Maurice George Kendall' @ kendall.wessa.net

\begin{tabular}{lllllllll}
\hline
Summary of computational transaction \tabularnewline
Raw Input & view raw input (R code)  \tabularnewline
Raw Output & view raw output of R engine  \tabularnewline
Computing time & 1 seconds \tabularnewline
R Server & 'Sir Maurice George Kendall' @ kendall.wessa.net \tabularnewline
\hline
\end{tabular}
%Source: https://freestatistics.org/blog/index.php?pk=243546&T=0

[TABLE]
[ROW][C]Summary of computational transaction[/C][/ROW]
[ROW][C]Raw Input[/C][C]view raw input (R code) [/C][/ROW]
[ROW][C]Raw Output[/C][C]view raw output of R engine [/C][/ROW]
[ROW][C]Computing time[/C][C]1 seconds[/C][/ROW]
[ROW][C]R Server[/C][C]'Sir Maurice George Kendall' @ kendall.wessa.net[/C][/ROW]
[/TABLE]
Source: https://freestatistics.org/blog/index.php?pk=243546&T=0

Globally Unique Identifier (entire table): ba.freestatistics.org/blog/index.php?pk=243546&T=0

As an alternative you can also use a QR Code:  

The GUIDs for individual cells are displayed in the table below:

Summary of computational transaction
Raw Inputview raw input (R code)
Raw Outputview raw output of R engine
Computing time1 seconds
R Server'Sir Maurice George Kendall' @ kendall.wessa.net


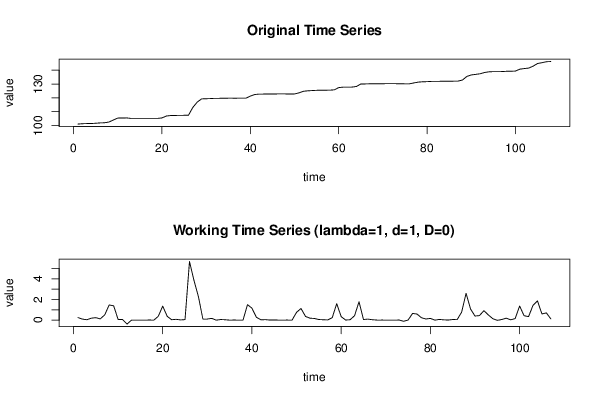
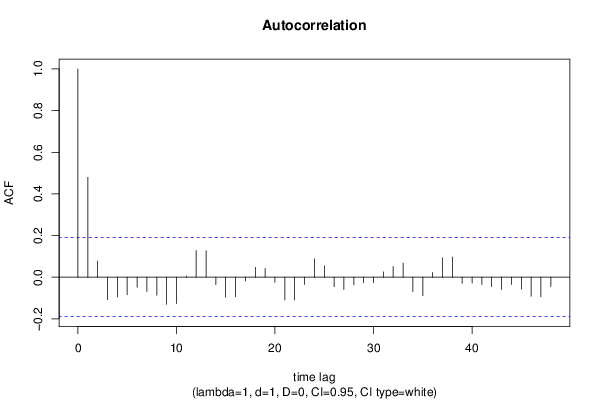
Autocorrelation Function
Time lag kACF(k)T-STATP-value
10.4794864.95981e-06
20.0774310.8010.212466
3-0.107915-1.11630.133401
4-0.095348-0.98630.163108
5-0.083994-0.86880.19344
6-0.048322-0.49980.309104
7-0.068093-0.70440.241368
8-0.086023-0.88980.187776
9-0.129676-1.34140.091319
10-0.126427-1.30780.096877
110.005270.05450.478314
120.1278351.32230.094437
130.1271771.31550.095572
14-0.035318-0.36530.357793
15-0.095855-0.99150.161832
16-0.09368-0.9690.167357
17-0.018578-0.19220.423984
180.0473760.49010.312546
190.0417590.4320.333322
20-0.024608-0.25450.399783
21-0.109153-1.12910.130693
22-0.109081-1.12830.130849
23-0.03532-0.36540.357784
240.0882860.91320.181584
250.0544160.56290.287347
26-0.04536-0.46920.319939
27-0.059538-0.61590.269646
28-0.036027-0.37270.355068
29-0.026726-0.27650.391365
30-0.026796-0.27720.391089
310.025430.26310.396507
320.0510990.52860.299099
330.0676610.69990.242758
34-0.068492-0.70850.240091
35-0.088429-0.91470.181198
360.02250.23270.408202
370.092780.95970.16968
380.0964030.99720.160458
39-0.029486-0.3050.380476
40-0.027565-0.28510.388046
41-0.034393-0.35580.361359
42-0.045408-0.46970.319763
43-0.05922-0.61260.270727
44-0.035097-0.3630.358644
45-0.057171-0.59140.277757
46-0.091893-0.95060.171987
47-0.094151-0.97390.16615
48-0.044501-0.46030.323111

\begin{tabular}{lllllllll}
\hline
Autocorrelation Function \tabularnewline
Time lag k & ACF(k) & T-STAT & P-value \tabularnewline
1 & 0.479486 & 4.9598 & 1e-06 \tabularnewline
2 & 0.077431 & 0.801 & 0.212466 \tabularnewline
3 & -0.107915 & -1.1163 & 0.133401 \tabularnewline
4 & -0.095348 & -0.9863 & 0.163108 \tabularnewline
5 & -0.083994 & -0.8688 & 0.19344 \tabularnewline
6 & -0.048322 & -0.4998 & 0.309104 \tabularnewline
7 & -0.068093 & -0.7044 & 0.241368 \tabularnewline
8 & -0.086023 & -0.8898 & 0.187776 \tabularnewline
9 & -0.129676 & -1.3414 & 0.091319 \tabularnewline
10 & -0.126427 & -1.3078 & 0.096877 \tabularnewline
11 & 0.00527 & 0.0545 & 0.478314 \tabularnewline
12 & 0.127835 & 1.3223 & 0.094437 \tabularnewline
13 & 0.127177 & 1.3155 & 0.095572 \tabularnewline
14 & -0.035318 & -0.3653 & 0.357793 \tabularnewline
15 & -0.095855 & -0.9915 & 0.161832 \tabularnewline
16 & -0.09368 & -0.969 & 0.167357 \tabularnewline
17 & -0.018578 & -0.1922 & 0.423984 \tabularnewline
18 & 0.047376 & 0.4901 & 0.312546 \tabularnewline
19 & 0.041759 & 0.432 & 0.333322 \tabularnewline
20 & -0.024608 & -0.2545 & 0.399783 \tabularnewline
21 & -0.109153 & -1.1291 & 0.130693 \tabularnewline
22 & -0.109081 & -1.1283 & 0.130849 \tabularnewline
23 & -0.03532 & -0.3654 & 0.357784 \tabularnewline
24 & 0.088286 & 0.9132 & 0.181584 \tabularnewline
25 & 0.054416 & 0.5629 & 0.287347 \tabularnewline
26 & -0.04536 & -0.4692 & 0.319939 \tabularnewline
27 & -0.059538 & -0.6159 & 0.269646 \tabularnewline
28 & -0.036027 & -0.3727 & 0.355068 \tabularnewline
29 & -0.026726 & -0.2765 & 0.391365 \tabularnewline
30 & -0.026796 & -0.2772 & 0.391089 \tabularnewline
31 & 0.02543 & 0.2631 & 0.396507 \tabularnewline
32 & 0.051099 & 0.5286 & 0.299099 \tabularnewline
33 & 0.067661 & 0.6999 & 0.242758 \tabularnewline
34 & -0.068492 & -0.7085 & 0.240091 \tabularnewline
35 & -0.088429 & -0.9147 & 0.181198 \tabularnewline
36 & 0.0225 & 0.2327 & 0.408202 \tabularnewline
37 & 0.09278 & 0.9597 & 0.16968 \tabularnewline
38 & 0.096403 & 0.9972 & 0.160458 \tabularnewline
39 & -0.029486 & -0.305 & 0.380476 \tabularnewline
40 & -0.027565 & -0.2851 & 0.388046 \tabularnewline
41 & -0.034393 & -0.3558 & 0.361359 \tabularnewline
42 & -0.045408 & -0.4697 & 0.319763 \tabularnewline
43 & -0.05922 & -0.6126 & 0.270727 \tabularnewline
44 & -0.035097 & -0.363 & 0.358644 \tabularnewline
45 & -0.057171 & -0.5914 & 0.277757 \tabularnewline
46 & -0.091893 & -0.9506 & 0.171987 \tabularnewline
47 & -0.094151 & -0.9739 & 0.16615 \tabularnewline
48 & -0.044501 & -0.4603 & 0.323111 \tabularnewline
\hline
\end{tabular}
%Source: https://freestatistics.org/blog/index.php?pk=243546&T=1

[TABLE]
[ROW][C]Autocorrelation Function[/C][/ROW]
[ROW][C]Time lag k[/C][C]ACF(k)[/C][C]T-STAT[/C][C]P-value[/C][/ROW]
[ROW][C]1[/C][C]0.479486[/C][C]4.9598[/C][C]1e-06[/C][/ROW]
[ROW][C]2[/C][C]0.077431[/C][C]0.801[/C][C]0.212466[/C][/ROW]
[ROW][C]3[/C][C]-0.107915[/C][C]-1.1163[/C][C]0.133401[/C][/ROW]
[ROW][C]4[/C][C]-0.095348[/C][C]-0.9863[/C][C]0.163108[/C][/ROW]
[ROW][C]5[/C][C]-0.083994[/C][C]-0.8688[/C][C]0.19344[/C][/ROW]
[ROW][C]6[/C][C]-0.048322[/C][C]-0.4998[/C][C]0.309104[/C][/ROW]
[ROW][C]7[/C][C]-0.068093[/C][C]-0.7044[/C][C]0.241368[/C][/ROW]
[ROW][C]8[/C][C]-0.086023[/C][C]-0.8898[/C][C]0.187776[/C][/ROW]
[ROW][C]9[/C][C]-0.129676[/C][C]-1.3414[/C][C]0.091319[/C][/ROW]
[ROW][C]10[/C][C]-0.126427[/C][C]-1.3078[/C][C]0.096877[/C][/ROW]
[ROW][C]11[/C][C]0.00527[/C][C]0.0545[/C][C]0.478314[/C][/ROW]
[ROW][C]12[/C][C]0.127835[/C][C]1.3223[/C][C]0.094437[/C][/ROW]
[ROW][C]13[/C][C]0.127177[/C][C]1.3155[/C][C]0.095572[/C][/ROW]
[ROW][C]14[/C][C]-0.035318[/C][C]-0.3653[/C][C]0.357793[/C][/ROW]
[ROW][C]15[/C][C]-0.095855[/C][C]-0.9915[/C][C]0.161832[/C][/ROW]
[ROW][C]16[/C][C]-0.09368[/C][C]-0.969[/C][C]0.167357[/C][/ROW]
[ROW][C]17[/C][C]-0.018578[/C][C]-0.1922[/C][C]0.423984[/C][/ROW]
[ROW][C]18[/C][C]0.047376[/C][C]0.4901[/C][C]0.312546[/C][/ROW]
[ROW][C]19[/C][C]0.041759[/C][C]0.432[/C][C]0.333322[/C][/ROW]
[ROW][C]20[/C][C]-0.024608[/C][C]-0.2545[/C][C]0.399783[/C][/ROW]
[ROW][C]21[/C][C]-0.109153[/C][C]-1.1291[/C][C]0.130693[/C][/ROW]
[ROW][C]22[/C][C]-0.109081[/C][C]-1.1283[/C][C]0.130849[/C][/ROW]
[ROW][C]23[/C][C]-0.03532[/C][C]-0.3654[/C][C]0.357784[/C][/ROW]
[ROW][C]24[/C][C]0.088286[/C][C]0.9132[/C][C]0.181584[/C][/ROW]
[ROW][C]25[/C][C]0.054416[/C][C]0.5629[/C][C]0.287347[/C][/ROW]
[ROW][C]26[/C][C]-0.04536[/C][C]-0.4692[/C][C]0.319939[/C][/ROW]
[ROW][C]27[/C][C]-0.059538[/C][C]-0.6159[/C][C]0.269646[/C][/ROW]
[ROW][C]28[/C][C]-0.036027[/C][C]-0.3727[/C][C]0.355068[/C][/ROW]
[ROW][C]29[/C][C]-0.026726[/C][C]-0.2765[/C][C]0.391365[/C][/ROW]
[ROW][C]30[/C][C]-0.026796[/C][C]-0.2772[/C][C]0.391089[/C][/ROW]
[ROW][C]31[/C][C]0.02543[/C][C]0.2631[/C][C]0.396507[/C][/ROW]
[ROW][C]32[/C][C]0.051099[/C][C]0.5286[/C][C]0.299099[/C][/ROW]
[ROW][C]33[/C][C]0.067661[/C][C]0.6999[/C][C]0.242758[/C][/ROW]
[ROW][C]34[/C][C]-0.068492[/C][C]-0.7085[/C][C]0.240091[/C][/ROW]
[ROW][C]35[/C][C]-0.088429[/C][C]-0.9147[/C][C]0.181198[/C][/ROW]
[ROW][C]36[/C][C]0.0225[/C][C]0.2327[/C][C]0.408202[/C][/ROW]
[ROW][C]37[/C][C]0.09278[/C][C]0.9597[/C][C]0.16968[/C][/ROW]
[ROW][C]38[/C][C]0.096403[/C][C]0.9972[/C][C]0.160458[/C][/ROW]
[ROW][C]39[/C][C]-0.029486[/C][C]-0.305[/C][C]0.380476[/C][/ROW]
[ROW][C]40[/C][C]-0.027565[/C][C]-0.2851[/C][C]0.388046[/C][/ROW]
[ROW][C]41[/C][C]-0.034393[/C][C]-0.3558[/C][C]0.361359[/C][/ROW]
[ROW][C]42[/C][C]-0.045408[/C][C]-0.4697[/C][C]0.319763[/C][/ROW]
[ROW][C]43[/C][C]-0.05922[/C][C]-0.6126[/C][C]0.270727[/C][/ROW]
[ROW][C]44[/C][C]-0.035097[/C][C]-0.363[/C][C]0.358644[/C][/ROW]
[ROW][C]45[/C][C]-0.057171[/C][C]-0.5914[/C][C]0.277757[/C][/ROW]
[ROW][C]46[/C][C]-0.091893[/C][C]-0.9506[/C][C]0.171987[/C][/ROW]
[ROW][C]47[/C][C]-0.094151[/C][C]-0.9739[/C][C]0.16615[/C][/ROW]
[ROW][C]48[/C][C]-0.044501[/C][C]-0.4603[/C][C]0.323111[/C][/ROW]
[/TABLE]
Source: https://freestatistics.org/blog/index.php?pk=243546&T=1

Globally Unique Identifier (entire table): ba.freestatistics.org/blog/index.php?pk=243546&T=1

As an alternative you can also use a QR Code:  

The GUIDs for individual cells are displayed in the table below:

Autocorrelation Function
Time lag kACF(k)T-STATP-value
10.4794864.95981e-06
20.0774310.8010.212466
3-0.107915-1.11630.133401
4-0.095348-0.98630.163108
5-0.083994-0.86880.19344
6-0.048322-0.49980.309104
7-0.068093-0.70440.241368
8-0.086023-0.88980.187776
9-0.129676-1.34140.091319
10-0.126427-1.30780.096877
110.005270.05450.478314
120.1278351.32230.094437
130.1271771.31550.095572
14-0.035318-0.36530.357793
15-0.095855-0.99150.161832
16-0.09368-0.9690.167357
17-0.018578-0.19220.423984
180.0473760.49010.312546
190.0417590.4320.333322
20-0.024608-0.25450.399783
21-0.109153-1.12910.130693
22-0.109081-1.12830.130849
23-0.03532-0.36540.357784
240.0882860.91320.181584
250.0544160.56290.287347
26-0.04536-0.46920.319939
27-0.059538-0.61590.269646
28-0.036027-0.37270.355068
29-0.026726-0.27650.391365
30-0.026796-0.27720.391089
310.025430.26310.396507
320.0510990.52860.299099
330.0676610.69990.242758
34-0.068492-0.70850.240091
35-0.088429-0.91470.181198
360.02250.23270.408202
370.092780.95970.16968
380.0964030.99720.160458
39-0.029486-0.3050.380476
40-0.027565-0.28510.388046
41-0.034393-0.35580.361359
42-0.045408-0.46970.319763
43-0.05922-0.61260.270727
44-0.035097-0.3630.358644
45-0.057171-0.59140.277757
46-0.091893-0.95060.171987
47-0.094151-0.97390.16615
48-0.044501-0.46030.323111


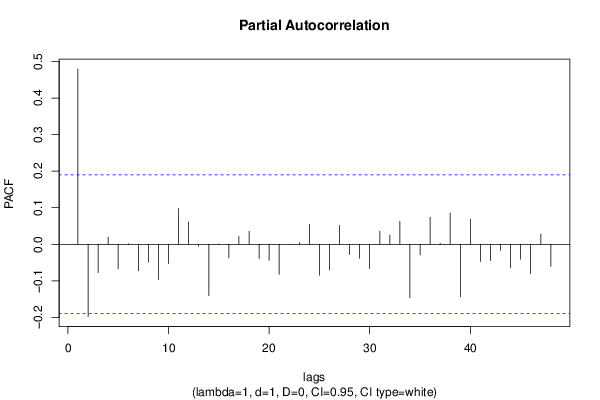
Partial Autocorrelation Function
Time lag kPACF(k)T-STATP-value
10.4794864.95981e-06
2-0.197996-2.04810.0215
3-0.077655-0.80330.2118
40.0191630.19820.421623
5-0.066827-0.69130.245447
60.0013610.01410.494398
7-0.072057-0.74540.228845
8-0.049332-0.51030.305449
9-0.096449-0.99770.160345
10-0.052565-0.54370.293876
110.0978231.01190.156937
120.0609090.630.265005
13-0.005501-0.05690.477365
14-0.140404-1.45240.074665
150.0006650.00690.497263
16-0.037329-0.38610.35008
170.0213810.22120.412693
180.0353050.36520.357842
19-0.03876-0.40090.344634
20-0.043582-0.45080.326516
21-0.081939-0.84760.19928
22-0.000278-0.00290.498855
230.0050080.05180.479392
240.0546550.56540.286507
25-0.084911-0.87830.190869
26-0.070197-0.72610.234676
270.0511740.52930.298831
28-0.02813-0.2910.385816
29-0.038077-0.39390.347228
30-0.066502-0.68790.2465
310.0356630.36890.356466
320.025260.26130.397186
330.0631020.65270.257666
34-0.146223-1.51250.066673
35-0.029113-0.30120.381941
360.0737370.76270.223647
370.0023790.02460.490208
380.0856330.88580.188857
39-0.143356-1.48290.070522
400.0682810.70630.240766
41-0.047081-0.4870.313623
42-0.044388-0.45920.323528
43-0.016977-0.17560.430467
44-0.064374-0.66590.253456
45-0.040743-0.42140.337136
46-0.079975-0.82730.204964
470.0279070.28870.386694
48-0.06052-0.6260.266318

\begin{tabular}{lllllllll}
\hline
Partial Autocorrelation Function \tabularnewline
Time lag k & PACF(k) & T-STAT & P-value \tabularnewline
1 & 0.479486 & 4.9598 & 1e-06 \tabularnewline
2 & -0.197996 & -2.0481 & 0.0215 \tabularnewline
3 & -0.077655 & -0.8033 & 0.2118 \tabularnewline
4 & 0.019163 & 0.1982 & 0.421623 \tabularnewline
5 & -0.066827 & -0.6913 & 0.245447 \tabularnewline
6 & 0.001361 & 0.0141 & 0.494398 \tabularnewline
7 & -0.072057 & -0.7454 & 0.228845 \tabularnewline
8 & -0.049332 & -0.5103 & 0.305449 \tabularnewline
9 & -0.096449 & -0.9977 & 0.160345 \tabularnewline
10 & -0.052565 & -0.5437 & 0.293876 \tabularnewline
11 & 0.097823 & 1.0119 & 0.156937 \tabularnewline
12 & 0.060909 & 0.63 & 0.265005 \tabularnewline
13 & -0.005501 & -0.0569 & 0.477365 \tabularnewline
14 & -0.140404 & -1.4524 & 0.074665 \tabularnewline
15 & 0.000665 & 0.0069 & 0.497263 \tabularnewline
16 & -0.037329 & -0.3861 & 0.35008 \tabularnewline
17 & 0.021381 & 0.2212 & 0.412693 \tabularnewline
18 & 0.035305 & 0.3652 & 0.357842 \tabularnewline
19 & -0.03876 & -0.4009 & 0.344634 \tabularnewline
20 & -0.043582 & -0.4508 & 0.326516 \tabularnewline
21 & -0.081939 & -0.8476 & 0.19928 \tabularnewline
22 & -0.000278 & -0.0029 & 0.498855 \tabularnewline
23 & 0.005008 & 0.0518 & 0.479392 \tabularnewline
24 & 0.054655 & 0.5654 & 0.286507 \tabularnewline
25 & -0.084911 & -0.8783 & 0.190869 \tabularnewline
26 & -0.070197 & -0.7261 & 0.234676 \tabularnewline
27 & 0.051174 & 0.5293 & 0.298831 \tabularnewline
28 & -0.02813 & -0.291 & 0.385816 \tabularnewline
29 & -0.038077 & -0.3939 & 0.347228 \tabularnewline
30 & -0.066502 & -0.6879 & 0.2465 \tabularnewline
31 & 0.035663 & 0.3689 & 0.356466 \tabularnewline
32 & 0.02526 & 0.2613 & 0.397186 \tabularnewline
33 & 0.063102 & 0.6527 & 0.257666 \tabularnewline
34 & -0.146223 & -1.5125 & 0.066673 \tabularnewline
35 & -0.029113 & -0.3012 & 0.381941 \tabularnewline
36 & 0.073737 & 0.7627 & 0.223647 \tabularnewline
37 & 0.002379 & 0.0246 & 0.490208 \tabularnewline
38 & 0.085633 & 0.8858 & 0.188857 \tabularnewline
39 & -0.143356 & -1.4829 & 0.070522 \tabularnewline
40 & 0.068281 & 0.7063 & 0.240766 \tabularnewline
41 & -0.047081 & -0.487 & 0.313623 \tabularnewline
42 & -0.044388 & -0.4592 & 0.323528 \tabularnewline
43 & -0.016977 & -0.1756 & 0.430467 \tabularnewline
44 & -0.064374 & -0.6659 & 0.253456 \tabularnewline
45 & -0.040743 & -0.4214 & 0.337136 \tabularnewline
46 & -0.079975 & -0.8273 & 0.204964 \tabularnewline
47 & 0.027907 & 0.2887 & 0.386694 \tabularnewline
48 & -0.06052 & -0.626 & 0.266318 \tabularnewline
\hline
\end{tabular}
%Source: https://freestatistics.org/blog/index.php?pk=243546&T=2

[TABLE]
[ROW][C]Partial Autocorrelation Function[/C][/ROW]
[ROW][C]Time lag k[/C][C]PACF(k)[/C][C]T-STAT[/C][C]P-value[/C][/ROW]
[ROW][C]1[/C][C]0.479486[/C][C]4.9598[/C][C]1e-06[/C][/ROW]
[ROW][C]2[/C][C]-0.197996[/C][C]-2.0481[/C][C]0.0215[/C][/ROW]
[ROW][C]3[/C][C]-0.077655[/C][C]-0.8033[/C][C]0.2118[/C][/ROW]
[ROW][C]4[/C][C]0.019163[/C][C]0.1982[/C][C]0.421623[/C][/ROW]
[ROW][C]5[/C][C]-0.066827[/C][C]-0.6913[/C][C]0.245447[/C][/ROW]
[ROW][C]6[/C][C]0.001361[/C][C]0.0141[/C][C]0.494398[/C][/ROW]
[ROW][C]7[/C][C]-0.072057[/C][C]-0.7454[/C][C]0.228845[/C][/ROW]
[ROW][C]8[/C][C]-0.049332[/C][C]-0.5103[/C][C]0.305449[/C][/ROW]
[ROW][C]9[/C][C]-0.096449[/C][C]-0.9977[/C][C]0.160345[/C][/ROW]
[ROW][C]10[/C][C]-0.052565[/C][C]-0.5437[/C][C]0.293876[/C][/ROW]
[ROW][C]11[/C][C]0.097823[/C][C]1.0119[/C][C]0.156937[/C][/ROW]
[ROW][C]12[/C][C]0.060909[/C][C]0.63[/C][C]0.265005[/C][/ROW]
[ROW][C]13[/C][C]-0.005501[/C][C]-0.0569[/C][C]0.477365[/C][/ROW]
[ROW][C]14[/C][C]-0.140404[/C][C]-1.4524[/C][C]0.074665[/C][/ROW]
[ROW][C]15[/C][C]0.000665[/C][C]0.0069[/C][C]0.497263[/C][/ROW]
[ROW][C]16[/C][C]-0.037329[/C][C]-0.3861[/C][C]0.35008[/C][/ROW]
[ROW][C]17[/C][C]0.021381[/C][C]0.2212[/C][C]0.412693[/C][/ROW]
[ROW][C]18[/C][C]0.035305[/C][C]0.3652[/C][C]0.357842[/C][/ROW]
[ROW][C]19[/C][C]-0.03876[/C][C]-0.4009[/C][C]0.344634[/C][/ROW]
[ROW][C]20[/C][C]-0.043582[/C][C]-0.4508[/C][C]0.326516[/C][/ROW]
[ROW][C]21[/C][C]-0.081939[/C][C]-0.8476[/C][C]0.19928[/C][/ROW]
[ROW][C]22[/C][C]-0.000278[/C][C]-0.0029[/C][C]0.498855[/C][/ROW]
[ROW][C]23[/C][C]0.005008[/C][C]0.0518[/C][C]0.479392[/C][/ROW]
[ROW][C]24[/C][C]0.054655[/C][C]0.5654[/C][C]0.286507[/C][/ROW]
[ROW][C]25[/C][C]-0.084911[/C][C]-0.8783[/C][C]0.190869[/C][/ROW]
[ROW][C]26[/C][C]-0.070197[/C][C]-0.7261[/C][C]0.234676[/C][/ROW]
[ROW][C]27[/C][C]0.051174[/C][C]0.5293[/C][C]0.298831[/C][/ROW]
[ROW][C]28[/C][C]-0.02813[/C][C]-0.291[/C][C]0.385816[/C][/ROW]
[ROW][C]29[/C][C]-0.038077[/C][C]-0.3939[/C][C]0.347228[/C][/ROW]
[ROW][C]30[/C][C]-0.066502[/C][C]-0.6879[/C][C]0.2465[/C][/ROW]
[ROW][C]31[/C][C]0.035663[/C][C]0.3689[/C][C]0.356466[/C][/ROW]
[ROW][C]32[/C][C]0.02526[/C][C]0.2613[/C][C]0.397186[/C][/ROW]
[ROW][C]33[/C][C]0.063102[/C][C]0.6527[/C][C]0.257666[/C][/ROW]
[ROW][C]34[/C][C]-0.146223[/C][C]-1.5125[/C][C]0.066673[/C][/ROW]
[ROW][C]35[/C][C]-0.029113[/C][C]-0.3012[/C][C]0.381941[/C][/ROW]
[ROW][C]36[/C][C]0.073737[/C][C]0.7627[/C][C]0.223647[/C][/ROW]
[ROW][C]37[/C][C]0.002379[/C][C]0.0246[/C][C]0.490208[/C][/ROW]
[ROW][C]38[/C][C]0.085633[/C][C]0.8858[/C][C]0.188857[/C][/ROW]
[ROW][C]39[/C][C]-0.143356[/C][C]-1.4829[/C][C]0.070522[/C][/ROW]
[ROW][C]40[/C][C]0.068281[/C][C]0.7063[/C][C]0.240766[/C][/ROW]
[ROW][C]41[/C][C]-0.047081[/C][C]-0.487[/C][C]0.313623[/C][/ROW]
[ROW][C]42[/C][C]-0.044388[/C][C]-0.4592[/C][C]0.323528[/C][/ROW]
[ROW][C]43[/C][C]-0.016977[/C][C]-0.1756[/C][C]0.430467[/C][/ROW]
[ROW][C]44[/C][C]-0.064374[/C][C]-0.6659[/C][C]0.253456[/C][/ROW]
[ROW][C]45[/C][C]-0.040743[/C][C]-0.4214[/C][C]0.337136[/C][/ROW]
[ROW][C]46[/C][C]-0.079975[/C][C]-0.8273[/C][C]0.204964[/C][/ROW]
[ROW][C]47[/C][C]0.027907[/C][C]0.2887[/C][C]0.386694[/C][/ROW]
[ROW][C]48[/C][C]-0.06052[/C][C]-0.626[/C][C]0.266318[/C][/ROW]
[/TABLE]
Source: https://freestatistics.org/blog/index.php?pk=243546&T=2

Globally Unique Identifier (entire table): ba.freestatistics.org/blog/index.php?pk=243546&T=2

As an alternative you can also use a QR Code:  

The GUIDs for individual cells are displayed in the table below:

Partial Autocorrelation Function
Time lag kPACF(k)T-STATP-value
10.4794864.95981e-06
2-0.197996-2.04810.0215
3-0.077655-0.80330.2118
40.0191630.19820.421623
5-0.066827-0.69130.245447
60.0013610.01410.494398
7-0.072057-0.74540.228845
8-0.049332-0.51030.305449
9-0.096449-0.99770.160345
10-0.052565-0.54370.293876
110.0978231.01190.156937
120.0609090.630.265005
13-0.005501-0.05690.477365
14-0.140404-1.45240.074665
150.0006650.00690.497263
16-0.037329-0.38610.35008
170.0213810.22120.412693
180.0353050.36520.357842
19-0.03876-0.40090.344634
20-0.043582-0.45080.326516
21-0.081939-0.84760.19928
22-0.000278-0.00290.498855
230.0050080.05180.479392
240.0546550.56540.286507
25-0.084911-0.87830.190869
26-0.070197-0.72610.234676
270.0511740.52930.298831
28-0.02813-0.2910.385816
29-0.038077-0.39390.347228
30-0.066502-0.68790.2465
310.0356630.36890.356466
320.025260.26130.397186
330.0631020.65270.257666
34-0.146223-1.51250.066673
35-0.029113-0.30120.381941
360.0737370.76270.223647
370.0023790.02460.490208
380.0856330.88580.188857
39-0.143356-1.48290.070522
400.0682810.70630.240766
41-0.047081-0.4870.313623
42-0.044388-0.45920.323528
43-0.016977-0.17560.430467
44-0.064374-0.66590.253456
45-0.040743-0.42140.337136
46-0.079975-0.82730.204964
470.0279070.28870.386694
48-0.06052-0.6260.266318


Parameters (Session):
par1 = 48 ; par2 = 1 ; par3 = 1 ; par4 = 0 ; par5 = 12 ; par6 = White Noise ; par7 = 0.95 ;
Parameters (R input):
par1 = 48 ; par2 = 1 ; par3 = 1 ; par4 = 0 ; par5 = 12 ; par6 = White Noise ; par7 = 0.95 ; par8 = ;
R code (references can be found in the software module):
par8 <- ''
par7 <- '0.95'
par6 <- 'White Noise'
par5 <- '12'
par4 <- '0'
par3 <- '0'
par2 <- '1'
par1 <- '48'
if (par1 == 'Default') {
par1 = 10*log10(length(x))
} else {
par1 <- as.numeric(par1)
}
par2 <- as.numeric(par2)
par3 <- as.numeric(par3)
par4 <- as.numeric(par4)
par5 <- as.numeric(par5)
if (par6 == 'White Noise') par6 <- 'white' else par6 <- 'ma'
par7 <- as.numeric(par7)
if (par8 != '') par8 <- as.numeric(par8)
ox <- x
if (par8 == '') {
if (par2 == 0) {
x <- log(x)
} else {
x <- (x ^ par2 - 1) / par2
}
} else {
x <- log(x,base=par8)
}
if (par3 > 0) x <- diff(x,lag=1,difference=par3)
if (par4 > 0) x <- diff(x,lag=par5,difference=par4)
bitmap(file='picts.png')
op <- par(mfrow=c(2,1))
plot(ox,type='l',main='Original Time Series',xlab='time',ylab='value')
if (par8=='') {
mytitle <- paste('Working Time Series (lambda=',par2,', d=',par3,', D=',par4,')',sep='')
mysub <- paste('(lambda=',par2,', d=',par3,', D=',par4,', CI=', par7, ', CI type=',par6,')',sep='')
} else {
mytitle <- paste('Working Time Series (base=',par8,', d=',par3,', D=',par4,')',sep='')
mysub <- paste('(base=',par8,', d=',par3,', D=',par4,', CI=', par7, ', CI type=',par6,')',sep='')
}
plot(x,type='l', main=mytitle,xlab='time',ylab='value')
par(op)
dev.off()
bitmap(file='pic1.png')
racf <- acf(x, par1, main='Autocorrelation', xlab='time lag', ylab='ACF', ci.type=par6, ci=par7, sub=mysub)
dev.off()
bitmap(file='pic2.png')
rpacf <- pacf(x,par1,main='Partial Autocorrelation',xlab='lags',ylab='PACF',sub=mysub)
dev.off()
(myacf <- c(racf$acf))
(mypacf <- c(rpacf$acf))
lengthx <- length(x)
sqrtn <- sqrt(lengthx)
load(file='createtable')
a<-table.start()
a<-table.row.start(a)
a<-table.element(a,'Autocorrelation Function',4,TRUE)
a<-table.row.end(a)
a<-table.row.start(a)
a<-table.element(a,'Time lag k',header=TRUE)
a<-table.element(a,hyperlink('basics.htm','ACF(k)','click here for more information about the Autocorrelation Function'),header=TRUE)
a<-table.element(a,'T-STAT',header=TRUE)
a<-table.element(a,'P-value',header=TRUE)
a<-table.row.end(a)
for (i in 2:(par1+1)) {
a<-table.row.start(a)
a<-table.element(a,i-1,header=TRUE)
a<-table.element(a,round(myacf[i],6))
mytstat <- myacf[i]*sqrtn
a<-table.element(a,round(mytstat,4))
a<-table.element(a,round(1-pt(abs(mytstat),lengthx),6))
a<-table.row.end(a)
}
a<-table.end(a)
table.save(a,file='mytable.tab')
a<-table.start()
a<-table.row.start(a)
a<-table.element(a,'Partial Autocorrelation Function',4,TRUE)
a<-table.row.end(a)
a<-table.row.start(a)
a<-table.element(a,'Time lag k',header=TRUE)
a<-table.element(a,hyperlink('basics.htm','PACF(k)','click here for more information about the Partial Autocorrelation Function'),header=TRUE)
a<-table.element(a,'T-STAT',header=TRUE)
a<-table.element(a,'P-value',header=TRUE)
a<-table.row.end(a)
for (i in 1:par1) {
a<-table.row.start(a)
a<-table.element(a,i,header=TRUE)
a<-table.element(a,round(mypacf[i],6))
mytstat <- mypacf[i]*sqrtn
a<-table.element(a,round(mytstat,4))
a<-table.element(a,round(1-pt(abs(mytstat),lengthx),6))
a<-table.row.end(a)
}
a<-table.end(a)
table.save(a,file='mytable1.tab')