Free Statistics

of Irreproducible Research!

Author's title

Author*Unverified author*
R Software Modulerwasp_autocorrelation.wasp
Title produced by software(Partial) Autocorrelation Function
Date of computationSat, 18 Oct 2014 15:46:31 +0100
Cite this page as followsStatistical Computations at FreeStatistics.org, Office for Research Development and Education, URL https://freestatistics.org/blog/index.php?v=date/2014/Oct/18/t1413643639gkhji48bgiu8loo.htm/, Retrieved Mon, 13 May 2024 01:36:21 +0000
Statistical Computations at FreeStatistics.org, Office for Research Development and Education, URL https://freestatistics.org/blog/index.php?pk=243519, Retrieved Mon, 13 May 2024 01:36:21 +0000
QR Codes:

Original text written by user:
IsPrivate?No (this computation is public)
User-defined keywords
Estimated Impact77
Family? (F = Feedback message, R = changed R code, M = changed R Module, P = changed Parameters, D = changed Data)
-       [(Partial) Autocorrelation Function] [] [2014-10-18 14:46:31] [beda3c52974d0e45a2203fe962302ec0] [Current]
Feedback Forum

Post a new message
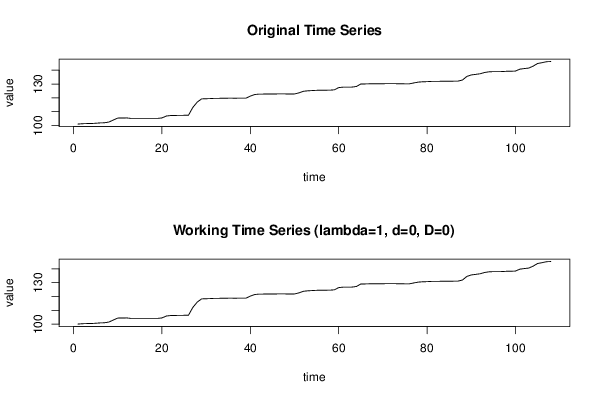
Dataseries X:
101,1
101,35
101,45
101,49
101,68
101,92
102,04
102,55
104,02
105,41
105,48
105,54
105,16
105,16
105,16
105,16
105,16
105,17
105,17
105,54
106,9
107,27
107,31
107,39
107,41
107,46
113,14
117
119,28
119,39
119,5
119,67
119,67
119,73
119,77
119,77
119,78
119,78
119,78
121,28
122,44
122,72
122,75
122,8
122,81
122,83
122,83
122,83
122,84
122,85
123,61
124,74
125,1
125,29
125,45
125,51
125,55
125,57
125,81
127,41
127,75
127,76
127,8
128,23
130,01
130,07
130,17
130,21
130,22
130,23
130,23
130,23
130,23
130,24
130,13
130,14
130,79
131,38
131,61
131,72
131,89
131,89
131,96
131,99
132
132,06
132,11
132,88
135,48
136,56
136,96
137,4
138,32
138,82
138,96
138,94
139
139,19
139,22
139,37
140,74
141,17
141,51
142,94
144,81
145,41
146,11
146,23


Summary of computational transaction
Raw Inputview raw input (R code)
Raw Outputview raw output of R engine
Computing time2 seconds
R Server'Sir Maurice George Kendall' @ kendall.wessa.net

\begin{tabular}{lllllllll}
\hline
Summary of computational transaction \tabularnewline
Raw Input & view raw input (R code)  \tabularnewline
Raw Output & view raw output of R engine  \tabularnewline
Computing time & 2 seconds \tabularnewline
R Server & 'Sir Maurice George Kendall' @ kendall.wessa.net \tabularnewline
\hline
\end{tabular}
%Source: https://freestatistics.org/blog/index.php?pk=243519&T=0

[TABLE]
[ROW][C]Summary of computational transaction[/C][/ROW]
[ROW][C]Raw Input[/C][C]view raw input (R code) [/C][/ROW]
[ROW][C]Raw Output[/C][C]view raw output of R engine [/C][/ROW]
[ROW][C]Computing time[/C][C]2 seconds[/C][/ROW]
[ROW][C]R Server[/C][C]'Sir Maurice George Kendall' @ kendall.wessa.net[/C][/ROW]
[/TABLE]
Source: https://freestatistics.org/blog/index.php?pk=243519&T=0

Globally Unique Identifier (entire table): ba.freestatistics.org/blog/index.php?pk=243519&T=0

As an alternative you can also use a QR Code:  

The GUIDs for individual cells are displayed in the table below:

Summary of computational transaction
Raw Inputview raw input (R code)
Raw Outputview raw output of R engine
Computing time2 seconds
R Server'Sir Maurice George Kendall' @ kendall.wessa.net


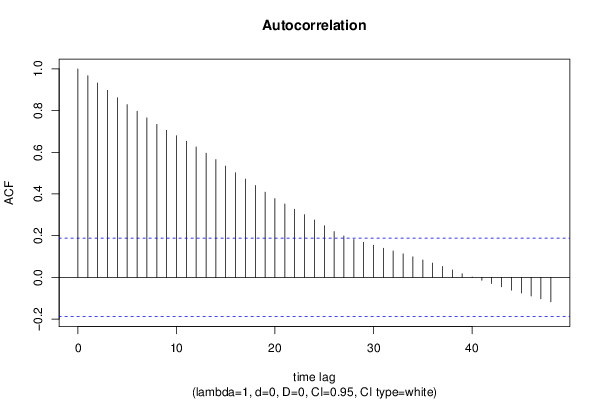
Autocorrelation Function
Time lag kACF(k)T-STATP-value
10.96759210.05550
20.9325519.69140
30.8971459.32340
40.8619428.95760
50.8288188.61330
60.7972358.28510
70.7654367.95460
80.7341477.62950
90.7060087.3370
100.6794987.06150
110.6527136.78320
120.6252996.49830
130.5959776.19360
140.5651275.8730
150.5336375.54570
160.502245.21940
170.4714984.92e-06
180.4404744.57756e-06
190.4088234.24862.3e-05
200.3779833.92817.6e-05
210.3516363.65432e-04
220.3264233.39230.000485
230.3009473.12750.001133
240.2749572.85740.002562
250.2477822.5750.005688
260.2196212.28240.012213
270.1984272.06210.020798
280.1818741.89010.030713
290.1680781.74670.041764
300.1540811.60130.05612
310.1400421.45540.074236
320.1263071.31260.096047
330.1126331.17050.122184
340.0981691.02020.154956
350.0832850.86550.194334
360.0681630.70840.24012
370.0523280.54380.293847
380.0354630.36850.356597
390.0175410.18230.427847
400.0010890.01130.495494
41-0.014327-0.14890.44096
42-0.02979-0.30960.378737
43-0.045508-0.47290.318608
44-0.061458-0.63870.262189
45-0.075468-0.78430.217294
46-0.089231-0.92730.177914
47-0.103157-1.0720.143047
48-0.117285-1.21890.112777

\begin{tabular}{lllllllll}
\hline
Autocorrelation Function \tabularnewline
Time lag k & ACF(k) & T-STAT & P-value \tabularnewline
1 & 0.967592 & 10.0555 & 0 \tabularnewline
2 & 0.932551 & 9.6914 & 0 \tabularnewline
3 & 0.897145 & 9.3234 & 0 \tabularnewline
4 & 0.861942 & 8.9576 & 0 \tabularnewline
5 & 0.828818 & 8.6133 & 0 \tabularnewline
6 & 0.797235 & 8.2851 & 0 \tabularnewline
7 & 0.765436 & 7.9546 & 0 \tabularnewline
8 & 0.734147 & 7.6295 & 0 \tabularnewline
9 & 0.706008 & 7.337 & 0 \tabularnewline
10 & 0.679498 & 7.0615 & 0 \tabularnewline
11 & 0.652713 & 6.7832 & 0 \tabularnewline
12 & 0.625299 & 6.4983 & 0 \tabularnewline
13 & 0.595977 & 6.1936 & 0 \tabularnewline
14 & 0.565127 & 5.873 & 0 \tabularnewline
15 & 0.533637 & 5.5457 & 0 \tabularnewline
16 & 0.50224 & 5.2194 & 0 \tabularnewline
17 & 0.471498 & 4.9 & 2e-06 \tabularnewline
18 & 0.440474 & 4.5775 & 6e-06 \tabularnewline
19 & 0.408823 & 4.2486 & 2.3e-05 \tabularnewline
20 & 0.377983 & 3.9281 & 7.6e-05 \tabularnewline
21 & 0.351636 & 3.6543 & 2e-04 \tabularnewline
22 & 0.326423 & 3.3923 & 0.000485 \tabularnewline
23 & 0.300947 & 3.1275 & 0.001133 \tabularnewline
24 & 0.274957 & 2.8574 & 0.002562 \tabularnewline
25 & 0.247782 & 2.575 & 0.005688 \tabularnewline
26 & 0.219621 & 2.2824 & 0.012213 \tabularnewline
27 & 0.198427 & 2.0621 & 0.020798 \tabularnewline
28 & 0.181874 & 1.8901 & 0.030713 \tabularnewline
29 & 0.168078 & 1.7467 & 0.041764 \tabularnewline
30 & 0.154081 & 1.6013 & 0.05612 \tabularnewline
31 & 0.140042 & 1.4554 & 0.074236 \tabularnewline
32 & 0.126307 & 1.3126 & 0.096047 \tabularnewline
33 & 0.112633 & 1.1705 & 0.122184 \tabularnewline
34 & 0.098169 & 1.0202 & 0.154956 \tabularnewline
35 & 0.083285 & 0.8655 & 0.194334 \tabularnewline
36 & 0.068163 & 0.7084 & 0.24012 \tabularnewline
37 & 0.052328 & 0.5438 & 0.293847 \tabularnewline
38 & 0.035463 & 0.3685 & 0.356597 \tabularnewline
39 & 0.017541 & 0.1823 & 0.427847 \tabularnewline
40 & 0.001089 & 0.0113 & 0.495494 \tabularnewline
41 & -0.014327 & -0.1489 & 0.44096 \tabularnewline
42 & -0.02979 & -0.3096 & 0.378737 \tabularnewline
43 & -0.045508 & -0.4729 & 0.318608 \tabularnewline
44 & -0.061458 & -0.6387 & 0.262189 \tabularnewline
45 & -0.075468 & -0.7843 & 0.217294 \tabularnewline
46 & -0.089231 & -0.9273 & 0.177914 \tabularnewline
47 & -0.103157 & -1.072 & 0.143047 \tabularnewline
48 & -0.117285 & -1.2189 & 0.112777 \tabularnewline
\hline
\end{tabular}
%Source: https://freestatistics.org/blog/index.php?pk=243519&T=1

[TABLE]
[ROW][C]Autocorrelation Function[/C][/ROW]
[ROW][C]Time lag k[/C][C]ACF(k)[/C][C]T-STAT[/C][C]P-value[/C][/ROW]
[ROW][C]1[/C][C]0.967592[/C][C]10.0555[/C][C]0[/C][/ROW]
[ROW][C]2[/C][C]0.932551[/C][C]9.6914[/C][C]0[/C][/ROW]
[ROW][C]3[/C][C]0.897145[/C][C]9.3234[/C][C]0[/C][/ROW]
[ROW][C]4[/C][C]0.861942[/C][C]8.9576[/C][C]0[/C][/ROW]
[ROW][C]5[/C][C]0.828818[/C][C]8.6133[/C][C]0[/C][/ROW]
[ROW][C]6[/C][C]0.797235[/C][C]8.2851[/C][C]0[/C][/ROW]
[ROW][C]7[/C][C]0.765436[/C][C]7.9546[/C][C]0[/C][/ROW]
[ROW][C]8[/C][C]0.734147[/C][C]7.6295[/C][C]0[/C][/ROW]
[ROW][C]9[/C][C]0.706008[/C][C]7.337[/C][C]0[/C][/ROW]
[ROW][C]10[/C][C]0.679498[/C][C]7.0615[/C][C]0[/C][/ROW]
[ROW][C]11[/C][C]0.652713[/C][C]6.7832[/C][C]0[/C][/ROW]
[ROW][C]12[/C][C]0.625299[/C][C]6.4983[/C][C]0[/C][/ROW]
[ROW][C]13[/C][C]0.595977[/C][C]6.1936[/C][C]0[/C][/ROW]
[ROW][C]14[/C][C]0.565127[/C][C]5.873[/C][C]0[/C][/ROW]
[ROW][C]15[/C][C]0.533637[/C][C]5.5457[/C][C]0[/C][/ROW]
[ROW][C]16[/C][C]0.50224[/C][C]5.2194[/C][C]0[/C][/ROW]
[ROW][C]17[/C][C]0.471498[/C][C]4.9[/C][C]2e-06[/C][/ROW]
[ROW][C]18[/C][C]0.440474[/C][C]4.5775[/C][C]6e-06[/C][/ROW]
[ROW][C]19[/C][C]0.408823[/C][C]4.2486[/C][C]2.3e-05[/C][/ROW]
[ROW][C]20[/C][C]0.377983[/C][C]3.9281[/C][C]7.6e-05[/C][/ROW]
[ROW][C]21[/C][C]0.351636[/C][C]3.6543[/C][C]2e-04[/C][/ROW]
[ROW][C]22[/C][C]0.326423[/C][C]3.3923[/C][C]0.000485[/C][/ROW]
[ROW][C]23[/C][C]0.300947[/C][C]3.1275[/C][C]0.001133[/C][/ROW]
[ROW][C]24[/C][C]0.274957[/C][C]2.8574[/C][C]0.002562[/C][/ROW]
[ROW][C]25[/C][C]0.247782[/C][C]2.575[/C][C]0.005688[/C][/ROW]
[ROW][C]26[/C][C]0.219621[/C][C]2.2824[/C][C]0.012213[/C][/ROW]
[ROW][C]27[/C][C]0.198427[/C][C]2.0621[/C][C]0.020798[/C][/ROW]
[ROW][C]28[/C][C]0.181874[/C][C]1.8901[/C][C]0.030713[/C][/ROW]
[ROW][C]29[/C][C]0.168078[/C][C]1.7467[/C][C]0.041764[/C][/ROW]
[ROW][C]30[/C][C]0.154081[/C][C]1.6013[/C][C]0.05612[/C][/ROW]
[ROW][C]31[/C][C]0.140042[/C][C]1.4554[/C][C]0.074236[/C][/ROW]
[ROW][C]32[/C][C]0.126307[/C][C]1.3126[/C][C]0.096047[/C][/ROW]
[ROW][C]33[/C][C]0.112633[/C][C]1.1705[/C][C]0.122184[/C][/ROW]
[ROW][C]34[/C][C]0.098169[/C][C]1.0202[/C][C]0.154956[/C][/ROW]
[ROW][C]35[/C][C]0.083285[/C][C]0.8655[/C][C]0.194334[/C][/ROW]
[ROW][C]36[/C][C]0.068163[/C][C]0.7084[/C][C]0.24012[/C][/ROW]
[ROW][C]37[/C][C]0.052328[/C][C]0.5438[/C][C]0.293847[/C][/ROW]
[ROW][C]38[/C][C]0.035463[/C][C]0.3685[/C][C]0.356597[/C][/ROW]
[ROW][C]39[/C][C]0.017541[/C][C]0.1823[/C][C]0.427847[/C][/ROW]
[ROW][C]40[/C][C]0.001089[/C][C]0.0113[/C][C]0.495494[/C][/ROW]
[ROW][C]41[/C][C]-0.014327[/C][C]-0.1489[/C][C]0.44096[/C][/ROW]
[ROW][C]42[/C][C]-0.02979[/C][C]-0.3096[/C][C]0.378737[/C][/ROW]
[ROW][C]43[/C][C]-0.045508[/C][C]-0.4729[/C][C]0.318608[/C][/ROW]
[ROW][C]44[/C][C]-0.061458[/C][C]-0.6387[/C][C]0.262189[/C][/ROW]
[ROW][C]45[/C][C]-0.075468[/C][C]-0.7843[/C][C]0.217294[/C][/ROW]
[ROW][C]46[/C][C]-0.089231[/C][C]-0.9273[/C][C]0.177914[/C][/ROW]
[ROW][C]47[/C][C]-0.103157[/C][C]-1.072[/C][C]0.143047[/C][/ROW]
[ROW][C]48[/C][C]-0.117285[/C][C]-1.2189[/C][C]0.112777[/C][/ROW]
[/TABLE]
Source: https://freestatistics.org/blog/index.php?pk=243519&T=1

Globally Unique Identifier (entire table): ba.freestatistics.org/blog/index.php?pk=243519&T=1

As an alternative you can also use a QR Code:  

The GUIDs for individual cells are displayed in the table below:

Autocorrelation Function
Time lag kACF(k)T-STATP-value
10.96759210.05550
20.9325519.69140
30.8971459.32340
40.8619428.95760
50.8288188.61330
60.7972358.28510
70.7654367.95460
80.7341477.62950
90.7060087.3370
100.6794987.06150
110.6527136.78320
120.6252996.49830
130.5959776.19360
140.5651275.8730
150.5336375.54570
160.502245.21940
170.4714984.92e-06
180.4404744.57756e-06
190.4088234.24862.3e-05
200.3779833.92817.6e-05
210.3516363.65432e-04
220.3264233.39230.000485
230.3009473.12750.001133
240.2749572.85740.002562
250.2477822.5750.005688
260.2196212.28240.012213
270.1984272.06210.020798
280.1818741.89010.030713
290.1680781.74670.041764
300.1540811.60130.05612
310.1400421.45540.074236
320.1263071.31260.096047
330.1126331.17050.122184
340.0981691.02020.154956
350.0832850.86550.194334
360.0681630.70840.24012
370.0523280.54380.293847
380.0354630.36850.356597
390.0175410.18230.427847
400.0010890.01130.495494
41-0.014327-0.14890.44096
42-0.02979-0.30960.378737
43-0.045508-0.47290.318608
44-0.061458-0.63870.262189
45-0.075468-0.78430.217294
46-0.089231-0.92730.177914
47-0.103157-1.0720.143047
48-0.117285-1.21890.112777


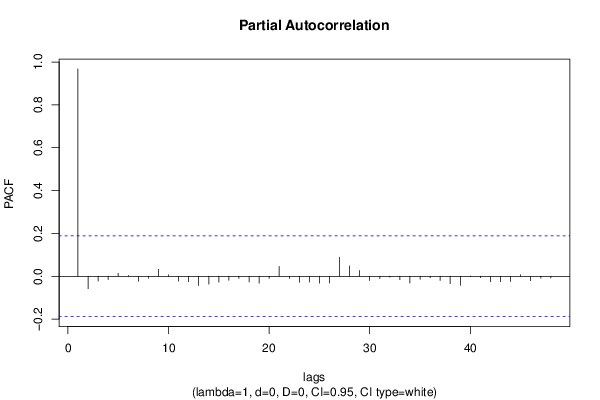
Partial Autocorrelation Function
Time lag kPACF(k)T-STATP-value
10.96759210.05550
2-0.057761-0.60030.274793
3-0.022258-0.23130.408755
4-0.015075-0.15670.4379
50.013580.14110.444016
60.0035530.03690.485307
7-0.023149-0.24060.405171
8-0.009795-0.10180.459556
90.0320130.33270.370009
100.0063850.06640.473608
11-0.022715-0.23610.406916
12-0.025921-0.26940.394075
13-0.042928-0.44610.328202
14-0.036681-0.38120.3519
15-0.027543-0.28620.387624
16-0.018492-0.19220.423983
17-0.009845-0.10230.459348
18-0.026232-0.27260.392837
19-0.032272-0.33540.368994
20-0.010056-0.10450.458481
210.0458410.47640.317379
22-0.010376-0.10780.457166
23-0.028296-0.29410.384637
24-0.027279-0.28350.388673
25-0.032175-0.33440.369374
26-0.031789-0.33040.370885
270.0883190.91780.180374
280.0482490.50140.30855
290.0268590.27910.390339
30-0.019608-0.20380.419458
31-0.011006-0.11440.454575
32-0.004206-0.04370.482608
33-0.015877-0.1650.434627
34-0.031861-0.33110.370604
35-0.013953-0.1450.44249
36-0.006755-0.07020.472082
37-0.019499-0.20260.419901
38-0.034351-0.3570.3609
39-0.042483-0.44150.329869
40-0.000844-0.00880.496507
41-0.006554-0.06810.47291
42-0.02537-0.26370.396273
43-0.025719-0.26730.39488
44-0.024331-0.25290.400432
450.0074220.07710.469331
46-0.020591-0.2140.415481
47-0.009785-0.10170.459597
48-0.00828-0.08610.465792

\begin{tabular}{lllllllll}
\hline
Partial Autocorrelation Function \tabularnewline
Time lag k & PACF(k) & T-STAT & P-value \tabularnewline
1 & 0.967592 & 10.0555 & 0 \tabularnewline
2 & -0.057761 & -0.6003 & 0.274793 \tabularnewline
3 & -0.022258 & -0.2313 & 0.408755 \tabularnewline
4 & -0.015075 & -0.1567 & 0.4379 \tabularnewline
5 & 0.01358 & 0.1411 & 0.444016 \tabularnewline
6 & 0.003553 & 0.0369 & 0.485307 \tabularnewline
7 & -0.023149 & -0.2406 & 0.405171 \tabularnewline
8 & -0.009795 & -0.1018 & 0.459556 \tabularnewline
9 & 0.032013 & 0.3327 & 0.370009 \tabularnewline
10 & 0.006385 & 0.0664 & 0.473608 \tabularnewline
11 & -0.022715 & -0.2361 & 0.406916 \tabularnewline
12 & -0.025921 & -0.2694 & 0.394075 \tabularnewline
13 & -0.042928 & -0.4461 & 0.328202 \tabularnewline
14 & -0.036681 & -0.3812 & 0.3519 \tabularnewline
15 & -0.027543 & -0.2862 & 0.387624 \tabularnewline
16 & -0.018492 & -0.1922 & 0.423983 \tabularnewline
17 & -0.009845 & -0.1023 & 0.459348 \tabularnewline
18 & -0.026232 & -0.2726 & 0.392837 \tabularnewline
19 & -0.032272 & -0.3354 & 0.368994 \tabularnewline
20 & -0.010056 & -0.1045 & 0.458481 \tabularnewline
21 & 0.045841 & 0.4764 & 0.317379 \tabularnewline
22 & -0.010376 & -0.1078 & 0.457166 \tabularnewline
23 & -0.028296 & -0.2941 & 0.384637 \tabularnewline
24 & -0.027279 & -0.2835 & 0.388673 \tabularnewline
25 & -0.032175 & -0.3344 & 0.369374 \tabularnewline
26 & -0.031789 & -0.3304 & 0.370885 \tabularnewline
27 & 0.088319 & 0.9178 & 0.180374 \tabularnewline
28 & 0.048249 & 0.5014 & 0.30855 \tabularnewline
29 & 0.026859 & 0.2791 & 0.390339 \tabularnewline
30 & -0.019608 & -0.2038 & 0.419458 \tabularnewline
31 & -0.011006 & -0.1144 & 0.454575 \tabularnewline
32 & -0.004206 & -0.0437 & 0.482608 \tabularnewline
33 & -0.015877 & -0.165 & 0.434627 \tabularnewline
34 & -0.031861 & -0.3311 & 0.370604 \tabularnewline
35 & -0.013953 & -0.145 & 0.44249 \tabularnewline
36 & -0.006755 & -0.0702 & 0.472082 \tabularnewline
37 & -0.019499 & -0.2026 & 0.419901 \tabularnewline
38 & -0.034351 & -0.357 & 0.3609 \tabularnewline
39 & -0.042483 & -0.4415 & 0.329869 \tabularnewline
40 & -0.000844 & -0.0088 & 0.496507 \tabularnewline
41 & -0.006554 & -0.0681 & 0.47291 \tabularnewline
42 & -0.02537 & -0.2637 & 0.396273 \tabularnewline
43 & -0.025719 & -0.2673 & 0.39488 \tabularnewline
44 & -0.024331 & -0.2529 & 0.400432 \tabularnewline
45 & 0.007422 & 0.0771 & 0.469331 \tabularnewline
46 & -0.020591 & -0.214 & 0.415481 \tabularnewline
47 & -0.009785 & -0.1017 & 0.459597 \tabularnewline
48 & -0.00828 & -0.0861 & 0.465792 \tabularnewline
\hline
\end{tabular}
%Source: https://freestatistics.org/blog/index.php?pk=243519&T=2

[TABLE]
[ROW][C]Partial Autocorrelation Function[/C][/ROW]
[ROW][C]Time lag k[/C][C]PACF(k)[/C][C]T-STAT[/C][C]P-value[/C][/ROW]
[ROW][C]1[/C][C]0.967592[/C][C]10.0555[/C][C]0[/C][/ROW]
[ROW][C]2[/C][C]-0.057761[/C][C]-0.6003[/C][C]0.274793[/C][/ROW]
[ROW][C]3[/C][C]-0.022258[/C][C]-0.2313[/C][C]0.408755[/C][/ROW]
[ROW][C]4[/C][C]-0.015075[/C][C]-0.1567[/C][C]0.4379[/C][/ROW]
[ROW][C]5[/C][C]0.01358[/C][C]0.1411[/C][C]0.444016[/C][/ROW]
[ROW][C]6[/C][C]0.003553[/C][C]0.0369[/C][C]0.485307[/C][/ROW]
[ROW][C]7[/C][C]-0.023149[/C][C]-0.2406[/C][C]0.405171[/C][/ROW]
[ROW][C]8[/C][C]-0.009795[/C][C]-0.1018[/C][C]0.459556[/C][/ROW]
[ROW][C]9[/C][C]0.032013[/C][C]0.3327[/C][C]0.370009[/C][/ROW]
[ROW][C]10[/C][C]0.006385[/C][C]0.0664[/C][C]0.473608[/C][/ROW]
[ROW][C]11[/C][C]-0.022715[/C][C]-0.2361[/C][C]0.406916[/C][/ROW]
[ROW][C]12[/C][C]-0.025921[/C][C]-0.2694[/C][C]0.394075[/C][/ROW]
[ROW][C]13[/C][C]-0.042928[/C][C]-0.4461[/C][C]0.328202[/C][/ROW]
[ROW][C]14[/C][C]-0.036681[/C][C]-0.3812[/C][C]0.3519[/C][/ROW]
[ROW][C]15[/C][C]-0.027543[/C][C]-0.2862[/C][C]0.387624[/C][/ROW]
[ROW][C]16[/C][C]-0.018492[/C][C]-0.1922[/C][C]0.423983[/C][/ROW]
[ROW][C]17[/C][C]-0.009845[/C][C]-0.1023[/C][C]0.459348[/C][/ROW]
[ROW][C]18[/C][C]-0.026232[/C][C]-0.2726[/C][C]0.392837[/C][/ROW]
[ROW][C]19[/C][C]-0.032272[/C][C]-0.3354[/C][C]0.368994[/C][/ROW]
[ROW][C]20[/C][C]-0.010056[/C][C]-0.1045[/C][C]0.458481[/C][/ROW]
[ROW][C]21[/C][C]0.045841[/C][C]0.4764[/C][C]0.317379[/C][/ROW]
[ROW][C]22[/C][C]-0.010376[/C][C]-0.1078[/C][C]0.457166[/C][/ROW]
[ROW][C]23[/C][C]-0.028296[/C][C]-0.2941[/C][C]0.384637[/C][/ROW]
[ROW][C]24[/C][C]-0.027279[/C][C]-0.2835[/C][C]0.388673[/C][/ROW]
[ROW][C]25[/C][C]-0.032175[/C][C]-0.3344[/C][C]0.369374[/C][/ROW]
[ROW][C]26[/C][C]-0.031789[/C][C]-0.3304[/C][C]0.370885[/C][/ROW]
[ROW][C]27[/C][C]0.088319[/C][C]0.9178[/C][C]0.180374[/C][/ROW]
[ROW][C]28[/C][C]0.048249[/C][C]0.5014[/C][C]0.30855[/C][/ROW]
[ROW][C]29[/C][C]0.026859[/C][C]0.2791[/C][C]0.390339[/C][/ROW]
[ROW][C]30[/C][C]-0.019608[/C][C]-0.2038[/C][C]0.419458[/C][/ROW]
[ROW][C]31[/C][C]-0.011006[/C][C]-0.1144[/C][C]0.454575[/C][/ROW]
[ROW][C]32[/C][C]-0.004206[/C][C]-0.0437[/C][C]0.482608[/C][/ROW]
[ROW][C]33[/C][C]-0.015877[/C][C]-0.165[/C][C]0.434627[/C][/ROW]
[ROW][C]34[/C][C]-0.031861[/C][C]-0.3311[/C][C]0.370604[/C][/ROW]
[ROW][C]35[/C][C]-0.013953[/C][C]-0.145[/C][C]0.44249[/C][/ROW]
[ROW][C]36[/C][C]-0.006755[/C][C]-0.0702[/C][C]0.472082[/C][/ROW]
[ROW][C]37[/C][C]-0.019499[/C][C]-0.2026[/C][C]0.419901[/C][/ROW]
[ROW][C]38[/C][C]-0.034351[/C][C]-0.357[/C][C]0.3609[/C][/ROW]
[ROW][C]39[/C][C]-0.042483[/C][C]-0.4415[/C][C]0.329869[/C][/ROW]
[ROW][C]40[/C][C]-0.000844[/C][C]-0.0088[/C][C]0.496507[/C][/ROW]
[ROW][C]41[/C][C]-0.006554[/C][C]-0.0681[/C][C]0.47291[/C][/ROW]
[ROW][C]42[/C][C]-0.02537[/C][C]-0.2637[/C][C]0.396273[/C][/ROW]
[ROW][C]43[/C][C]-0.025719[/C][C]-0.2673[/C][C]0.39488[/C][/ROW]
[ROW][C]44[/C][C]-0.024331[/C][C]-0.2529[/C][C]0.400432[/C][/ROW]
[ROW][C]45[/C][C]0.007422[/C][C]0.0771[/C][C]0.469331[/C][/ROW]
[ROW][C]46[/C][C]-0.020591[/C][C]-0.214[/C][C]0.415481[/C][/ROW]
[ROW][C]47[/C][C]-0.009785[/C][C]-0.1017[/C][C]0.459597[/C][/ROW]
[ROW][C]48[/C][C]-0.00828[/C][C]-0.0861[/C][C]0.465792[/C][/ROW]
[/TABLE]
Source: https://freestatistics.org/blog/index.php?pk=243519&T=2

Globally Unique Identifier (entire table): ba.freestatistics.org/blog/index.php?pk=243519&T=2

As an alternative you can also use a QR Code:  

The GUIDs for individual cells are displayed in the table below:

Partial Autocorrelation Function
Time lag kPACF(k)T-STATP-value
10.96759210.05550
2-0.057761-0.60030.274793
3-0.022258-0.23130.408755
4-0.015075-0.15670.4379
50.013580.14110.444016
60.0035530.03690.485307
7-0.023149-0.24060.405171
8-0.009795-0.10180.459556
90.0320130.33270.370009
100.0063850.06640.473608
11-0.022715-0.23610.406916
12-0.025921-0.26940.394075
13-0.042928-0.44610.328202
14-0.036681-0.38120.3519
15-0.027543-0.28620.387624
16-0.018492-0.19220.423983
17-0.009845-0.10230.459348
18-0.026232-0.27260.392837
19-0.032272-0.33540.368994
20-0.010056-0.10450.458481
210.0458410.47640.317379
22-0.010376-0.10780.457166
23-0.028296-0.29410.384637
24-0.027279-0.28350.388673
25-0.032175-0.33440.369374
26-0.031789-0.33040.370885
270.0883190.91780.180374
280.0482490.50140.30855
290.0268590.27910.390339
30-0.019608-0.20380.419458
31-0.011006-0.11440.454575
32-0.004206-0.04370.482608
33-0.015877-0.1650.434627
34-0.031861-0.33110.370604
35-0.013953-0.1450.44249
36-0.006755-0.07020.472082
37-0.019499-0.20260.419901
38-0.034351-0.3570.3609
39-0.042483-0.44150.329869
40-0.000844-0.00880.496507
41-0.006554-0.06810.47291
42-0.02537-0.26370.396273
43-0.025719-0.26730.39488
44-0.024331-0.25290.400432
450.0074220.07710.469331
46-0.020591-0.2140.415481
47-0.009785-0.10170.459597
48-0.00828-0.08610.465792


Parameters (Session):
par1 = 48 ; par2 = 1 ; par3 = 0 ; par4 = 0 ; par5 = 12 ; par6 = White Noise ; par7 = 0.95 ;
Parameters (R input):
par1 = 48 ; par2 = 1 ; par3 = 0 ; par4 = 0 ; par5 = 12 ; par6 = White Noise ; par7 = 0.95 ; par8 = ;
R code (references can be found in the software module):
if (par1 == 'Default') {
par1 = 10*log10(length(x))
} else {
par1 <- as.numeric(par1)
}
par2 <- as.numeric(par2)
par3 <- as.numeric(par3)
par4 <- as.numeric(par4)
par5 <- as.numeric(par5)
if (par6 == 'White Noise') par6 <- 'white' else par6 <- 'ma'
par7 <- as.numeric(par7)
if (par8 != '') par8 <- as.numeric(par8)
ox <- x
if (par8 == '') {
if (par2 == 0) {
x <- log(x)
} else {
x <- (x ^ par2 - 1) / par2
}
} else {
x <- log(x,base=par8)
}
if (par3 > 0) x <- diff(x,lag=1,difference=par3)
if (par4 > 0) x <- diff(x,lag=par5,difference=par4)
bitmap(file='picts.png')
op <- par(mfrow=c(2,1))
plot(ox,type='l',main='Original Time Series',xlab='time',ylab='value')
if (par8=='') {
mytitle <- paste('Working Time Series (lambda=',par2,', d=',par3,', D=',par4,')',sep='')
mysub <- paste('(lambda=',par2,', d=',par3,', D=',par4,', CI=', par7, ', CI type=',par6,')',sep='')
} else {
mytitle <- paste('Working Time Series (base=',par8,', d=',par3,', D=',par4,')',sep='')
mysub <- paste('(base=',par8,', d=',par3,', D=',par4,', CI=', par7, ', CI type=',par6,')',sep='')
}
plot(x,type='l', main=mytitle,xlab='time',ylab='value')
par(op)
dev.off()
bitmap(file='pic1.png')
racf <- acf(x, par1, main='Autocorrelation', xlab='time lag', ylab='ACF', ci.type=par6, ci=par7, sub=mysub)
dev.off()
bitmap(file='pic2.png')
rpacf <- pacf(x,par1,main='Partial Autocorrelation',xlab='lags',ylab='PACF',sub=mysub)
dev.off()
(myacf <- c(racf$acf))
(mypacf <- c(rpacf$acf))
lengthx <- length(x)
sqrtn <- sqrt(lengthx)
load(file='createtable')
a<-table.start()
a<-table.row.start(a)
a<-table.element(a,'Autocorrelation Function',4,TRUE)
a<-table.row.end(a)
a<-table.row.start(a)
a<-table.element(a,'Time lag k',header=TRUE)
a<-table.element(a,hyperlink('basics.htm','ACF(k)','click here for more information about the Autocorrelation Function'),header=TRUE)
a<-table.element(a,'T-STAT',header=TRUE)
a<-table.element(a,'P-value',header=TRUE)
a<-table.row.end(a)
for (i in 2:(par1+1)) {
a<-table.row.start(a)
a<-table.element(a,i-1,header=TRUE)
a<-table.element(a,round(myacf[i],6))
mytstat <- myacf[i]*sqrtn
a<-table.element(a,round(mytstat,4))
a<-table.element(a,round(1-pt(abs(mytstat),lengthx),6))
a<-table.row.end(a)
}
a<-table.end(a)
table.save(a,file='mytable.tab')
a<-table.start()
a<-table.row.start(a)
a<-table.element(a,'Partial Autocorrelation Function',4,TRUE)
a<-table.row.end(a)
a<-table.row.start(a)
a<-table.element(a,'Time lag k',header=TRUE)
a<-table.element(a,hyperlink('basics.htm','PACF(k)','click here for more information about the Partial Autocorrelation Function'),header=TRUE)
a<-table.element(a,'T-STAT',header=TRUE)
a<-table.element(a,'P-value',header=TRUE)
a<-table.row.end(a)
for (i in 1:par1) {
a<-table.row.start(a)
a<-table.element(a,i,header=TRUE)
a<-table.element(a,round(mypacf[i],6))
mytstat <- mypacf[i]*sqrtn
a<-table.element(a,round(mytstat,4))
a<-table.element(a,round(1-pt(abs(mytstat),lengthx),6))
a<-table.row.end(a)
}
a<-table.end(a)
table.save(a,file='mytable1.tab')