Free Statistics

of Irreproducible Research!

Author's title

Author*Unverified author*
R Software Modulerwasp_autocorrelation.wasp
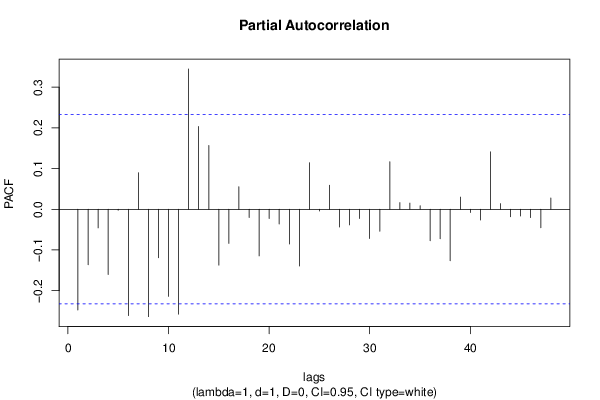
Title produced by software(Partial) Autocorrelation Function
Date of computationSat, 18 Oct 2014 14:37:15 +0100
Cite this page as followsStatistical Computations at FreeStatistics.org, Office for Research Development and Education, URL https://freestatistics.org/blog/index.php?v=date/2014/Oct/18/t1413639486z7muz0f1fp1ye0f.htm/, Retrieved Mon, 13 May 2024 15:36:48 +0000
Statistical Computations at FreeStatistics.org, Office for Research Development and Education, URL https://freestatistics.org/blog/index.php?pk=243497, Retrieved Mon, 13 May 2024 15:36:48 +0000
QR Codes:

Original text written by user:
IsPrivate?No (this computation is public)
User-defined keywords
Estimated Impact77
Family? (F = Feedback message, R = changed R code, M = changed R Module, P = changed Parameters, D = changed Data)
-       [(Partial) Autocorrelation Function] [] [2014-10-18 13:37:15] [23f6b347f5ddfa38e8c261c083a091fc] [Current]
Feedback Forum

Post a new message
Dataseries X:
31566
30111
30019
31934
25826
26835
20205
17789
20520
22518
15572
11509
25447
24090
27786
26195
20516
22759
19028
16971
20036
22485
18730
14538
27561
25985
34670
32066
27186
29586
21359
21553
19573
24256
22380
16167
27297
28287
33474
28229
28785
25597
18130
20198
22849
23118
21925
20801
18785
20659
29367
23992
20645
22356
17902
15879
16963
21035
17988
10437
24470
22237
27053
26419
22311
20624
17336
15586
17733
19231
16102
11770


Summary of computational transaction
Raw Inputview raw input (R code)
Raw Outputview raw output of R engine
Computing time1 seconds
R Server'Gwilym Jenkins' @ jenkins.wessa.net

\begin{tabular}{lllllllll}
\hline
Summary of computational transaction \tabularnewline
Raw Input & view raw input (R code)  \tabularnewline
Raw Output & view raw output of R engine  \tabularnewline
Computing time & 1 seconds \tabularnewline
R Server & 'Gwilym Jenkins' @ jenkins.wessa.net \tabularnewline
\hline
\end{tabular}
%Source: https://freestatistics.org/blog/index.php?pk=243497&T=0

[TABLE]
[ROW][C]Summary of computational transaction[/C][/ROW]
[ROW][C]Raw Input[/C][C]view raw input (R code) [/C][/ROW]
[ROW][C]Raw Output[/C][C]view raw output of R engine [/C][/ROW]
[ROW][C]Computing time[/C][C]1 seconds[/C][/ROW]
[ROW][C]R Server[/C][C]'Gwilym Jenkins' @ jenkins.wessa.net[/C][/ROW]
[/TABLE]
Source: https://freestatistics.org/blog/index.php?pk=243497&T=0

Globally Unique Identifier (entire table): ba.freestatistics.org/blog/index.php?pk=243497&T=0

As an alternative you can also use a QR Code:  

The GUIDs for individual cells are displayed in the table below:

Summary of computational transaction
Raw Inputview raw input (R code)
Raw Outputview raw output of R engine
Computing time1 seconds
R Server'Gwilym Jenkins' @ jenkins.wessa.net


Autocorrelation Function
Time lag kACF(k)T-STATP-value
1-0.24758-2.08610.02028
2-0.06654-0.56070.288391
30.0102810.08660.465605
4-0.129071-1.08760.140231
50.0798930.67320.251507
6-0.224875-1.89480.031093
70.2073411.74710.042473
8-0.217928-1.83630.03525
9-0.01555-0.1310.448062
100.0062190.05240.479178
11-0.147246-1.24070.109397
120.5216714.39571.9e-05
13-0.056121-0.47290.318873
140.0334950.28220.389294
15-0.169949-1.4320.078264
16-0.046199-0.38930.349118
170.1293871.09020.139648
18-0.236576-1.99340.025029
190.1177190.99190.162304
20-0.102577-0.86430.195158
21-0.02022-0.17040.4326
22-0.077913-0.65650.25681
23-0.073262-0.61730.2695
240.4394373.70280.000209
25-0.084954-0.71580.23822
260.089260.75210.227232
27-0.142518-1.20090.116895
28-0.072429-0.61030.271808
290.1003550.84560.200306
30-0.185845-1.5660.060903
310.104050.87670.191793
32-0.050326-0.42410.336403
33-0.001369-0.01150.495415
34-0.073134-0.61620.269853
35-0.050002-0.42130.337396
360.2718782.29090.012471
37-0.04163-0.35080.363396
380.0532550.44870.327496
39-0.080415-0.67760.250117
40-0.064349-0.54220.294685
410.0546030.46010.323428
42-0.031064-0.26180.397135
430.0212770.17930.429112
44-0.046674-0.39330.347645
450.0357370.30110.382101
46-0.075424-0.63550.263561
47-0.091567-0.77160.221468
480.2333661.96640.026583

\begin{tabular}{lllllllll}
\hline
Autocorrelation Function \tabularnewline
Time lag k & ACF(k) & T-STAT & P-value \tabularnewline
1 & -0.24758 & -2.0861 & 0.02028 \tabularnewline
2 & -0.06654 & -0.5607 & 0.288391 \tabularnewline
3 & 0.010281 & 0.0866 & 0.465605 \tabularnewline
4 & -0.129071 & -1.0876 & 0.140231 \tabularnewline
5 & 0.079893 & 0.6732 & 0.251507 \tabularnewline
6 & -0.224875 & -1.8948 & 0.031093 \tabularnewline
7 & 0.207341 & 1.7471 & 0.042473 \tabularnewline
8 & -0.217928 & -1.8363 & 0.03525 \tabularnewline
9 & -0.01555 & -0.131 & 0.448062 \tabularnewline
10 & 0.006219 & 0.0524 & 0.479178 \tabularnewline
11 & -0.147246 & -1.2407 & 0.109397 \tabularnewline
12 & 0.521671 & 4.3957 & 1.9e-05 \tabularnewline
13 & -0.056121 & -0.4729 & 0.318873 \tabularnewline
14 & 0.033495 & 0.2822 & 0.389294 \tabularnewline
15 & -0.169949 & -1.432 & 0.078264 \tabularnewline
16 & -0.046199 & -0.3893 & 0.349118 \tabularnewline
17 & 0.129387 & 1.0902 & 0.139648 \tabularnewline
18 & -0.236576 & -1.9934 & 0.025029 \tabularnewline
19 & 0.117719 & 0.9919 & 0.162304 \tabularnewline
20 & -0.102577 & -0.8643 & 0.195158 \tabularnewline
21 & -0.02022 & -0.1704 & 0.4326 \tabularnewline
22 & -0.077913 & -0.6565 & 0.25681 \tabularnewline
23 & -0.073262 & -0.6173 & 0.2695 \tabularnewline
24 & 0.439437 & 3.7028 & 0.000209 \tabularnewline
25 & -0.084954 & -0.7158 & 0.23822 \tabularnewline
26 & 0.08926 & 0.7521 & 0.227232 \tabularnewline
27 & -0.142518 & -1.2009 & 0.116895 \tabularnewline
28 & -0.072429 & -0.6103 & 0.271808 \tabularnewline
29 & 0.100355 & 0.8456 & 0.200306 \tabularnewline
30 & -0.185845 & -1.566 & 0.060903 \tabularnewline
31 & 0.10405 & 0.8767 & 0.191793 \tabularnewline
32 & -0.050326 & -0.4241 & 0.336403 \tabularnewline
33 & -0.001369 & -0.0115 & 0.495415 \tabularnewline
34 & -0.073134 & -0.6162 & 0.269853 \tabularnewline
35 & -0.050002 & -0.4213 & 0.337396 \tabularnewline
36 & 0.271878 & 2.2909 & 0.012471 \tabularnewline
37 & -0.04163 & -0.3508 & 0.363396 \tabularnewline
38 & 0.053255 & 0.4487 & 0.327496 \tabularnewline
39 & -0.080415 & -0.6776 & 0.250117 \tabularnewline
40 & -0.064349 & -0.5422 & 0.294685 \tabularnewline
41 & 0.054603 & 0.4601 & 0.323428 \tabularnewline
42 & -0.031064 & -0.2618 & 0.397135 \tabularnewline
43 & 0.021277 & 0.1793 & 0.429112 \tabularnewline
44 & -0.046674 & -0.3933 & 0.347645 \tabularnewline
45 & 0.035737 & 0.3011 & 0.382101 \tabularnewline
46 & -0.075424 & -0.6355 & 0.263561 \tabularnewline
47 & -0.091567 & -0.7716 & 0.221468 \tabularnewline
48 & 0.233366 & 1.9664 & 0.026583 \tabularnewline
\hline
\end{tabular}
%Source: https://freestatistics.org/blog/index.php?pk=243497&T=1

[TABLE]
[ROW][C]Autocorrelation Function[/C][/ROW]
[ROW][C]Time lag k[/C][C]ACF(k)[/C][C]T-STAT[/C][C]P-value[/C][/ROW]
[ROW][C]1[/C][C]-0.24758[/C][C]-2.0861[/C][C]0.02028[/C][/ROW]
[ROW][C]2[/C][C]-0.06654[/C][C]-0.5607[/C][C]0.288391[/C][/ROW]
[ROW][C]3[/C][C]0.010281[/C][C]0.0866[/C][C]0.465605[/C][/ROW]
[ROW][C]4[/C][C]-0.129071[/C][C]-1.0876[/C][C]0.140231[/C][/ROW]
[ROW][C]5[/C][C]0.079893[/C][C]0.6732[/C][C]0.251507[/C][/ROW]
[ROW][C]6[/C][C]-0.224875[/C][C]-1.8948[/C][C]0.031093[/C][/ROW]
[ROW][C]7[/C][C]0.207341[/C][C]1.7471[/C][C]0.042473[/C][/ROW]
[ROW][C]8[/C][C]-0.217928[/C][C]-1.8363[/C][C]0.03525[/C][/ROW]
[ROW][C]9[/C][C]-0.01555[/C][C]-0.131[/C][C]0.448062[/C][/ROW]
[ROW][C]10[/C][C]0.006219[/C][C]0.0524[/C][C]0.479178[/C][/ROW]
[ROW][C]11[/C][C]-0.147246[/C][C]-1.2407[/C][C]0.109397[/C][/ROW]
[ROW][C]12[/C][C]0.521671[/C][C]4.3957[/C][C]1.9e-05[/C][/ROW]
[ROW][C]13[/C][C]-0.056121[/C][C]-0.4729[/C][C]0.318873[/C][/ROW]
[ROW][C]14[/C][C]0.033495[/C][C]0.2822[/C][C]0.389294[/C][/ROW]
[ROW][C]15[/C][C]-0.169949[/C][C]-1.432[/C][C]0.078264[/C][/ROW]
[ROW][C]16[/C][C]-0.046199[/C][C]-0.3893[/C][C]0.349118[/C][/ROW]
[ROW][C]17[/C][C]0.129387[/C][C]1.0902[/C][C]0.139648[/C][/ROW]
[ROW][C]18[/C][C]-0.236576[/C][C]-1.9934[/C][C]0.025029[/C][/ROW]
[ROW][C]19[/C][C]0.117719[/C][C]0.9919[/C][C]0.162304[/C][/ROW]
[ROW][C]20[/C][C]-0.102577[/C][C]-0.8643[/C][C]0.195158[/C][/ROW]
[ROW][C]21[/C][C]-0.02022[/C][C]-0.1704[/C][C]0.4326[/C][/ROW]
[ROW][C]22[/C][C]-0.077913[/C][C]-0.6565[/C][C]0.25681[/C][/ROW]
[ROW][C]23[/C][C]-0.073262[/C][C]-0.6173[/C][C]0.2695[/C][/ROW]
[ROW][C]24[/C][C]0.439437[/C][C]3.7028[/C][C]0.000209[/C][/ROW]
[ROW][C]25[/C][C]-0.084954[/C][C]-0.7158[/C][C]0.23822[/C][/ROW]
[ROW][C]26[/C][C]0.08926[/C][C]0.7521[/C][C]0.227232[/C][/ROW]
[ROW][C]27[/C][C]-0.142518[/C][C]-1.2009[/C][C]0.116895[/C][/ROW]
[ROW][C]28[/C][C]-0.072429[/C][C]-0.6103[/C][C]0.271808[/C][/ROW]
[ROW][C]29[/C][C]0.100355[/C][C]0.8456[/C][C]0.200306[/C][/ROW]
[ROW][C]30[/C][C]-0.185845[/C][C]-1.566[/C][C]0.060903[/C][/ROW]
[ROW][C]31[/C][C]0.10405[/C][C]0.8767[/C][C]0.191793[/C][/ROW]
[ROW][C]32[/C][C]-0.050326[/C][C]-0.4241[/C][C]0.336403[/C][/ROW]
[ROW][C]33[/C][C]-0.001369[/C][C]-0.0115[/C][C]0.495415[/C][/ROW]
[ROW][C]34[/C][C]-0.073134[/C][C]-0.6162[/C][C]0.269853[/C][/ROW]
[ROW][C]35[/C][C]-0.050002[/C][C]-0.4213[/C][C]0.337396[/C][/ROW]
[ROW][C]36[/C][C]0.271878[/C][C]2.2909[/C][C]0.012471[/C][/ROW]
[ROW][C]37[/C][C]-0.04163[/C][C]-0.3508[/C][C]0.363396[/C][/ROW]
[ROW][C]38[/C][C]0.053255[/C][C]0.4487[/C][C]0.327496[/C][/ROW]
[ROW][C]39[/C][C]-0.080415[/C][C]-0.6776[/C][C]0.250117[/C][/ROW]
[ROW][C]40[/C][C]-0.064349[/C][C]-0.5422[/C][C]0.294685[/C][/ROW]
[ROW][C]41[/C][C]0.054603[/C][C]0.4601[/C][C]0.323428[/C][/ROW]
[ROW][C]42[/C][C]-0.031064[/C][C]-0.2618[/C][C]0.397135[/C][/ROW]
[ROW][C]43[/C][C]0.021277[/C][C]0.1793[/C][C]0.429112[/C][/ROW]
[ROW][C]44[/C][C]-0.046674[/C][C]-0.3933[/C][C]0.347645[/C][/ROW]
[ROW][C]45[/C][C]0.035737[/C][C]0.3011[/C][C]0.382101[/C][/ROW]
[ROW][C]46[/C][C]-0.075424[/C][C]-0.6355[/C][C]0.263561[/C][/ROW]
[ROW][C]47[/C][C]-0.091567[/C][C]-0.7716[/C][C]0.221468[/C][/ROW]
[ROW][C]48[/C][C]0.233366[/C][C]1.9664[/C][C]0.026583[/C][/ROW]
[/TABLE]
Source: https://freestatistics.org/blog/index.php?pk=243497&T=1

Globally Unique Identifier (entire table): ba.freestatistics.org/blog/index.php?pk=243497&T=1

As an alternative you can also use a QR Code:  

The GUIDs for individual cells are displayed in the table below:

Autocorrelation Function
Time lag kACF(k)T-STATP-value
1-0.24758-2.08610.02028
2-0.06654-0.56070.288391
30.0102810.08660.465605
4-0.129071-1.08760.140231
50.0798930.67320.251507
6-0.224875-1.89480.031093
70.2073411.74710.042473
8-0.217928-1.83630.03525
9-0.01555-0.1310.448062
100.0062190.05240.479178
11-0.147246-1.24070.109397
120.5216714.39571.9e-05
13-0.056121-0.47290.318873
140.0334950.28220.389294
15-0.169949-1.4320.078264
16-0.046199-0.38930.349118
170.1293871.09020.139648
18-0.236576-1.99340.025029
190.1177190.99190.162304
20-0.102577-0.86430.195158
21-0.02022-0.17040.4326
22-0.077913-0.65650.25681
23-0.073262-0.61730.2695
240.4394373.70280.000209
25-0.084954-0.71580.23822
260.089260.75210.227232
27-0.142518-1.20090.116895
28-0.072429-0.61030.271808
290.1003550.84560.200306
30-0.185845-1.5660.060903
310.104050.87670.191793
32-0.050326-0.42410.336403
33-0.001369-0.01150.495415
34-0.073134-0.61620.269853
35-0.050002-0.42130.337396
360.2718782.29090.012471
37-0.04163-0.35080.363396
380.0532550.44870.327496
39-0.080415-0.67760.250117
40-0.064349-0.54220.294685
410.0546030.46010.323428
42-0.031064-0.26180.397135
430.0212770.17930.429112
44-0.046674-0.39330.347645
450.0357370.30110.382101
46-0.075424-0.63550.263561
47-0.091567-0.77160.221468
480.2333661.96640.026583


Partial Autocorrelation Function
Time lag kPACF(k)T-STATP-value
1-0.24758-2.08610.02028
2-0.136184-1.14750.127513
3-0.045754-0.38550.350499
4-0.160285-1.35060.090559
5-0.002436-0.02050.491842
6-0.261242-2.20130.015485
70.0900150.75850.225338
8-0.263822-2.2230.0147
9-0.119169-1.00410.159362
10-0.214003-1.80320.037798
11-0.257644-2.1710.01664
120.3448552.90580.002441
130.203541.71510.045348
140.1568641.32180.095245
15-0.137285-1.15680.125619
16-0.083736-0.70560.24138
170.0553140.46610.321292
18-0.02033-0.17130.432235
19-0.114518-0.96490.168925
20-0.022541-0.18990.424951
21-0.035993-0.30330.381282
22-0.085193-0.71790.237603
23-0.139276-1.17360.122246
240.1145140.96490.168931
25-0.004123-0.03470.486193
260.0591250.49820.309942
27-0.043645-0.36780.357074
28-0.038403-0.32360.373601
29-0.022584-0.19030.42481
30-0.072-0.60670.272997
31-0.053909-0.45420.325518
320.1167020.98330.164388
330.0163610.13790.445371
340.0152330.12840.449117
350.0086230.07270.471143
36-0.077347-0.65170.258338
37-0.072623-0.61190.271269
38-0.126418-1.06520.145193
390.029920.25210.400842
40-0.007897-0.06650.473567
41-0.02624-0.22110.412824
420.1411341.18920.119158
430.0139750.11780.453298
44-0.018174-0.15310.439364
45-0.016361-0.13790.44537
46-0.020423-0.17210.431929
47-0.045341-0.3820.351784
480.0277560.23390.407877

\begin{tabular}{lllllllll}
\hline
Partial Autocorrelation Function \tabularnewline
Time lag k & PACF(k) & T-STAT & P-value \tabularnewline
1 & -0.24758 & -2.0861 & 0.02028 \tabularnewline
2 & -0.136184 & -1.1475 & 0.127513 \tabularnewline
3 & -0.045754 & -0.3855 & 0.350499 \tabularnewline
4 & -0.160285 & -1.3506 & 0.090559 \tabularnewline
5 & -0.002436 & -0.0205 & 0.491842 \tabularnewline
6 & -0.261242 & -2.2013 & 0.015485 \tabularnewline
7 & 0.090015 & 0.7585 & 0.225338 \tabularnewline
8 & -0.263822 & -2.223 & 0.0147 \tabularnewline
9 & -0.119169 & -1.0041 & 0.159362 \tabularnewline
10 & -0.214003 & -1.8032 & 0.037798 \tabularnewline
11 & -0.257644 & -2.171 & 0.01664 \tabularnewline
12 & 0.344855 & 2.9058 & 0.002441 \tabularnewline
13 & 0.20354 & 1.7151 & 0.045348 \tabularnewline
14 & 0.156864 & 1.3218 & 0.095245 \tabularnewline
15 & -0.137285 & -1.1568 & 0.125619 \tabularnewline
16 & -0.083736 & -0.7056 & 0.24138 \tabularnewline
17 & 0.055314 & 0.4661 & 0.321292 \tabularnewline
18 & -0.02033 & -0.1713 & 0.432235 \tabularnewline
19 & -0.114518 & -0.9649 & 0.168925 \tabularnewline
20 & -0.022541 & -0.1899 & 0.424951 \tabularnewline
21 & -0.035993 & -0.3033 & 0.381282 \tabularnewline
22 & -0.085193 & -0.7179 & 0.237603 \tabularnewline
23 & -0.139276 & -1.1736 & 0.122246 \tabularnewline
24 & 0.114514 & 0.9649 & 0.168931 \tabularnewline
25 & -0.004123 & -0.0347 & 0.486193 \tabularnewline
26 & 0.059125 & 0.4982 & 0.309942 \tabularnewline
27 & -0.043645 & -0.3678 & 0.357074 \tabularnewline
28 & -0.038403 & -0.3236 & 0.373601 \tabularnewline
29 & -0.022584 & -0.1903 & 0.42481 \tabularnewline
30 & -0.072 & -0.6067 & 0.272997 \tabularnewline
31 & -0.053909 & -0.4542 & 0.325518 \tabularnewline
32 & 0.116702 & 0.9833 & 0.164388 \tabularnewline
33 & 0.016361 & 0.1379 & 0.445371 \tabularnewline
34 & 0.015233 & 0.1284 & 0.449117 \tabularnewline
35 & 0.008623 & 0.0727 & 0.471143 \tabularnewline
36 & -0.077347 & -0.6517 & 0.258338 \tabularnewline
37 & -0.072623 & -0.6119 & 0.271269 \tabularnewline
38 & -0.126418 & -1.0652 & 0.145193 \tabularnewline
39 & 0.02992 & 0.2521 & 0.400842 \tabularnewline
40 & -0.007897 & -0.0665 & 0.473567 \tabularnewline
41 & -0.02624 & -0.2211 & 0.412824 \tabularnewline
42 & 0.141134 & 1.1892 & 0.119158 \tabularnewline
43 & 0.013975 & 0.1178 & 0.453298 \tabularnewline
44 & -0.018174 & -0.1531 & 0.439364 \tabularnewline
45 & -0.016361 & -0.1379 & 0.44537 \tabularnewline
46 & -0.020423 & -0.1721 & 0.431929 \tabularnewline
47 & -0.045341 & -0.382 & 0.351784 \tabularnewline
48 & 0.027756 & 0.2339 & 0.407877 \tabularnewline
\hline
\end{tabular}
%Source: https://freestatistics.org/blog/index.php?pk=243497&T=2

[TABLE]
[ROW][C]Partial Autocorrelation Function[/C][/ROW]
[ROW][C]Time lag k[/C][C]PACF(k)[/C][C]T-STAT[/C][C]P-value[/C][/ROW]
[ROW][C]1[/C][C]-0.24758[/C][C]-2.0861[/C][C]0.02028[/C][/ROW]
[ROW][C]2[/C][C]-0.136184[/C][C]-1.1475[/C][C]0.127513[/C][/ROW]
[ROW][C]3[/C][C]-0.045754[/C][C]-0.3855[/C][C]0.350499[/C][/ROW]
[ROW][C]4[/C][C]-0.160285[/C][C]-1.3506[/C][C]0.090559[/C][/ROW]
[ROW][C]5[/C][C]-0.002436[/C][C]-0.0205[/C][C]0.491842[/C][/ROW]
[ROW][C]6[/C][C]-0.261242[/C][C]-2.2013[/C][C]0.015485[/C][/ROW]
[ROW][C]7[/C][C]0.090015[/C][C]0.7585[/C][C]0.225338[/C][/ROW]
[ROW][C]8[/C][C]-0.263822[/C][C]-2.223[/C][C]0.0147[/C][/ROW]
[ROW][C]9[/C][C]-0.119169[/C][C]-1.0041[/C][C]0.159362[/C][/ROW]
[ROW][C]10[/C][C]-0.214003[/C][C]-1.8032[/C][C]0.037798[/C][/ROW]
[ROW][C]11[/C][C]-0.257644[/C][C]-2.171[/C][C]0.01664[/C][/ROW]
[ROW][C]12[/C][C]0.344855[/C][C]2.9058[/C][C]0.002441[/C][/ROW]
[ROW][C]13[/C][C]0.20354[/C][C]1.7151[/C][C]0.045348[/C][/ROW]
[ROW][C]14[/C][C]0.156864[/C][C]1.3218[/C][C]0.095245[/C][/ROW]
[ROW][C]15[/C][C]-0.137285[/C][C]-1.1568[/C][C]0.125619[/C][/ROW]
[ROW][C]16[/C][C]-0.083736[/C][C]-0.7056[/C][C]0.24138[/C][/ROW]
[ROW][C]17[/C][C]0.055314[/C][C]0.4661[/C][C]0.321292[/C][/ROW]
[ROW][C]18[/C][C]-0.02033[/C][C]-0.1713[/C][C]0.432235[/C][/ROW]
[ROW][C]19[/C][C]-0.114518[/C][C]-0.9649[/C][C]0.168925[/C][/ROW]
[ROW][C]20[/C][C]-0.022541[/C][C]-0.1899[/C][C]0.424951[/C][/ROW]
[ROW][C]21[/C][C]-0.035993[/C][C]-0.3033[/C][C]0.381282[/C][/ROW]
[ROW][C]22[/C][C]-0.085193[/C][C]-0.7179[/C][C]0.237603[/C][/ROW]
[ROW][C]23[/C][C]-0.139276[/C][C]-1.1736[/C][C]0.122246[/C][/ROW]
[ROW][C]24[/C][C]0.114514[/C][C]0.9649[/C][C]0.168931[/C][/ROW]
[ROW][C]25[/C][C]-0.004123[/C][C]-0.0347[/C][C]0.486193[/C][/ROW]
[ROW][C]26[/C][C]0.059125[/C][C]0.4982[/C][C]0.309942[/C][/ROW]
[ROW][C]27[/C][C]-0.043645[/C][C]-0.3678[/C][C]0.357074[/C][/ROW]
[ROW][C]28[/C][C]-0.038403[/C][C]-0.3236[/C][C]0.373601[/C][/ROW]
[ROW][C]29[/C][C]-0.022584[/C][C]-0.1903[/C][C]0.42481[/C][/ROW]
[ROW][C]30[/C][C]-0.072[/C][C]-0.6067[/C][C]0.272997[/C][/ROW]
[ROW][C]31[/C][C]-0.053909[/C][C]-0.4542[/C][C]0.325518[/C][/ROW]
[ROW][C]32[/C][C]0.116702[/C][C]0.9833[/C][C]0.164388[/C][/ROW]
[ROW][C]33[/C][C]0.016361[/C][C]0.1379[/C][C]0.445371[/C][/ROW]
[ROW][C]34[/C][C]0.015233[/C][C]0.1284[/C][C]0.449117[/C][/ROW]
[ROW][C]35[/C][C]0.008623[/C][C]0.0727[/C][C]0.471143[/C][/ROW]
[ROW][C]36[/C][C]-0.077347[/C][C]-0.6517[/C][C]0.258338[/C][/ROW]
[ROW][C]37[/C][C]-0.072623[/C][C]-0.6119[/C][C]0.271269[/C][/ROW]
[ROW][C]38[/C][C]-0.126418[/C][C]-1.0652[/C][C]0.145193[/C][/ROW]
[ROW][C]39[/C][C]0.02992[/C][C]0.2521[/C][C]0.400842[/C][/ROW]
[ROW][C]40[/C][C]-0.007897[/C][C]-0.0665[/C][C]0.473567[/C][/ROW]
[ROW][C]41[/C][C]-0.02624[/C][C]-0.2211[/C][C]0.412824[/C][/ROW]
[ROW][C]42[/C][C]0.141134[/C][C]1.1892[/C][C]0.119158[/C][/ROW]
[ROW][C]43[/C][C]0.013975[/C][C]0.1178[/C][C]0.453298[/C][/ROW]
[ROW][C]44[/C][C]-0.018174[/C][C]-0.1531[/C][C]0.439364[/C][/ROW]
[ROW][C]45[/C][C]-0.016361[/C][C]-0.1379[/C][C]0.44537[/C][/ROW]
[ROW][C]46[/C][C]-0.020423[/C][C]-0.1721[/C][C]0.431929[/C][/ROW]
[ROW][C]47[/C][C]-0.045341[/C][C]-0.382[/C][C]0.351784[/C][/ROW]
[ROW][C]48[/C][C]0.027756[/C][C]0.2339[/C][C]0.407877[/C][/ROW]
[/TABLE]
Source: https://freestatistics.org/blog/index.php?pk=243497&T=2

Globally Unique Identifier (entire table): ba.freestatistics.org/blog/index.php?pk=243497&T=2

As an alternative you can also use a QR Code:  

The GUIDs for individual cells are displayed in the table below:

Partial Autocorrelation Function
Time lag kPACF(k)T-STATP-value
1-0.24758-2.08610.02028
2-0.136184-1.14750.127513
3-0.045754-0.38550.350499
4-0.160285-1.35060.090559
5-0.002436-0.02050.491842
6-0.261242-2.20130.015485
70.0900150.75850.225338
8-0.263822-2.2230.0147
9-0.119169-1.00410.159362
10-0.214003-1.80320.037798
11-0.257644-2.1710.01664
120.3448552.90580.002441
130.203541.71510.045348
140.1568641.32180.095245
15-0.137285-1.15680.125619
16-0.083736-0.70560.24138
170.0553140.46610.321292
18-0.02033-0.17130.432235
19-0.114518-0.96490.168925
20-0.022541-0.18990.424951
21-0.035993-0.30330.381282
22-0.085193-0.71790.237603
23-0.139276-1.17360.122246
240.1145140.96490.168931
25-0.004123-0.03470.486193
260.0591250.49820.309942
27-0.043645-0.36780.357074
28-0.038403-0.32360.373601
29-0.022584-0.19030.42481
30-0.072-0.60670.272997
31-0.053909-0.45420.325518
320.1167020.98330.164388
330.0163610.13790.445371
340.0152330.12840.449117
350.0086230.07270.471143
36-0.077347-0.65170.258338
37-0.072623-0.61190.271269
38-0.126418-1.06520.145193
390.029920.25210.400842
40-0.007897-0.06650.473567
41-0.02624-0.22110.412824
420.1411341.18920.119158
430.0139750.11780.453298
44-0.018174-0.15310.439364
45-0.016361-0.13790.44537
46-0.020423-0.17210.431929
47-0.045341-0.3820.351784
480.0277560.23390.407877


Parameters (Session):
par1 = 48 ; par2 = 1 ; par3 = 1 ; par4 = 0 ; par5 = 12 ; par6 = White Noise ; par7 = 0.95 ;
Parameters (R input):
par1 = 48 ; par2 = 1 ; par3 = 1 ; par4 = 0 ; par5 = 12 ; par6 = White Noise ; par7 = 0.95 ; par8 = ;
R code (references can be found in the software module):
if (par1 == 'Default') {
par1 = 10*log10(length(x))
} else {
par1 <- as.numeric(par1)
}
par2 <- as.numeric(par2)
par3 <- as.numeric(par3)
par4 <- as.numeric(par4)
par5 <- as.numeric(par5)
if (par6 == 'White Noise') par6 <- 'white' else par6 <- 'ma'
par7 <- as.numeric(par7)
if (par8 != '') par8 <- as.numeric(par8)
ox <- x
if (par8 == '') {
if (par2 == 0) {
x <- log(x)
} else {
x <- (x ^ par2 - 1) / par2
}
} else {
x <- log(x,base=par8)
}
if (par3 > 0) x <- diff(x,lag=1,difference=par3)
if (par4 > 0) x <- diff(x,lag=par5,difference=par4)
bitmap(file='picts.png')
op <- par(mfrow=c(2,1))
plot(ox,type='l',main='Original Time Series',xlab='time',ylab='value')
if (par8=='') {
mytitle <- paste('Working Time Series (lambda=',par2,', d=',par3,', D=',par4,')',sep='')
mysub <- paste('(lambda=',par2,', d=',par3,', D=',par4,', CI=', par7, ', CI type=',par6,')',sep='')
} else {
mytitle <- paste('Working Time Series (base=',par8,', d=',par3,', D=',par4,')',sep='')
mysub <- paste('(base=',par8,', d=',par3,', D=',par4,', CI=', par7, ', CI type=',par6,')',sep='')
}
plot(x,type='l', main=mytitle,xlab='time',ylab='value')
par(op)
dev.off()
bitmap(file='pic1.png')
racf <- acf(x, par1, main='Autocorrelation', xlab='time lag', ylab='ACF', ci.type=par6, ci=par7, sub=mysub)
dev.off()
bitmap(file='pic2.png')
rpacf <- pacf(x,par1,main='Partial Autocorrelation',xlab='lags',ylab='PACF',sub=mysub)
dev.off()
(myacf <- c(racf$acf))
(mypacf <- c(rpacf$acf))
lengthx <- length(x)
sqrtn <- sqrt(lengthx)
load(file='createtable')
a<-table.start()
a<-table.row.start(a)
a<-table.element(a,'Autocorrelation Function',4,TRUE)
a<-table.row.end(a)
a<-table.row.start(a)
a<-table.element(a,'Time lag k',header=TRUE)
a<-table.element(a,hyperlink('basics.htm','ACF(k)','click here for more information about the Autocorrelation Function'),header=TRUE)
a<-table.element(a,'T-STAT',header=TRUE)
a<-table.element(a,'P-value',header=TRUE)
a<-table.row.end(a)
for (i in 2:(par1+1)) {
a<-table.row.start(a)
a<-table.element(a,i-1,header=TRUE)
a<-table.element(a,round(myacf[i],6))
mytstat <- myacf[i]*sqrtn
a<-table.element(a,round(mytstat,4))
a<-table.element(a,round(1-pt(abs(mytstat),lengthx),6))
a<-table.row.end(a)
}
a<-table.end(a)
table.save(a,file='mytable.tab')
a<-table.start()
a<-table.row.start(a)
a<-table.element(a,'Partial Autocorrelation Function',4,TRUE)
a<-table.row.end(a)
a<-table.row.start(a)
a<-table.element(a,'Time lag k',header=TRUE)
a<-table.element(a,hyperlink('basics.htm','PACF(k)','click here for more information about the Partial Autocorrelation Function'),header=TRUE)
a<-table.element(a,'T-STAT',header=TRUE)
a<-table.element(a,'P-value',header=TRUE)
a<-table.row.end(a)
for (i in 1:par1) {
a<-table.row.start(a)
a<-table.element(a,i,header=TRUE)
a<-table.element(a,round(mypacf[i],6))
mytstat <- mypacf[i]*sqrtn
a<-table.element(a,round(mytstat,4))
a<-table.element(a,round(1-pt(abs(mytstat),lengthx),6))
a<-table.row.end(a)
}
a<-table.end(a)
table.save(a,file='mytable1.tab')