Free Statistics

of Irreproducible Research!

Author's title

Author*Unverified author*
R Software Modulerwasp_autocorrelation.wasp
Title produced by software(Partial) Autocorrelation Function
Date of computationSat, 18 Oct 2014 14:12:29 +0100
Cite this page as followsStatistical Computations at FreeStatistics.org, Office for Research Development and Education, URL https://freestatistics.org/blog/index.php?v=date/2014/Oct/18/t1413637981ekzghaex6h6f0i3.htm/, Retrieved Mon, 13 May 2024 01:32:04 +0000
Statistical Computations at FreeStatistics.org, Office for Research Development and Education, URL https://freestatistics.org/blog/index.php?pk=243484, Retrieved Mon, 13 May 2024 01:32:04 +0000
QR Codes:

Original text written by user:
IsPrivate?No (this computation is public)
User-defined keywords
Estimated Impact65
Family? (F = Feedback message, R = changed R code, M = changed R Module, P = changed Parameters, D = changed Data)
-       [(Partial) Autocorrelation Function] [] [2014-10-18 13:12:29] [ba3f7115fe3efa85f8b130de707d46eb] [Current]
Feedback Forum

Post a new message
Dataseries X:
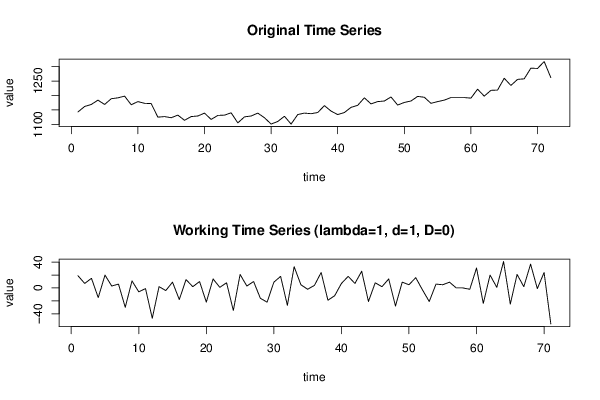
1143
1162
1169
1184
1169
1189
1192
1198
1168
1179
1173
1172
1125
1127
1123
1132
1114
1127
1129
1139
1117
1131
1132
1140
1105
1126
1129
1139
1123
1101
1110
1128
1101
1134
1139
1137
1141
1165
1146
1134
1141
1159
1166
1192
1171
1179
1181
1195
1167
1176
1181
1197
1194
1173
1179
1184
1193
1193
1193
1191
1222
1198
1218
1219
1260
1235
1256
1258
1295
1294
1318
1262


Summary of computational transaction
Raw Inputview raw input (R code)
Raw Outputview raw output of R engine
Computing time1 seconds
R Server'George Udny Yule' @ yule.wessa.net

\begin{tabular}{lllllllll}
\hline
Summary of computational transaction \tabularnewline
Raw Input & view raw input (R code)  \tabularnewline
Raw Output & view raw output of R engine  \tabularnewline
Computing time & 1 seconds \tabularnewline
R Server & 'George Udny Yule' @ yule.wessa.net \tabularnewline
\hline
\end{tabular}
%Source: https://freestatistics.org/blog/index.php?pk=243484&T=0

[TABLE]
[ROW][C]Summary of computational transaction[/C][/ROW]
[ROW][C]Raw Input[/C][C]view raw input (R code) [/C][/ROW]
[ROW][C]Raw Output[/C][C]view raw output of R engine [/C][/ROW]
[ROW][C]Computing time[/C][C]1 seconds[/C][/ROW]
[ROW][C]R Server[/C][C]'George Udny Yule' @ yule.wessa.net[/C][/ROW]
[/TABLE]
Source: https://freestatistics.org/blog/index.php?pk=243484&T=0

Globally Unique Identifier (entire table): ba.freestatistics.org/blog/index.php?pk=243484&T=0

As an alternative you can also use a QR Code:  

The GUIDs for individual cells are displayed in the table below:

Summary of computational transaction
Raw Inputview raw input (R code)
Raw Outputview raw output of R engine
Computing time1 seconds
R Server'George Udny Yule' @ yule.wessa.net


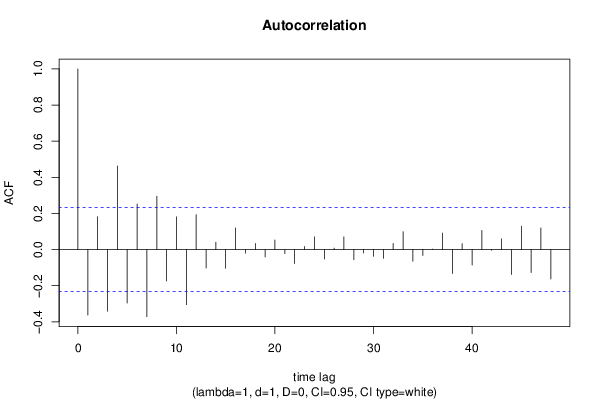
Autocorrelation Function
Time lag kACF(k)T-STATP-value
1-0.362355-3.05330.001592
20.1820271.53380.064763
3-0.34164-2.87870.002636
40.4630263.90150.000107
5-0.295866-2.4930.0075
60.2524882.12750.018426
7-0.371449-3.12990.001269
80.2951742.48720.007614
9-0.173857-1.46490.073675
100.1809521.52470.065884
11-0.304882-2.5690.006151
120.1927411.62410.054397
13-0.102144-0.86070.196156
140.0401810.33860.367966
15-0.103473-0.87190.193105
160.1198111.00950.158072
17-0.01976-0.16650.434118
180.0335140.28240.389233
19-0.04131-0.34810.364405
200.0525590.44290.329604
21-0.022556-0.19010.424903
22-0.077676-0.65450.25745
230.0166080.13990.44455
240.0704020.59320.27746
25-0.052186-0.43970.330736
260.0082080.06920.472528
270.0702330.59180.277934
28-0.056502-0.47610.317734
29-0.01914-0.16130.436168
30-0.037423-0.31530.376718
31-0.048684-0.41020.341442
320.0332780.28040.389992
330.0991850.83570.20305
34-0.064775-0.54580.293456
35-0.032607-0.27470.392153
360.0023830.02010.492017
370.0912020.76850.222375
38-0.132169-1.11370.134587
390.0327960.27630.391544
40-0.085718-0.72230.236249
410.1052970.88720.188971
42-0.003922-0.03310.486864
430.0594050.50060.309117
44-0.137823-1.16130.124701
450.1291991.08860.139996
46-0.127264-1.07230.143598
470.1191741.00420.159352
48-0.162732-1.37120.087314

\begin{tabular}{lllllllll}
\hline
Autocorrelation Function \tabularnewline
Time lag k & ACF(k) & T-STAT & P-value \tabularnewline
1 & -0.362355 & -3.0533 & 0.001592 \tabularnewline
2 & 0.182027 & 1.5338 & 0.064763 \tabularnewline
3 & -0.34164 & -2.8787 & 0.002636 \tabularnewline
4 & 0.463026 & 3.9015 & 0.000107 \tabularnewline
5 & -0.295866 & -2.493 & 0.0075 \tabularnewline
6 & 0.252488 & 2.1275 & 0.018426 \tabularnewline
7 & -0.371449 & -3.1299 & 0.001269 \tabularnewline
8 & 0.295174 & 2.4872 & 0.007614 \tabularnewline
9 & -0.173857 & -1.4649 & 0.073675 \tabularnewline
10 & 0.180952 & 1.5247 & 0.065884 \tabularnewline
11 & -0.304882 & -2.569 & 0.006151 \tabularnewline
12 & 0.192741 & 1.6241 & 0.054397 \tabularnewline
13 & -0.102144 & -0.8607 & 0.196156 \tabularnewline
14 & 0.040181 & 0.3386 & 0.367966 \tabularnewline
15 & -0.103473 & -0.8719 & 0.193105 \tabularnewline
16 & 0.119811 & 1.0095 & 0.158072 \tabularnewline
17 & -0.01976 & -0.1665 & 0.434118 \tabularnewline
18 & 0.033514 & 0.2824 & 0.389233 \tabularnewline
19 & -0.04131 & -0.3481 & 0.364405 \tabularnewline
20 & 0.052559 & 0.4429 & 0.329604 \tabularnewline
21 & -0.022556 & -0.1901 & 0.424903 \tabularnewline
22 & -0.077676 & -0.6545 & 0.25745 \tabularnewline
23 & 0.016608 & 0.1399 & 0.44455 \tabularnewline
24 & 0.070402 & 0.5932 & 0.27746 \tabularnewline
25 & -0.052186 & -0.4397 & 0.330736 \tabularnewline
26 & 0.008208 & 0.0692 & 0.472528 \tabularnewline
27 & 0.070233 & 0.5918 & 0.277934 \tabularnewline
28 & -0.056502 & -0.4761 & 0.317734 \tabularnewline
29 & -0.01914 & -0.1613 & 0.436168 \tabularnewline
30 & -0.037423 & -0.3153 & 0.376718 \tabularnewline
31 & -0.048684 & -0.4102 & 0.341442 \tabularnewline
32 & 0.033278 & 0.2804 & 0.389992 \tabularnewline
33 & 0.099185 & 0.8357 & 0.20305 \tabularnewline
34 & -0.064775 & -0.5458 & 0.293456 \tabularnewline
35 & -0.032607 & -0.2747 & 0.392153 \tabularnewline
36 & 0.002383 & 0.0201 & 0.492017 \tabularnewline
37 & 0.091202 & 0.7685 & 0.222375 \tabularnewline
38 & -0.132169 & -1.1137 & 0.134587 \tabularnewline
39 & 0.032796 & 0.2763 & 0.391544 \tabularnewline
40 & -0.085718 & -0.7223 & 0.236249 \tabularnewline
41 & 0.105297 & 0.8872 & 0.188971 \tabularnewline
42 & -0.003922 & -0.0331 & 0.486864 \tabularnewline
43 & 0.059405 & 0.5006 & 0.309117 \tabularnewline
44 & -0.137823 & -1.1613 & 0.124701 \tabularnewline
45 & 0.129199 & 1.0886 & 0.139996 \tabularnewline
46 & -0.127264 & -1.0723 & 0.143598 \tabularnewline
47 & 0.119174 & 1.0042 & 0.159352 \tabularnewline
48 & -0.162732 & -1.3712 & 0.087314 \tabularnewline
\hline
\end{tabular}
%Source: https://freestatistics.org/blog/index.php?pk=243484&T=1

[TABLE]
[ROW][C]Autocorrelation Function[/C][/ROW]
[ROW][C]Time lag k[/C][C]ACF(k)[/C][C]T-STAT[/C][C]P-value[/C][/ROW]
[ROW][C]1[/C][C]-0.362355[/C][C]-3.0533[/C][C]0.001592[/C][/ROW]
[ROW][C]2[/C][C]0.182027[/C][C]1.5338[/C][C]0.064763[/C][/ROW]
[ROW][C]3[/C][C]-0.34164[/C][C]-2.8787[/C][C]0.002636[/C][/ROW]
[ROW][C]4[/C][C]0.463026[/C][C]3.9015[/C][C]0.000107[/C][/ROW]
[ROW][C]5[/C][C]-0.295866[/C][C]-2.493[/C][C]0.0075[/C][/ROW]
[ROW][C]6[/C][C]0.252488[/C][C]2.1275[/C][C]0.018426[/C][/ROW]
[ROW][C]7[/C][C]-0.371449[/C][C]-3.1299[/C][C]0.001269[/C][/ROW]
[ROW][C]8[/C][C]0.295174[/C][C]2.4872[/C][C]0.007614[/C][/ROW]
[ROW][C]9[/C][C]-0.173857[/C][C]-1.4649[/C][C]0.073675[/C][/ROW]
[ROW][C]10[/C][C]0.180952[/C][C]1.5247[/C][C]0.065884[/C][/ROW]
[ROW][C]11[/C][C]-0.304882[/C][C]-2.569[/C][C]0.006151[/C][/ROW]
[ROW][C]12[/C][C]0.192741[/C][C]1.6241[/C][C]0.054397[/C][/ROW]
[ROW][C]13[/C][C]-0.102144[/C][C]-0.8607[/C][C]0.196156[/C][/ROW]
[ROW][C]14[/C][C]0.040181[/C][C]0.3386[/C][C]0.367966[/C][/ROW]
[ROW][C]15[/C][C]-0.103473[/C][C]-0.8719[/C][C]0.193105[/C][/ROW]
[ROW][C]16[/C][C]0.119811[/C][C]1.0095[/C][C]0.158072[/C][/ROW]
[ROW][C]17[/C][C]-0.01976[/C][C]-0.1665[/C][C]0.434118[/C][/ROW]
[ROW][C]18[/C][C]0.033514[/C][C]0.2824[/C][C]0.389233[/C][/ROW]
[ROW][C]19[/C][C]-0.04131[/C][C]-0.3481[/C][C]0.364405[/C][/ROW]
[ROW][C]20[/C][C]0.052559[/C][C]0.4429[/C][C]0.329604[/C][/ROW]
[ROW][C]21[/C][C]-0.022556[/C][C]-0.1901[/C][C]0.424903[/C][/ROW]
[ROW][C]22[/C][C]-0.077676[/C][C]-0.6545[/C][C]0.25745[/C][/ROW]
[ROW][C]23[/C][C]0.016608[/C][C]0.1399[/C][C]0.44455[/C][/ROW]
[ROW][C]24[/C][C]0.070402[/C][C]0.5932[/C][C]0.27746[/C][/ROW]
[ROW][C]25[/C][C]-0.052186[/C][C]-0.4397[/C][C]0.330736[/C][/ROW]
[ROW][C]26[/C][C]0.008208[/C][C]0.0692[/C][C]0.472528[/C][/ROW]
[ROW][C]27[/C][C]0.070233[/C][C]0.5918[/C][C]0.277934[/C][/ROW]
[ROW][C]28[/C][C]-0.056502[/C][C]-0.4761[/C][C]0.317734[/C][/ROW]
[ROW][C]29[/C][C]-0.01914[/C][C]-0.1613[/C][C]0.436168[/C][/ROW]
[ROW][C]30[/C][C]-0.037423[/C][C]-0.3153[/C][C]0.376718[/C][/ROW]
[ROW][C]31[/C][C]-0.048684[/C][C]-0.4102[/C][C]0.341442[/C][/ROW]
[ROW][C]32[/C][C]0.033278[/C][C]0.2804[/C][C]0.389992[/C][/ROW]
[ROW][C]33[/C][C]0.099185[/C][C]0.8357[/C][C]0.20305[/C][/ROW]
[ROW][C]34[/C][C]-0.064775[/C][C]-0.5458[/C][C]0.293456[/C][/ROW]
[ROW][C]35[/C][C]-0.032607[/C][C]-0.2747[/C][C]0.392153[/C][/ROW]
[ROW][C]36[/C][C]0.002383[/C][C]0.0201[/C][C]0.492017[/C][/ROW]
[ROW][C]37[/C][C]0.091202[/C][C]0.7685[/C][C]0.222375[/C][/ROW]
[ROW][C]38[/C][C]-0.132169[/C][C]-1.1137[/C][C]0.134587[/C][/ROW]
[ROW][C]39[/C][C]0.032796[/C][C]0.2763[/C][C]0.391544[/C][/ROW]
[ROW][C]40[/C][C]-0.085718[/C][C]-0.7223[/C][C]0.236249[/C][/ROW]
[ROW][C]41[/C][C]0.105297[/C][C]0.8872[/C][C]0.188971[/C][/ROW]
[ROW][C]42[/C][C]-0.003922[/C][C]-0.0331[/C][C]0.486864[/C][/ROW]
[ROW][C]43[/C][C]0.059405[/C][C]0.5006[/C][C]0.309117[/C][/ROW]
[ROW][C]44[/C][C]-0.137823[/C][C]-1.1613[/C][C]0.124701[/C][/ROW]
[ROW][C]45[/C][C]0.129199[/C][C]1.0886[/C][C]0.139996[/C][/ROW]
[ROW][C]46[/C][C]-0.127264[/C][C]-1.0723[/C][C]0.143598[/C][/ROW]
[ROW][C]47[/C][C]0.119174[/C][C]1.0042[/C][C]0.159352[/C][/ROW]
[ROW][C]48[/C][C]-0.162732[/C][C]-1.3712[/C][C]0.087314[/C][/ROW]
[/TABLE]
Source: https://freestatistics.org/blog/index.php?pk=243484&T=1

Globally Unique Identifier (entire table): ba.freestatistics.org/blog/index.php?pk=243484&T=1

As an alternative you can also use a QR Code:  

The GUIDs for individual cells are displayed in the table below:

Autocorrelation Function
Time lag kACF(k)T-STATP-value
1-0.362355-3.05330.001592
20.1820271.53380.064763
3-0.34164-2.87870.002636
40.4630263.90150.000107
5-0.295866-2.4930.0075
60.2524882.12750.018426
7-0.371449-3.12990.001269
80.2951742.48720.007614
9-0.173857-1.46490.073675
100.1809521.52470.065884
11-0.304882-2.5690.006151
120.1927411.62410.054397
13-0.102144-0.86070.196156
140.0401810.33860.367966
15-0.103473-0.87190.193105
160.1198111.00950.158072
17-0.01976-0.16650.434118
180.0335140.28240.389233
19-0.04131-0.34810.364405
200.0525590.44290.329604
21-0.022556-0.19010.424903
22-0.077676-0.65450.25745
230.0166080.13990.44455
240.0704020.59320.27746
25-0.052186-0.43970.330736
260.0082080.06920.472528
270.0702330.59180.277934
28-0.056502-0.47610.317734
29-0.01914-0.16130.436168
30-0.037423-0.31530.376718
31-0.048684-0.41020.341442
320.0332780.28040.389992
330.0991850.83570.20305
34-0.064775-0.54580.293456
35-0.032607-0.27470.392153
360.0023830.02010.492017
370.0912020.76850.222375
38-0.132169-1.11370.134587
390.0327960.27630.391544
40-0.085718-0.72230.236249
410.1052970.88720.188971
42-0.003922-0.03310.486864
430.0594050.50060.309117
44-0.137823-1.16130.124701
450.1291991.08860.139996
46-0.127264-1.07230.143598
470.1191741.00420.159352
48-0.162732-1.37120.087314


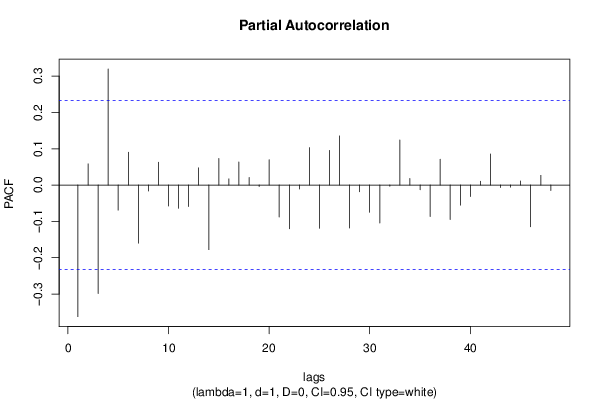
Partial Autocorrelation Function
Time lag kPACF(k)T-STATP-value
1-0.362355-3.05330.001592
20.0583930.4920.312109
3-0.298444-2.51470.00709
40.3197682.69440.004397
5-0.069048-0.58180.281268
60.090450.76210.22425
7-0.159872-1.34710.091115
8-0.016584-0.13970.444632
90.0626630.5280.299571
10-0.057806-0.48710.313851
11-0.063889-0.53830.296014
12-0.059008-0.49720.310289
130.0474270.39960.345316
14-0.177752-1.49780.069313
150.0731960.61680.269684
160.0171090.14420.442891
170.0634730.53480.297217
180.0207360.17470.430895
19-0.004108-0.03460.486241
200.0698340.58840.279054
21-0.087805-0.73990.230913
22-0.120161-1.01250.157369
23-0.010876-0.09160.46362
240.1030710.86850.194025
25-0.118973-1.00250.159757
260.0954720.80450.211908
270.1353941.14080.128883
28-0.118317-0.9970.161085
29-0.018308-0.15430.43892
30-0.074988-0.63190.264754
31-0.104546-0.88090.190667
32-0.003392-0.02860.488641
330.1241381.0460.149553
340.0180960.15250.43962
35-0.013156-0.11090.456022
36-0.086431-0.72830.234417
370.0713230.6010.274884
38-0.095007-0.80050.213032
39-0.055271-0.46570.321421
40-0.031556-0.26590.395545
410.0106470.08970.464384
420.0857640.72270.236131
43-0.006612-0.05570.477863
44-0.005789-0.04880.480616
450.0114060.09610.461852
46-0.115007-0.96910.167901
470.0267460.22540.411172
48-0.014809-0.12480.450524

\begin{tabular}{lllllllll}
\hline
Partial Autocorrelation Function \tabularnewline
Time lag k & PACF(k) & T-STAT & P-value \tabularnewline
1 & -0.362355 & -3.0533 & 0.001592 \tabularnewline
2 & 0.058393 & 0.492 & 0.312109 \tabularnewline
3 & -0.298444 & -2.5147 & 0.00709 \tabularnewline
4 & 0.319768 & 2.6944 & 0.004397 \tabularnewline
5 & -0.069048 & -0.5818 & 0.281268 \tabularnewline
6 & 0.09045 & 0.7621 & 0.22425 \tabularnewline
7 & -0.159872 & -1.3471 & 0.091115 \tabularnewline
8 & -0.016584 & -0.1397 & 0.444632 \tabularnewline
9 & 0.062663 & 0.528 & 0.299571 \tabularnewline
10 & -0.057806 & -0.4871 & 0.313851 \tabularnewline
11 & -0.063889 & -0.5383 & 0.296014 \tabularnewline
12 & -0.059008 & -0.4972 & 0.310289 \tabularnewline
13 & 0.047427 & 0.3996 & 0.345316 \tabularnewline
14 & -0.177752 & -1.4978 & 0.069313 \tabularnewline
15 & 0.073196 & 0.6168 & 0.269684 \tabularnewline
16 & 0.017109 & 0.1442 & 0.442891 \tabularnewline
17 & 0.063473 & 0.5348 & 0.297217 \tabularnewline
18 & 0.020736 & 0.1747 & 0.430895 \tabularnewline
19 & -0.004108 & -0.0346 & 0.486241 \tabularnewline
20 & 0.069834 & 0.5884 & 0.279054 \tabularnewline
21 & -0.087805 & -0.7399 & 0.230913 \tabularnewline
22 & -0.120161 & -1.0125 & 0.157369 \tabularnewline
23 & -0.010876 & -0.0916 & 0.46362 \tabularnewline
24 & 0.103071 & 0.8685 & 0.194025 \tabularnewline
25 & -0.118973 & -1.0025 & 0.159757 \tabularnewline
26 & 0.095472 & 0.8045 & 0.211908 \tabularnewline
27 & 0.135394 & 1.1408 & 0.128883 \tabularnewline
28 & -0.118317 & -0.997 & 0.161085 \tabularnewline
29 & -0.018308 & -0.1543 & 0.43892 \tabularnewline
30 & -0.074988 & -0.6319 & 0.264754 \tabularnewline
31 & -0.104546 & -0.8809 & 0.190667 \tabularnewline
32 & -0.003392 & -0.0286 & 0.488641 \tabularnewline
33 & 0.124138 & 1.046 & 0.149553 \tabularnewline
34 & 0.018096 & 0.1525 & 0.43962 \tabularnewline
35 & -0.013156 & -0.1109 & 0.456022 \tabularnewline
36 & -0.086431 & -0.7283 & 0.234417 \tabularnewline
37 & 0.071323 & 0.601 & 0.274884 \tabularnewline
38 & -0.095007 & -0.8005 & 0.213032 \tabularnewline
39 & -0.055271 & -0.4657 & 0.321421 \tabularnewline
40 & -0.031556 & -0.2659 & 0.395545 \tabularnewline
41 & 0.010647 & 0.0897 & 0.464384 \tabularnewline
42 & 0.085764 & 0.7227 & 0.236131 \tabularnewline
43 & -0.006612 & -0.0557 & 0.477863 \tabularnewline
44 & -0.005789 & -0.0488 & 0.480616 \tabularnewline
45 & 0.011406 & 0.0961 & 0.461852 \tabularnewline
46 & -0.115007 & -0.9691 & 0.167901 \tabularnewline
47 & 0.026746 & 0.2254 & 0.411172 \tabularnewline
48 & -0.014809 & -0.1248 & 0.450524 \tabularnewline
\hline
\end{tabular}
%Source: https://freestatistics.org/blog/index.php?pk=243484&T=2

[TABLE]
[ROW][C]Partial Autocorrelation Function[/C][/ROW]
[ROW][C]Time lag k[/C][C]PACF(k)[/C][C]T-STAT[/C][C]P-value[/C][/ROW]
[ROW][C]1[/C][C]-0.362355[/C][C]-3.0533[/C][C]0.001592[/C][/ROW]
[ROW][C]2[/C][C]0.058393[/C][C]0.492[/C][C]0.312109[/C][/ROW]
[ROW][C]3[/C][C]-0.298444[/C][C]-2.5147[/C][C]0.00709[/C][/ROW]
[ROW][C]4[/C][C]0.319768[/C][C]2.6944[/C][C]0.004397[/C][/ROW]
[ROW][C]5[/C][C]-0.069048[/C][C]-0.5818[/C][C]0.281268[/C][/ROW]
[ROW][C]6[/C][C]0.09045[/C][C]0.7621[/C][C]0.22425[/C][/ROW]
[ROW][C]7[/C][C]-0.159872[/C][C]-1.3471[/C][C]0.091115[/C][/ROW]
[ROW][C]8[/C][C]-0.016584[/C][C]-0.1397[/C][C]0.444632[/C][/ROW]
[ROW][C]9[/C][C]0.062663[/C][C]0.528[/C][C]0.299571[/C][/ROW]
[ROW][C]10[/C][C]-0.057806[/C][C]-0.4871[/C][C]0.313851[/C][/ROW]
[ROW][C]11[/C][C]-0.063889[/C][C]-0.5383[/C][C]0.296014[/C][/ROW]
[ROW][C]12[/C][C]-0.059008[/C][C]-0.4972[/C][C]0.310289[/C][/ROW]
[ROW][C]13[/C][C]0.047427[/C][C]0.3996[/C][C]0.345316[/C][/ROW]
[ROW][C]14[/C][C]-0.177752[/C][C]-1.4978[/C][C]0.069313[/C][/ROW]
[ROW][C]15[/C][C]0.073196[/C][C]0.6168[/C][C]0.269684[/C][/ROW]
[ROW][C]16[/C][C]0.017109[/C][C]0.1442[/C][C]0.442891[/C][/ROW]
[ROW][C]17[/C][C]0.063473[/C][C]0.5348[/C][C]0.297217[/C][/ROW]
[ROW][C]18[/C][C]0.020736[/C][C]0.1747[/C][C]0.430895[/C][/ROW]
[ROW][C]19[/C][C]-0.004108[/C][C]-0.0346[/C][C]0.486241[/C][/ROW]
[ROW][C]20[/C][C]0.069834[/C][C]0.5884[/C][C]0.279054[/C][/ROW]
[ROW][C]21[/C][C]-0.087805[/C][C]-0.7399[/C][C]0.230913[/C][/ROW]
[ROW][C]22[/C][C]-0.120161[/C][C]-1.0125[/C][C]0.157369[/C][/ROW]
[ROW][C]23[/C][C]-0.010876[/C][C]-0.0916[/C][C]0.46362[/C][/ROW]
[ROW][C]24[/C][C]0.103071[/C][C]0.8685[/C][C]0.194025[/C][/ROW]
[ROW][C]25[/C][C]-0.118973[/C][C]-1.0025[/C][C]0.159757[/C][/ROW]
[ROW][C]26[/C][C]0.095472[/C][C]0.8045[/C][C]0.211908[/C][/ROW]
[ROW][C]27[/C][C]0.135394[/C][C]1.1408[/C][C]0.128883[/C][/ROW]
[ROW][C]28[/C][C]-0.118317[/C][C]-0.997[/C][C]0.161085[/C][/ROW]
[ROW][C]29[/C][C]-0.018308[/C][C]-0.1543[/C][C]0.43892[/C][/ROW]
[ROW][C]30[/C][C]-0.074988[/C][C]-0.6319[/C][C]0.264754[/C][/ROW]
[ROW][C]31[/C][C]-0.104546[/C][C]-0.8809[/C][C]0.190667[/C][/ROW]
[ROW][C]32[/C][C]-0.003392[/C][C]-0.0286[/C][C]0.488641[/C][/ROW]
[ROW][C]33[/C][C]0.124138[/C][C]1.046[/C][C]0.149553[/C][/ROW]
[ROW][C]34[/C][C]0.018096[/C][C]0.1525[/C][C]0.43962[/C][/ROW]
[ROW][C]35[/C][C]-0.013156[/C][C]-0.1109[/C][C]0.456022[/C][/ROW]
[ROW][C]36[/C][C]-0.086431[/C][C]-0.7283[/C][C]0.234417[/C][/ROW]
[ROW][C]37[/C][C]0.071323[/C][C]0.601[/C][C]0.274884[/C][/ROW]
[ROW][C]38[/C][C]-0.095007[/C][C]-0.8005[/C][C]0.213032[/C][/ROW]
[ROW][C]39[/C][C]-0.055271[/C][C]-0.4657[/C][C]0.321421[/C][/ROW]
[ROW][C]40[/C][C]-0.031556[/C][C]-0.2659[/C][C]0.395545[/C][/ROW]
[ROW][C]41[/C][C]0.010647[/C][C]0.0897[/C][C]0.464384[/C][/ROW]
[ROW][C]42[/C][C]0.085764[/C][C]0.7227[/C][C]0.236131[/C][/ROW]
[ROW][C]43[/C][C]-0.006612[/C][C]-0.0557[/C][C]0.477863[/C][/ROW]
[ROW][C]44[/C][C]-0.005789[/C][C]-0.0488[/C][C]0.480616[/C][/ROW]
[ROW][C]45[/C][C]0.011406[/C][C]0.0961[/C][C]0.461852[/C][/ROW]
[ROW][C]46[/C][C]-0.115007[/C][C]-0.9691[/C][C]0.167901[/C][/ROW]
[ROW][C]47[/C][C]0.026746[/C][C]0.2254[/C][C]0.411172[/C][/ROW]
[ROW][C]48[/C][C]-0.014809[/C][C]-0.1248[/C][C]0.450524[/C][/ROW]
[/TABLE]
Source: https://freestatistics.org/blog/index.php?pk=243484&T=2

Globally Unique Identifier (entire table): ba.freestatistics.org/blog/index.php?pk=243484&T=2

As an alternative you can also use a QR Code:  

The GUIDs for individual cells are displayed in the table below:

Partial Autocorrelation Function
Time lag kPACF(k)T-STATP-value
1-0.362355-3.05330.001592
20.0583930.4920.312109
3-0.298444-2.51470.00709
40.3197682.69440.004397
5-0.069048-0.58180.281268
60.090450.76210.22425
7-0.159872-1.34710.091115
8-0.016584-0.13970.444632
90.0626630.5280.299571
10-0.057806-0.48710.313851
11-0.063889-0.53830.296014
12-0.059008-0.49720.310289
130.0474270.39960.345316
14-0.177752-1.49780.069313
150.0731960.61680.269684
160.0171090.14420.442891
170.0634730.53480.297217
180.0207360.17470.430895
19-0.004108-0.03460.486241
200.0698340.58840.279054
21-0.087805-0.73990.230913
22-0.120161-1.01250.157369
23-0.010876-0.09160.46362
240.1030710.86850.194025
25-0.118973-1.00250.159757
260.0954720.80450.211908
270.1353941.14080.128883
28-0.118317-0.9970.161085
29-0.018308-0.15430.43892
30-0.074988-0.63190.264754
31-0.104546-0.88090.190667
32-0.003392-0.02860.488641
330.1241381.0460.149553
340.0180960.15250.43962
35-0.013156-0.11090.456022
36-0.086431-0.72830.234417
370.0713230.6010.274884
38-0.095007-0.80050.213032
39-0.055271-0.46570.321421
40-0.031556-0.26590.395545
410.0106470.08970.464384
420.0857640.72270.236131
43-0.006612-0.05570.477863
44-0.005789-0.04880.480616
450.0114060.09610.461852
46-0.115007-0.96910.167901
470.0267460.22540.411172
48-0.014809-0.12480.450524


Parameters (Session):
par1 = 48 ; par2 = 1 ; par3 = 1 ; par4 = 0 ; par5 = 12 ; par6 = White Noise ; par7 = 0.95 ;
Parameters (R input):
par1 = 48 ; par2 = 1 ; par3 = 1 ; par4 = 0 ; par5 = 12 ; par6 = White Noise ; par7 = 0.95 ; par8 = ;
R code (references can be found in the software module):
par8 <- ''
par7 <- '0.95'
par6 <- 'White Noise'
par5 <- '12'
par4 <- '0'
par3 <- '0'
par2 <- '1'
par1 <- '48'
if (par1 == 'Default') {
par1 = 10*log10(length(x))
} else {
par1 <- as.numeric(par1)
}
par2 <- as.numeric(par2)
par3 <- as.numeric(par3)
par4 <- as.numeric(par4)
par5 <- as.numeric(par5)
if (par6 == 'White Noise') par6 <- 'white' else par6 <- 'ma'
par7 <- as.numeric(par7)
if (par8 != '') par8 <- as.numeric(par8)
ox <- x
if (par8 == '') {
if (par2 == 0) {
x <- log(x)
} else {
x <- (x ^ par2 - 1) / par2
}
} else {
x <- log(x,base=par8)
}
if (par3 > 0) x <- diff(x,lag=1,difference=par3)
if (par4 > 0) x <- diff(x,lag=par5,difference=par4)
bitmap(file='picts.png')
op <- par(mfrow=c(2,1))
plot(ox,type='l',main='Original Time Series',xlab='time',ylab='value')
if (par8=='') {
mytitle <- paste('Working Time Series (lambda=',par2,', d=',par3,', D=',par4,')',sep='')
mysub <- paste('(lambda=',par2,', d=',par3,', D=',par4,', CI=', par7, ', CI type=',par6,')',sep='')
} else {
mytitle <- paste('Working Time Series (base=',par8,', d=',par3,', D=',par4,')',sep='')
mysub <- paste('(base=',par8,', d=',par3,', D=',par4,', CI=', par7, ', CI type=',par6,')',sep='')
}
plot(x,type='l', main=mytitle,xlab='time',ylab='value')
par(op)
dev.off()
bitmap(file='pic1.png')
racf <- acf(x, par1, main='Autocorrelation', xlab='time lag', ylab='ACF', ci.type=par6, ci=par7, sub=mysub)
dev.off()
bitmap(file='pic2.png')
rpacf <- pacf(x,par1,main='Partial Autocorrelation',xlab='lags',ylab='PACF',sub=mysub)
dev.off()
(myacf <- c(racf$acf))
(mypacf <- c(rpacf$acf))
lengthx <- length(x)
sqrtn <- sqrt(lengthx)
load(file='createtable')
a<-table.start()
a<-table.row.start(a)
a<-table.element(a,'Autocorrelation Function',4,TRUE)
a<-table.row.end(a)
a<-table.row.start(a)
a<-table.element(a,'Time lag k',header=TRUE)
a<-table.element(a,hyperlink('basics.htm','ACF(k)','click here for more information about the Autocorrelation Function'),header=TRUE)
a<-table.element(a,'T-STAT',header=TRUE)
a<-table.element(a,'P-value',header=TRUE)
a<-table.row.end(a)
for (i in 2:(par1+1)) {
a<-table.row.start(a)
a<-table.element(a,i-1,header=TRUE)
a<-table.element(a,round(myacf[i],6))
mytstat <- myacf[i]*sqrtn
a<-table.element(a,round(mytstat,4))
a<-table.element(a,round(1-pt(abs(mytstat),lengthx),6))
a<-table.row.end(a)
}
a<-table.end(a)
table.save(a,file='mytable.tab')
a<-table.start()
a<-table.row.start(a)
a<-table.element(a,'Partial Autocorrelation Function',4,TRUE)
a<-table.row.end(a)
a<-table.row.start(a)
a<-table.element(a,'Time lag k',header=TRUE)
a<-table.element(a,hyperlink('basics.htm','PACF(k)','click here for more information about the Partial Autocorrelation Function'),header=TRUE)
a<-table.element(a,'T-STAT',header=TRUE)
a<-table.element(a,'P-value',header=TRUE)
a<-table.row.end(a)
for (i in 1:par1) {
a<-table.row.start(a)
a<-table.element(a,i,header=TRUE)
a<-table.element(a,round(mypacf[i],6))
mytstat <- mypacf[i]*sqrtn
a<-table.element(a,round(mytstat,4))
a<-table.element(a,round(1-pt(abs(mytstat),lengthx),6))
a<-table.row.end(a)
}
a<-table.end(a)
table.save(a,file='mytable1.tab')