Free Statistics

of Irreproducible Research!

Author's title

Author*Unverified author*
R Software Modulerwasp_autocorrelation.wasp
Title produced by software(Partial) Autocorrelation Function
Date of computationSat, 18 Oct 2014 14:08:59 +0100
Cite this page as followsStatistical Computations at FreeStatistics.org, Office for Research Development and Education, URL https://freestatistics.org/blog/index.php?v=date/2014/Oct/18/t141363779673ambgikgb3mn9d.htm/, Retrieved Mon, 13 May 2024 17:07:01 +0000
Statistical Computations at FreeStatistics.org, Office for Research Development and Education, URL https://freestatistics.org/blog/index.php?pk=243481, Retrieved Mon, 13 May 2024 17:07:01 +0000
QR Codes:

Original text written by user:
IsPrivate?No (this computation is public)
User-defined keywords
Estimated Impact65
Family? (F = Feedback message, R = changed R code, M = changed R Module, P = changed Parameters, D = changed Data)
-       [(Partial) Autocorrelation Function] [] [2014-10-18 13:08:59] [ba3f7115fe3efa85f8b130de707d46eb] [Current]
Feedback Forum

Post a new message
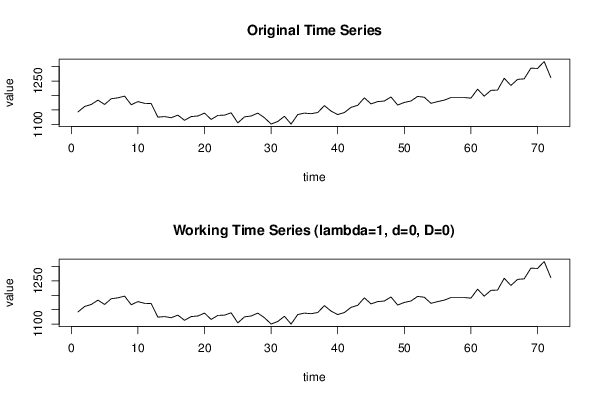
Dataseries X:
1143
1162
1169
1184
1169
1189
1192
1198
1168
1179
1173
1172
1125
1127
1123
1132
1114
1127
1129
1139
1117
1131
1132
1140
1105
1126
1129
1139
1123
1101
1110
1128
1101
1134
1139
1137
1141
1165
1146
1134
1141
1159
1166
1192
1171
1179
1181
1195
1167
1176
1181
1197
1194
1173
1179
1184
1193
1193
1193
1191
1222
1198
1218
1219
1260
1235
1256
1258
1295
1294
1318
1262


Summary of computational transaction
Raw Inputview raw input (R code)
Raw Outputview raw output of R engine
Computing time1 seconds
R Server'George Udny Yule' @ yule.wessa.net

\begin{tabular}{lllllllll}
\hline
Summary of computational transaction \tabularnewline
Raw Input & view raw input (R code)  \tabularnewline
Raw Output & view raw output of R engine  \tabularnewline
Computing time & 1 seconds \tabularnewline
R Server & 'George Udny Yule' @ yule.wessa.net \tabularnewline
\hline
\end{tabular}
%Source: https://freestatistics.org/blog/index.php?pk=243481&T=0

[TABLE]
[ROW][C]Summary of computational transaction[/C][/ROW]
[ROW][C]Raw Input[/C][C]view raw input (R code) [/C][/ROW]
[ROW][C]Raw Output[/C][C]view raw output of R engine [/C][/ROW]
[ROW][C]Computing time[/C][C]1 seconds[/C][/ROW]
[ROW][C]R Server[/C][C]'George Udny Yule' @ yule.wessa.net[/C][/ROW]
[/TABLE]
Source: https://freestatistics.org/blog/index.php?pk=243481&T=0

Globally Unique Identifier (entire table): ba.freestatistics.org/blog/index.php?pk=243481&T=0

As an alternative you can also use a QR Code:  

The GUIDs for individual cells are displayed in the table below:

Summary of computational transaction
Raw Inputview raw input (R code)
Raw Outputview raw output of R engine
Computing time1 seconds
R Server'George Udny Yule' @ yule.wessa.net


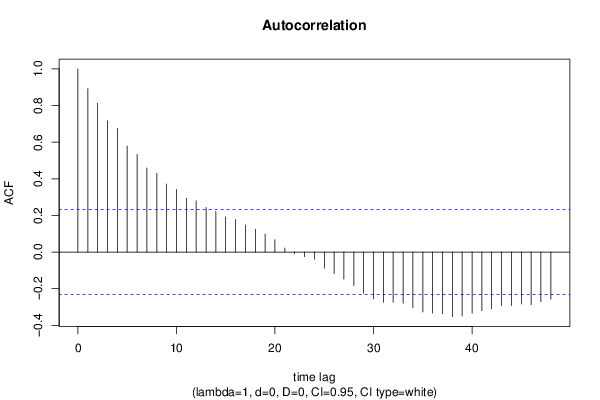
Autocorrelation Function
Time lag kACF(k)T-STATP-value
10.8927197.5750
20.8120826.89070
30.7164626.07940
40.6752495.72970
50.5788594.91183e-06
60.5327214.52031.2e-05
70.4589373.89420.000109
80.429433.64380.000252
90.3709923.1480.001196
100.3417482.89980.002474
110.2940212.49480.007448
120.2795232.37180.010188
130.2432162.06380.021323
140.2212111.8770.032282
150.1912171.62250.05453
160.1781291.51150.067522
170.1471761.24880.107886
180.1236231.0490.148849
190.0978060.82990.204667
200.0673780.57170.284646
210.0219150.1860.4265
22-0.009326-0.07910.468572
23-0.026225-0.22250.412268
24-0.039878-0.33840.368034
25-0.08806-0.74720.228683
26-0.117398-0.99620.161255
27-0.147337-1.25020.107639
28-0.182769-1.55080.062661
29-0.225346-1.91210.029919
30-0.255231-2.16570.016823
31-0.274717-2.33110.011277
32-0.273829-2.32350.011489
33-0.279872-2.37480.010113
34-0.303138-2.57220.006084
35-0.327046-2.77510.003513
36-0.333208-2.82740.003036
37-0.337351-2.86250.00275
38-0.353046-2.99570.001877
39-0.349099-2.96220.002068
40-0.333989-2.8340.00298
41-0.32013-2.71640.004129
42-0.30955-2.62660.005265
43-0.292052-2.47810.007776
44-0.291799-2.4760.007819
45-0.28321-2.40310.009417
46-0.288028-2.4440.008488
47-0.271075-2.30010.01217
48-0.258253-2.19140.015831

\begin{tabular}{lllllllll}
\hline
Autocorrelation Function \tabularnewline
Time lag k & ACF(k) & T-STAT & P-value \tabularnewline
1 & 0.892719 & 7.575 & 0 \tabularnewline
2 & 0.812082 & 6.8907 & 0 \tabularnewline
3 & 0.716462 & 6.0794 & 0 \tabularnewline
4 & 0.675249 & 5.7297 & 0 \tabularnewline
5 & 0.578859 & 4.9118 & 3e-06 \tabularnewline
6 & 0.532721 & 4.5203 & 1.2e-05 \tabularnewline
7 & 0.458937 & 3.8942 & 0.000109 \tabularnewline
8 & 0.42943 & 3.6438 & 0.000252 \tabularnewline
9 & 0.370992 & 3.148 & 0.001196 \tabularnewline
10 & 0.341748 & 2.8998 & 0.002474 \tabularnewline
11 & 0.294021 & 2.4948 & 0.007448 \tabularnewline
12 & 0.279523 & 2.3718 & 0.010188 \tabularnewline
13 & 0.243216 & 2.0638 & 0.021323 \tabularnewline
14 & 0.221211 & 1.877 & 0.032282 \tabularnewline
15 & 0.191217 & 1.6225 & 0.05453 \tabularnewline
16 & 0.178129 & 1.5115 & 0.067522 \tabularnewline
17 & 0.147176 & 1.2488 & 0.107886 \tabularnewline
18 & 0.123623 & 1.049 & 0.148849 \tabularnewline
19 & 0.097806 & 0.8299 & 0.204667 \tabularnewline
20 & 0.067378 & 0.5717 & 0.284646 \tabularnewline
21 & 0.021915 & 0.186 & 0.4265 \tabularnewline
22 & -0.009326 & -0.0791 & 0.468572 \tabularnewline
23 & -0.026225 & -0.2225 & 0.412268 \tabularnewline
24 & -0.039878 & -0.3384 & 0.368034 \tabularnewline
25 & -0.08806 & -0.7472 & 0.228683 \tabularnewline
26 & -0.117398 & -0.9962 & 0.161255 \tabularnewline
27 & -0.147337 & -1.2502 & 0.107639 \tabularnewline
28 & -0.182769 & -1.5508 & 0.062661 \tabularnewline
29 & -0.225346 & -1.9121 & 0.029919 \tabularnewline
30 & -0.255231 & -2.1657 & 0.016823 \tabularnewline
31 & -0.274717 & -2.3311 & 0.011277 \tabularnewline
32 & -0.273829 & -2.3235 & 0.011489 \tabularnewline
33 & -0.279872 & -2.3748 & 0.010113 \tabularnewline
34 & -0.303138 & -2.5722 & 0.006084 \tabularnewline
35 & -0.327046 & -2.7751 & 0.003513 \tabularnewline
36 & -0.333208 & -2.8274 & 0.003036 \tabularnewline
37 & -0.337351 & -2.8625 & 0.00275 \tabularnewline
38 & -0.353046 & -2.9957 & 0.001877 \tabularnewline
39 & -0.349099 & -2.9622 & 0.002068 \tabularnewline
40 & -0.333989 & -2.834 & 0.00298 \tabularnewline
41 & -0.32013 & -2.7164 & 0.004129 \tabularnewline
42 & -0.30955 & -2.6266 & 0.005265 \tabularnewline
43 & -0.292052 & -2.4781 & 0.007776 \tabularnewline
44 & -0.291799 & -2.476 & 0.007819 \tabularnewline
45 & -0.28321 & -2.4031 & 0.009417 \tabularnewline
46 & -0.288028 & -2.444 & 0.008488 \tabularnewline
47 & -0.271075 & -2.3001 & 0.01217 \tabularnewline
48 & -0.258253 & -2.1914 & 0.015831 \tabularnewline
\hline
\end{tabular}
%Source: https://freestatistics.org/blog/index.php?pk=243481&T=1

[TABLE]
[ROW][C]Autocorrelation Function[/C][/ROW]
[ROW][C]Time lag k[/C][C]ACF(k)[/C][C]T-STAT[/C][C]P-value[/C][/ROW]
[ROW][C]1[/C][C]0.892719[/C][C]7.575[/C][C]0[/C][/ROW]
[ROW][C]2[/C][C]0.812082[/C][C]6.8907[/C][C]0[/C][/ROW]
[ROW][C]3[/C][C]0.716462[/C][C]6.0794[/C][C]0[/C][/ROW]
[ROW][C]4[/C][C]0.675249[/C][C]5.7297[/C][C]0[/C][/ROW]
[ROW][C]5[/C][C]0.578859[/C][C]4.9118[/C][C]3e-06[/C][/ROW]
[ROW][C]6[/C][C]0.532721[/C][C]4.5203[/C][C]1.2e-05[/C][/ROW]
[ROW][C]7[/C][C]0.458937[/C][C]3.8942[/C][C]0.000109[/C][/ROW]
[ROW][C]8[/C][C]0.42943[/C][C]3.6438[/C][C]0.000252[/C][/ROW]
[ROW][C]9[/C][C]0.370992[/C][C]3.148[/C][C]0.001196[/C][/ROW]
[ROW][C]10[/C][C]0.341748[/C][C]2.8998[/C][C]0.002474[/C][/ROW]
[ROW][C]11[/C][C]0.294021[/C][C]2.4948[/C][C]0.007448[/C][/ROW]
[ROW][C]12[/C][C]0.279523[/C][C]2.3718[/C][C]0.010188[/C][/ROW]
[ROW][C]13[/C][C]0.243216[/C][C]2.0638[/C][C]0.021323[/C][/ROW]
[ROW][C]14[/C][C]0.221211[/C][C]1.877[/C][C]0.032282[/C][/ROW]
[ROW][C]15[/C][C]0.191217[/C][C]1.6225[/C][C]0.05453[/C][/ROW]
[ROW][C]16[/C][C]0.178129[/C][C]1.5115[/C][C]0.067522[/C][/ROW]
[ROW][C]17[/C][C]0.147176[/C][C]1.2488[/C][C]0.107886[/C][/ROW]
[ROW][C]18[/C][C]0.123623[/C][C]1.049[/C][C]0.148849[/C][/ROW]
[ROW][C]19[/C][C]0.097806[/C][C]0.8299[/C][C]0.204667[/C][/ROW]
[ROW][C]20[/C][C]0.067378[/C][C]0.5717[/C][C]0.284646[/C][/ROW]
[ROW][C]21[/C][C]0.021915[/C][C]0.186[/C][C]0.4265[/C][/ROW]
[ROW][C]22[/C][C]-0.009326[/C][C]-0.0791[/C][C]0.468572[/C][/ROW]
[ROW][C]23[/C][C]-0.026225[/C][C]-0.2225[/C][C]0.412268[/C][/ROW]
[ROW][C]24[/C][C]-0.039878[/C][C]-0.3384[/C][C]0.368034[/C][/ROW]
[ROW][C]25[/C][C]-0.08806[/C][C]-0.7472[/C][C]0.228683[/C][/ROW]
[ROW][C]26[/C][C]-0.117398[/C][C]-0.9962[/C][C]0.161255[/C][/ROW]
[ROW][C]27[/C][C]-0.147337[/C][C]-1.2502[/C][C]0.107639[/C][/ROW]
[ROW][C]28[/C][C]-0.182769[/C][C]-1.5508[/C][C]0.062661[/C][/ROW]
[ROW][C]29[/C][C]-0.225346[/C][C]-1.9121[/C][C]0.029919[/C][/ROW]
[ROW][C]30[/C][C]-0.255231[/C][C]-2.1657[/C][C]0.016823[/C][/ROW]
[ROW][C]31[/C][C]-0.274717[/C][C]-2.3311[/C][C]0.011277[/C][/ROW]
[ROW][C]32[/C][C]-0.273829[/C][C]-2.3235[/C][C]0.011489[/C][/ROW]
[ROW][C]33[/C][C]-0.279872[/C][C]-2.3748[/C][C]0.010113[/C][/ROW]
[ROW][C]34[/C][C]-0.303138[/C][C]-2.5722[/C][C]0.006084[/C][/ROW]
[ROW][C]35[/C][C]-0.327046[/C][C]-2.7751[/C][C]0.003513[/C][/ROW]
[ROW][C]36[/C][C]-0.333208[/C][C]-2.8274[/C][C]0.003036[/C][/ROW]
[ROW][C]37[/C][C]-0.337351[/C][C]-2.8625[/C][C]0.00275[/C][/ROW]
[ROW][C]38[/C][C]-0.353046[/C][C]-2.9957[/C][C]0.001877[/C][/ROW]
[ROW][C]39[/C][C]-0.349099[/C][C]-2.9622[/C][C]0.002068[/C][/ROW]
[ROW][C]40[/C][C]-0.333989[/C][C]-2.834[/C][C]0.00298[/C][/ROW]
[ROW][C]41[/C][C]-0.32013[/C][C]-2.7164[/C][C]0.004129[/C][/ROW]
[ROW][C]42[/C][C]-0.30955[/C][C]-2.6266[/C][C]0.005265[/C][/ROW]
[ROW][C]43[/C][C]-0.292052[/C][C]-2.4781[/C][C]0.007776[/C][/ROW]
[ROW][C]44[/C][C]-0.291799[/C][C]-2.476[/C][C]0.007819[/C][/ROW]
[ROW][C]45[/C][C]-0.28321[/C][C]-2.4031[/C][C]0.009417[/C][/ROW]
[ROW][C]46[/C][C]-0.288028[/C][C]-2.444[/C][C]0.008488[/C][/ROW]
[ROW][C]47[/C][C]-0.271075[/C][C]-2.3001[/C][C]0.01217[/C][/ROW]
[ROW][C]48[/C][C]-0.258253[/C][C]-2.1914[/C][C]0.015831[/C][/ROW]
[/TABLE]
Source: https://freestatistics.org/blog/index.php?pk=243481&T=1

Globally Unique Identifier (entire table): ba.freestatistics.org/blog/index.php?pk=243481&T=1

As an alternative you can also use a QR Code:  

The GUIDs for individual cells are displayed in the table below:

Autocorrelation Function
Time lag kACF(k)T-STATP-value
10.8927197.5750
20.8120826.89070
30.7164626.07940
40.6752495.72970
50.5788594.91183e-06
60.5327214.52031.2e-05
70.4589373.89420.000109
80.429433.64380.000252
90.3709923.1480.001196
100.3417482.89980.002474
110.2940212.49480.007448
120.2795232.37180.010188
130.2432162.06380.021323
140.2212111.8770.032282
150.1912171.62250.05453
160.1781291.51150.067522
170.1471761.24880.107886
180.1236231.0490.148849
190.0978060.82990.204667
200.0673780.57170.284646
210.0219150.1860.4265
22-0.009326-0.07910.468572
23-0.026225-0.22250.412268
24-0.039878-0.33840.368034
25-0.08806-0.74720.228683
26-0.117398-0.99620.161255
27-0.147337-1.25020.107639
28-0.182769-1.55080.062661
29-0.225346-1.91210.029919
30-0.255231-2.16570.016823
31-0.274717-2.33110.011277
32-0.273829-2.32350.011489
33-0.279872-2.37480.010113
34-0.303138-2.57220.006084
35-0.327046-2.77510.003513
36-0.333208-2.82740.003036
37-0.337351-2.86250.00275
38-0.353046-2.99570.001877
39-0.349099-2.96220.002068
40-0.333989-2.8340.00298
41-0.32013-2.71640.004129
42-0.30955-2.62660.005265
43-0.292052-2.47810.007776
44-0.291799-2.4760.007819
45-0.28321-2.40310.009417
46-0.288028-2.4440.008488
47-0.271075-2.30010.01217
48-0.258253-2.19140.015831


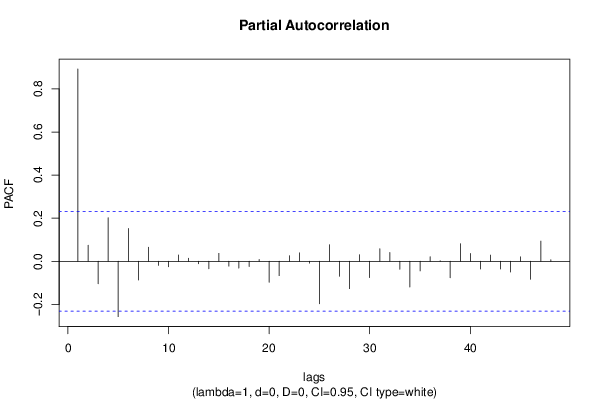
Partial Autocorrelation Function
Time lag kPACF(k)T-STATP-value
10.8927197.5750
20.074530.63240.264561
3-0.104009-0.88250.19021
40.2018041.71240.045567
5-0.256869-2.17960.016279
60.1519591.28940.100691
7-0.08669-0.73560.232186
80.0653160.55420.290571
9-0.01882-0.15970.436785
10-0.025022-0.21230.416231
110.0291810.24760.402572
120.014250.12090.452047
13-0.011181-0.09490.462339
14-0.03449-0.29270.385313
150.0367920.31220.377898
16-0.022378-0.18990.424966
17-0.031531-0.26750.394907
18-0.023826-0.20220.420176
190.0086510.07340.470842
20-0.096968-0.82280.206668
21-0.066383-0.56330.287497
220.0255380.21670.41453
230.0391740.33240.370276
24-0.008512-0.07220.47131
25-0.197272-1.67390.049244
260.0769540.6530.257927
27-0.069774-0.59210.277835
28-0.126809-1.0760.142757
290.0301180.25560.39951
30-0.075616-0.64160.261577
310.0579570.49180.312184
320.0405820.34440.365793
33-0.037221-0.31580.376522
34-0.11904-1.01010.157918
35-0.044482-0.37740.353478
360.0209250.17760.429786
370.0025790.02190.491299
38-0.07663-0.65020.258807
390.0815560.6920.245574
400.035960.30510.380574
41-0.035705-0.3030.381396
420.0287230.24370.40407
43-0.036108-0.30640.380096
44-0.049493-0.420.337882
450.0206850.17550.430582
46-0.083024-0.70450.241702
470.0937010.79510.214589
480.0068950.05850.476755

\begin{tabular}{lllllllll}
\hline
Partial Autocorrelation Function \tabularnewline
Time lag k & PACF(k) & T-STAT & P-value \tabularnewline
1 & 0.892719 & 7.575 & 0 \tabularnewline
2 & 0.07453 & 0.6324 & 0.264561 \tabularnewline
3 & -0.104009 & -0.8825 & 0.19021 \tabularnewline
4 & 0.201804 & 1.7124 & 0.045567 \tabularnewline
5 & -0.256869 & -2.1796 & 0.016279 \tabularnewline
6 & 0.151959 & 1.2894 & 0.100691 \tabularnewline
7 & -0.08669 & -0.7356 & 0.232186 \tabularnewline
8 & 0.065316 & 0.5542 & 0.290571 \tabularnewline
9 & -0.01882 & -0.1597 & 0.436785 \tabularnewline
10 & -0.025022 & -0.2123 & 0.416231 \tabularnewline
11 & 0.029181 & 0.2476 & 0.402572 \tabularnewline
12 & 0.01425 & 0.1209 & 0.452047 \tabularnewline
13 & -0.011181 & -0.0949 & 0.462339 \tabularnewline
14 & -0.03449 & -0.2927 & 0.385313 \tabularnewline
15 & 0.036792 & 0.3122 & 0.377898 \tabularnewline
16 & -0.022378 & -0.1899 & 0.424966 \tabularnewline
17 & -0.031531 & -0.2675 & 0.394907 \tabularnewline
18 & -0.023826 & -0.2022 & 0.420176 \tabularnewline
19 & 0.008651 & 0.0734 & 0.470842 \tabularnewline
20 & -0.096968 & -0.8228 & 0.206668 \tabularnewline
21 & -0.066383 & -0.5633 & 0.287497 \tabularnewline
22 & 0.025538 & 0.2167 & 0.41453 \tabularnewline
23 & 0.039174 & 0.3324 & 0.370276 \tabularnewline
24 & -0.008512 & -0.0722 & 0.47131 \tabularnewline
25 & -0.197272 & -1.6739 & 0.049244 \tabularnewline
26 & 0.076954 & 0.653 & 0.257927 \tabularnewline
27 & -0.069774 & -0.5921 & 0.277835 \tabularnewline
28 & -0.126809 & -1.076 & 0.142757 \tabularnewline
29 & 0.030118 & 0.2556 & 0.39951 \tabularnewline
30 & -0.075616 & -0.6416 & 0.261577 \tabularnewline
31 & 0.057957 & 0.4918 & 0.312184 \tabularnewline
32 & 0.040582 & 0.3444 & 0.365793 \tabularnewline
33 & -0.037221 & -0.3158 & 0.376522 \tabularnewline
34 & -0.11904 & -1.0101 & 0.157918 \tabularnewline
35 & -0.044482 & -0.3774 & 0.353478 \tabularnewline
36 & 0.020925 & 0.1776 & 0.429786 \tabularnewline
37 & 0.002579 & 0.0219 & 0.491299 \tabularnewline
38 & -0.07663 & -0.6502 & 0.258807 \tabularnewline
39 & 0.081556 & 0.692 & 0.245574 \tabularnewline
40 & 0.03596 & 0.3051 & 0.380574 \tabularnewline
41 & -0.035705 & -0.303 & 0.381396 \tabularnewline
42 & 0.028723 & 0.2437 & 0.40407 \tabularnewline
43 & -0.036108 & -0.3064 & 0.380096 \tabularnewline
44 & -0.049493 & -0.42 & 0.337882 \tabularnewline
45 & 0.020685 & 0.1755 & 0.430582 \tabularnewline
46 & -0.083024 & -0.7045 & 0.241702 \tabularnewline
47 & 0.093701 & 0.7951 & 0.214589 \tabularnewline
48 & 0.006895 & 0.0585 & 0.476755 \tabularnewline
\hline
\end{tabular}
%Source: https://freestatistics.org/blog/index.php?pk=243481&T=2

[TABLE]
[ROW][C]Partial Autocorrelation Function[/C][/ROW]
[ROW][C]Time lag k[/C][C]PACF(k)[/C][C]T-STAT[/C][C]P-value[/C][/ROW]
[ROW][C]1[/C][C]0.892719[/C][C]7.575[/C][C]0[/C][/ROW]
[ROW][C]2[/C][C]0.07453[/C][C]0.6324[/C][C]0.264561[/C][/ROW]
[ROW][C]3[/C][C]-0.104009[/C][C]-0.8825[/C][C]0.19021[/C][/ROW]
[ROW][C]4[/C][C]0.201804[/C][C]1.7124[/C][C]0.045567[/C][/ROW]
[ROW][C]5[/C][C]-0.256869[/C][C]-2.1796[/C][C]0.016279[/C][/ROW]
[ROW][C]6[/C][C]0.151959[/C][C]1.2894[/C][C]0.100691[/C][/ROW]
[ROW][C]7[/C][C]-0.08669[/C][C]-0.7356[/C][C]0.232186[/C][/ROW]
[ROW][C]8[/C][C]0.065316[/C][C]0.5542[/C][C]0.290571[/C][/ROW]
[ROW][C]9[/C][C]-0.01882[/C][C]-0.1597[/C][C]0.436785[/C][/ROW]
[ROW][C]10[/C][C]-0.025022[/C][C]-0.2123[/C][C]0.416231[/C][/ROW]
[ROW][C]11[/C][C]0.029181[/C][C]0.2476[/C][C]0.402572[/C][/ROW]
[ROW][C]12[/C][C]0.01425[/C][C]0.1209[/C][C]0.452047[/C][/ROW]
[ROW][C]13[/C][C]-0.011181[/C][C]-0.0949[/C][C]0.462339[/C][/ROW]
[ROW][C]14[/C][C]-0.03449[/C][C]-0.2927[/C][C]0.385313[/C][/ROW]
[ROW][C]15[/C][C]0.036792[/C][C]0.3122[/C][C]0.377898[/C][/ROW]
[ROW][C]16[/C][C]-0.022378[/C][C]-0.1899[/C][C]0.424966[/C][/ROW]
[ROW][C]17[/C][C]-0.031531[/C][C]-0.2675[/C][C]0.394907[/C][/ROW]
[ROW][C]18[/C][C]-0.023826[/C][C]-0.2022[/C][C]0.420176[/C][/ROW]
[ROW][C]19[/C][C]0.008651[/C][C]0.0734[/C][C]0.470842[/C][/ROW]
[ROW][C]20[/C][C]-0.096968[/C][C]-0.8228[/C][C]0.206668[/C][/ROW]
[ROW][C]21[/C][C]-0.066383[/C][C]-0.5633[/C][C]0.287497[/C][/ROW]
[ROW][C]22[/C][C]0.025538[/C][C]0.2167[/C][C]0.41453[/C][/ROW]
[ROW][C]23[/C][C]0.039174[/C][C]0.3324[/C][C]0.370276[/C][/ROW]
[ROW][C]24[/C][C]-0.008512[/C][C]-0.0722[/C][C]0.47131[/C][/ROW]
[ROW][C]25[/C][C]-0.197272[/C][C]-1.6739[/C][C]0.049244[/C][/ROW]
[ROW][C]26[/C][C]0.076954[/C][C]0.653[/C][C]0.257927[/C][/ROW]
[ROW][C]27[/C][C]-0.069774[/C][C]-0.5921[/C][C]0.277835[/C][/ROW]
[ROW][C]28[/C][C]-0.126809[/C][C]-1.076[/C][C]0.142757[/C][/ROW]
[ROW][C]29[/C][C]0.030118[/C][C]0.2556[/C][C]0.39951[/C][/ROW]
[ROW][C]30[/C][C]-0.075616[/C][C]-0.6416[/C][C]0.261577[/C][/ROW]
[ROW][C]31[/C][C]0.057957[/C][C]0.4918[/C][C]0.312184[/C][/ROW]
[ROW][C]32[/C][C]0.040582[/C][C]0.3444[/C][C]0.365793[/C][/ROW]
[ROW][C]33[/C][C]-0.037221[/C][C]-0.3158[/C][C]0.376522[/C][/ROW]
[ROW][C]34[/C][C]-0.11904[/C][C]-1.0101[/C][C]0.157918[/C][/ROW]
[ROW][C]35[/C][C]-0.044482[/C][C]-0.3774[/C][C]0.353478[/C][/ROW]
[ROW][C]36[/C][C]0.020925[/C][C]0.1776[/C][C]0.429786[/C][/ROW]
[ROW][C]37[/C][C]0.002579[/C][C]0.0219[/C][C]0.491299[/C][/ROW]
[ROW][C]38[/C][C]-0.07663[/C][C]-0.6502[/C][C]0.258807[/C][/ROW]
[ROW][C]39[/C][C]0.081556[/C][C]0.692[/C][C]0.245574[/C][/ROW]
[ROW][C]40[/C][C]0.03596[/C][C]0.3051[/C][C]0.380574[/C][/ROW]
[ROW][C]41[/C][C]-0.035705[/C][C]-0.303[/C][C]0.381396[/C][/ROW]
[ROW][C]42[/C][C]0.028723[/C][C]0.2437[/C][C]0.40407[/C][/ROW]
[ROW][C]43[/C][C]-0.036108[/C][C]-0.3064[/C][C]0.380096[/C][/ROW]
[ROW][C]44[/C][C]-0.049493[/C][C]-0.42[/C][C]0.337882[/C][/ROW]
[ROW][C]45[/C][C]0.020685[/C][C]0.1755[/C][C]0.430582[/C][/ROW]
[ROW][C]46[/C][C]-0.083024[/C][C]-0.7045[/C][C]0.241702[/C][/ROW]
[ROW][C]47[/C][C]0.093701[/C][C]0.7951[/C][C]0.214589[/C][/ROW]
[ROW][C]48[/C][C]0.006895[/C][C]0.0585[/C][C]0.476755[/C][/ROW]
[/TABLE]
Source: https://freestatistics.org/blog/index.php?pk=243481&T=2

Globally Unique Identifier (entire table): ba.freestatistics.org/blog/index.php?pk=243481&T=2

As an alternative you can also use a QR Code:  

The GUIDs for individual cells are displayed in the table below:

Partial Autocorrelation Function
Time lag kPACF(k)T-STATP-value
10.8927197.5750
20.074530.63240.264561
3-0.104009-0.88250.19021
40.2018041.71240.045567
5-0.256869-2.17960.016279
60.1519591.28940.100691
7-0.08669-0.73560.232186
80.0653160.55420.290571
9-0.01882-0.15970.436785
10-0.025022-0.21230.416231
110.0291810.24760.402572
120.014250.12090.452047
13-0.011181-0.09490.462339
14-0.03449-0.29270.385313
150.0367920.31220.377898
16-0.022378-0.18990.424966
17-0.031531-0.26750.394907
18-0.023826-0.20220.420176
190.0086510.07340.470842
20-0.096968-0.82280.206668
21-0.066383-0.56330.287497
220.0255380.21670.41453
230.0391740.33240.370276
24-0.008512-0.07220.47131
25-0.197272-1.67390.049244
260.0769540.6530.257927
27-0.069774-0.59210.277835
28-0.126809-1.0760.142757
290.0301180.25560.39951
30-0.075616-0.64160.261577
310.0579570.49180.312184
320.0405820.34440.365793
33-0.037221-0.31580.376522
34-0.11904-1.01010.157918
35-0.044482-0.37740.353478
360.0209250.17760.429786
370.0025790.02190.491299
38-0.07663-0.65020.258807
390.0815560.6920.245574
400.035960.30510.380574
41-0.035705-0.3030.381396
420.0287230.24370.40407
43-0.036108-0.30640.380096
44-0.049493-0.420.337882
450.0206850.17550.430582
46-0.083024-0.70450.241702
470.0937010.79510.214589
480.0068950.05850.476755


Parameters (Session):
par1 = 48 ; par2 = 1 ; par3 = 0 ; par4 = 0 ; par5 = 12 ; par6 = White Noise ; par7 = 0.95 ;
Parameters (R input):
par1 = 48 ; par2 = 1 ; par3 = 0 ; par4 = 0 ; par5 = 12 ; par6 = White Noise ; par7 = 0.95 ; par8 = ;
R code (references can be found in the software module):
par8 <- ''
par7 <- '0.95'
par6 <- 'White Noise'
par5 <- '12'
par4 <- '0'
par3 <- '1'
par2 <- '1'
par1 <- 'Default'
if (par1 == 'Default') {
par1 = 10*log10(length(x))
} else {
par1 <- as.numeric(par1)
}
par2 <- as.numeric(par2)
par3 <- as.numeric(par3)
par4 <- as.numeric(par4)
par5 <- as.numeric(par5)
if (par6 == 'White Noise') par6 <- 'white' else par6 <- 'ma'
par7 <- as.numeric(par7)
if (par8 != '') par8 <- as.numeric(par8)
ox <- x
if (par8 == '') {
if (par2 == 0) {
x <- log(x)
} else {
x <- (x ^ par2 - 1) / par2
}
} else {
x <- log(x,base=par8)
}
if (par3 > 0) x <- diff(x,lag=1,difference=par3)
if (par4 > 0) x <- diff(x,lag=par5,difference=par4)
bitmap(file='picts.png')
op <- par(mfrow=c(2,1))
plot(ox,type='l',main='Original Time Series',xlab='time',ylab='value')
if (par8=='') {
mytitle <- paste('Working Time Series (lambda=',par2,', d=',par3,', D=',par4,')',sep='')
mysub <- paste('(lambda=',par2,', d=',par3,', D=',par4,', CI=', par7, ', CI type=',par6,')',sep='')
} else {
mytitle <- paste('Working Time Series (base=',par8,', d=',par3,', D=',par4,')',sep='')
mysub <- paste('(base=',par8,', d=',par3,', D=',par4,', CI=', par7, ', CI type=',par6,')',sep='')
}
plot(x,type='l', main=mytitle,xlab='time',ylab='value')
par(op)
dev.off()
bitmap(file='pic1.png')
racf <- acf(x, par1, main='Autocorrelation', xlab='time lag', ylab='ACF', ci.type=par6, ci=par7, sub=mysub)
dev.off()
bitmap(file='pic2.png')
rpacf <- pacf(x,par1,main='Partial Autocorrelation',xlab='lags',ylab='PACF',sub=mysub)
dev.off()
(myacf <- c(racf$acf))
(mypacf <- c(rpacf$acf))
lengthx <- length(x)
sqrtn <- sqrt(lengthx)
load(file='createtable')
a<-table.start()
a<-table.row.start(a)
a<-table.element(a,'Autocorrelation Function',4,TRUE)
a<-table.row.end(a)
a<-table.row.start(a)
a<-table.element(a,'Time lag k',header=TRUE)
a<-table.element(a,hyperlink('basics.htm','ACF(k)','click here for more information about the Autocorrelation Function'),header=TRUE)
a<-table.element(a,'T-STAT',header=TRUE)
a<-table.element(a,'P-value',header=TRUE)
a<-table.row.end(a)
for (i in 2:(par1+1)) {
a<-table.row.start(a)
a<-table.element(a,i-1,header=TRUE)
a<-table.element(a,round(myacf[i],6))
mytstat <- myacf[i]*sqrtn
a<-table.element(a,round(mytstat,4))
a<-table.element(a,round(1-pt(abs(mytstat),lengthx),6))
a<-table.row.end(a)
}
a<-table.end(a)
table.save(a,file='mytable.tab')
a<-table.start()
a<-table.row.start(a)
a<-table.element(a,'Partial Autocorrelation Function',4,TRUE)
a<-table.row.end(a)
a<-table.row.start(a)
a<-table.element(a,'Time lag k',header=TRUE)
a<-table.element(a,hyperlink('basics.htm','PACF(k)','click here for more information about the Partial Autocorrelation Function'),header=TRUE)
a<-table.element(a,'T-STAT',header=TRUE)
a<-table.element(a,'P-value',header=TRUE)
a<-table.row.end(a)
for (i in 1:par1) {
a<-table.row.start(a)
a<-table.element(a,i,header=TRUE)
a<-table.element(a,round(mypacf[i],6))
mytstat <- mypacf[i]*sqrtn
a<-table.element(a,round(mytstat,4))
a<-table.element(a,round(1-pt(abs(mytstat),lengthx),6))
a<-table.row.end(a)
}
a<-table.end(a)
table.save(a,file='mytable1.tab')