Free Statistics

of Irreproducible Research!

Author's title

Author*Unverified author*
R Software Modulerwasp_autocorrelation.wasp
Title produced by software(Partial) Autocorrelation Function
Date of computationSat, 18 Oct 2014 13:25:30 +0100
Cite this page as followsStatistical Computations at FreeStatistics.org, Office for Research Development and Education, URL https://freestatistics.org/blog/index.php?v=date/2014/Oct/18/t14136351950do0g6qn0v3i677.htm/, Retrieved Mon, 13 May 2024 05:58:13 +0000
Statistical Computations at FreeStatistics.org, Office for Research Development and Education, URL https://freestatistics.org/blog/index.php?pk=243464, Retrieved Mon, 13 May 2024 05:58:13 +0000
QR Codes:

Original text written by user:
IsPrivate?No (this computation is public)
User-defined keywords
Estimated Impact73
Family? (F = Feedback message, R = changed R code, M = changed R Module, P = changed Parameters, D = changed Data)
-       [(Partial) Autocorrelation Function] [] [2014-10-18 12:25:30] [2f27692a17e58baa8638275162e45e6c] [Current]
Feedback Forum

Post a new message
Dataseries X:
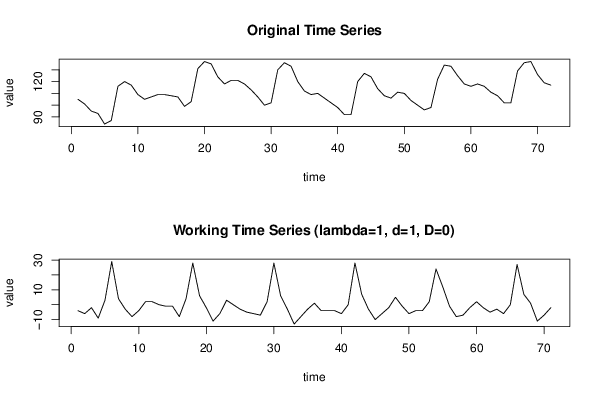
105
101
95
93
84
87
116
120
117
109
105
107
109
109
108
107
99
103
131
137
135
124
118
121
121
118
113
107
100
102
130
136
133
120
112
109
110
106
102
98
92
92
120
127
124
114
108
106
111
110
104
100
96
98
122
134
133
125
118
116
118
116
111
108
102
102
129
136
137
126
119
117


Summary of computational transaction
Raw Inputview raw input (R code)
Raw Outputview raw output of R engine
Computing time2 seconds
R Server'Herman Ole Andreas Wold' @ wold.wessa.net

\begin{tabular}{lllllllll}
\hline
Summary of computational transaction \tabularnewline
Raw Input & view raw input (R code)  \tabularnewline
Raw Output & view raw output of R engine  \tabularnewline
Computing time & 2 seconds \tabularnewline
R Server & 'Herman Ole Andreas Wold' @ wold.wessa.net \tabularnewline
\hline
\end{tabular}
%Source: https://freestatistics.org/blog/index.php?pk=243464&T=0

[TABLE]
[ROW][C]Summary of computational transaction[/C][/ROW]
[ROW][C]Raw Input[/C][C]view raw input (R code) [/C][/ROW]
[ROW][C]Raw Output[/C][C]view raw output of R engine [/C][/ROW]
[ROW][C]Computing time[/C][C]2 seconds[/C][/ROW]
[ROW][C]R Server[/C][C]'Herman Ole Andreas Wold' @ wold.wessa.net[/C][/ROW]
[/TABLE]
Source: https://freestatistics.org/blog/index.php?pk=243464&T=0

Globally Unique Identifier (entire table): ba.freestatistics.org/blog/index.php?pk=243464&T=0

As an alternative you can also use a QR Code:  

The GUIDs for individual cells are displayed in the table below:

Summary of computational transaction
Raw Inputview raw input (R code)
Raw Outputview raw output of R engine
Computing time2 seconds
R Server'Herman Ole Andreas Wold' @ wold.wessa.net


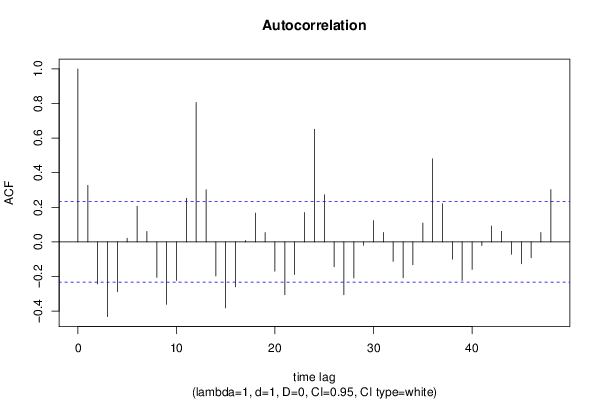
Autocorrelation Function
Time lag kACF(k)T-STATP-value
10.3266552.75240.003752
2-0.24278-2.04570.022246
3-0.43225-3.64220.000255
4-0.287889-2.42580.008909
50.0213750.18010.428789
60.2065021.740.043094
70.0599940.50550.307379
8-0.205332-1.73020.043974
9-0.361145-3.04310.001641
10-0.223531-1.88350.031864
110.2523972.12670.018459
120.8062676.79370
130.3019882.54460.006558
14-0.197293-1.66240.050419
15-0.381656-3.21590.000979
16-0.259828-2.18940.01593
170.0080190.06760.47316
180.1666251.4040.082338
190.0535150.45090.326709
20-0.168906-1.42320.079525
21-0.305444-2.57370.006075
22-0.189009-1.59260.057844
230.169591.4290.078696
240.6514335.48910
250.2725832.29680.012291
26-0.143625-1.21020.115106
27-0.305197-2.57160.006108
28-0.20856-1.75740.041584
29-0.01983-0.16710.433887
300.1230961.03720.151575
310.0547910.46170.322862
32-0.112692-0.94960.172779
33-0.206925-1.74360.04278
34-0.131754-1.11020.135334
350.1092270.92040.18025
360.4800184.04476.6e-05
370.2203711.85690.033738
38-0.099583-0.83910.202115
39-0.222419-1.87410.032513
40-0.159047-1.34020.092234
41-0.020881-0.17590.43042
420.0912540.76890.222245
430.0608530.51280.304857
44-0.071333-0.60110.274858
45-0.126465-1.06560.145105
46-0.091748-0.77310.221019
470.0542550.45720.324476
480.302432.54830.006494

\begin{tabular}{lllllllll}
\hline
Autocorrelation Function \tabularnewline
Time lag k & ACF(k) & T-STAT & P-value \tabularnewline
1 & 0.326655 & 2.7524 & 0.003752 \tabularnewline
2 & -0.24278 & -2.0457 & 0.022246 \tabularnewline
3 & -0.43225 & -3.6422 & 0.000255 \tabularnewline
4 & -0.287889 & -2.4258 & 0.008909 \tabularnewline
5 & 0.021375 & 0.1801 & 0.428789 \tabularnewline
6 & 0.206502 & 1.74 & 0.043094 \tabularnewline
7 & 0.059994 & 0.5055 & 0.307379 \tabularnewline
8 & -0.205332 & -1.7302 & 0.043974 \tabularnewline
9 & -0.361145 & -3.0431 & 0.001641 \tabularnewline
10 & -0.223531 & -1.8835 & 0.031864 \tabularnewline
11 & 0.252397 & 2.1267 & 0.018459 \tabularnewline
12 & 0.806267 & 6.7937 & 0 \tabularnewline
13 & 0.301988 & 2.5446 & 0.006558 \tabularnewline
14 & -0.197293 & -1.6624 & 0.050419 \tabularnewline
15 & -0.381656 & -3.2159 & 0.000979 \tabularnewline
16 & -0.259828 & -2.1894 & 0.01593 \tabularnewline
17 & 0.008019 & 0.0676 & 0.47316 \tabularnewline
18 & 0.166625 & 1.404 & 0.082338 \tabularnewline
19 & 0.053515 & 0.4509 & 0.326709 \tabularnewline
20 & -0.168906 & -1.4232 & 0.079525 \tabularnewline
21 & -0.305444 & -2.5737 & 0.006075 \tabularnewline
22 & -0.189009 & -1.5926 & 0.057844 \tabularnewline
23 & 0.16959 & 1.429 & 0.078696 \tabularnewline
24 & 0.651433 & 5.4891 & 0 \tabularnewline
25 & 0.272583 & 2.2968 & 0.012291 \tabularnewline
26 & -0.143625 & -1.2102 & 0.115106 \tabularnewline
27 & -0.305197 & -2.5716 & 0.006108 \tabularnewline
28 & -0.20856 & -1.7574 & 0.041584 \tabularnewline
29 & -0.01983 & -0.1671 & 0.433887 \tabularnewline
30 & 0.123096 & 1.0372 & 0.151575 \tabularnewline
31 & 0.054791 & 0.4617 & 0.322862 \tabularnewline
32 & -0.112692 & -0.9496 & 0.172779 \tabularnewline
33 & -0.206925 & -1.7436 & 0.04278 \tabularnewline
34 & -0.131754 & -1.1102 & 0.135334 \tabularnewline
35 & 0.109227 & 0.9204 & 0.18025 \tabularnewline
36 & 0.480018 & 4.0447 & 6.6e-05 \tabularnewline
37 & 0.220371 & 1.8569 & 0.033738 \tabularnewline
38 & -0.099583 & -0.8391 & 0.202115 \tabularnewline
39 & -0.222419 & -1.8741 & 0.032513 \tabularnewline
40 & -0.159047 & -1.3402 & 0.092234 \tabularnewline
41 & -0.020881 & -0.1759 & 0.43042 \tabularnewline
42 & 0.091254 & 0.7689 & 0.222245 \tabularnewline
43 & 0.060853 & 0.5128 & 0.304857 \tabularnewline
44 & -0.071333 & -0.6011 & 0.274858 \tabularnewline
45 & -0.126465 & -1.0656 & 0.145105 \tabularnewline
46 & -0.091748 & -0.7731 & 0.221019 \tabularnewline
47 & 0.054255 & 0.4572 & 0.324476 \tabularnewline
48 & 0.30243 & 2.5483 & 0.006494 \tabularnewline
\hline
\end{tabular}
%Source: https://freestatistics.org/blog/index.php?pk=243464&T=1

[TABLE]
[ROW][C]Autocorrelation Function[/C][/ROW]
[ROW][C]Time lag k[/C][C]ACF(k)[/C][C]T-STAT[/C][C]P-value[/C][/ROW]
[ROW][C]1[/C][C]0.326655[/C][C]2.7524[/C][C]0.003752[/C][/ROW]
[ROW][C]2[/C][C]-0.24278[/C][C]-2.0457[/C][C]0.022246[/C][/ROW]
[ROW][C]3[/C][C]-0.43225[/C][C]-3.6422[/C][C]0.000255[/C][/ROW]
[ROW][C]4[/C][C]-0.287889[/C][C]-2.4258[/C][C]0.008909[/C][/ROW]
[ROW][C]5[/C][C]0.021375[/C][C]0.1801[/C][C]0.428789[/C][/ROW]
[ROW][C]6[/C][C]0.206502[/C][C]1.74[/C][C]0.043094[/C][/ROW]
[ROW][C]7[/C][C]0.059994[/C][C]0.5055[/C][C]0.307379[/C][/ROW]
[ROW][C]8[/C][C]-0.205332[/C][C]-1.7302[/C][C]0.043974[/C][/ROW]
[ROW][C]9[/C][C]-0.361145[/C][C]-3.0431[/C][C]0.001641[/C][/ROW]
[ROW][C]10[/C][C]-0.223531[/C][C]-1.8835[/C][C]0.031864[/C][/ROW]
[ROW][C]11[/C][C]0.252397[/C][C]2.1267[/C][C]0.018459[/C][/ROW]
[ROW][C]12[/C][C]0.806267[/C][C]6.7937[/C][C]0[/C][/ROW]
[ROW][C]13[/C][C]0.301988[/C][C]2.5446[/C][C]0.006558[/C][/ROW]
[ROW][C]14[/C][C]-0.197293[/C][C]-1.6624[/C][C]0.050419[/C][/ROW]
[ROW][C]15[/C][C]-0.381656[/C][C]-3.2159[/C][C]0.000979[/C][/ROW]
[ROW][C]16[/C][C]-0.259828[/C][C]-2.1894[/C][C]0.01593[/C][/ROW]
[ROW][C]17[/C][C]0.008019[/C][C]0.0676[/C][C]0.47316[/C][/ROW]
[ROW][C]18[/C][C]0.166625[/C][C]1.404[/C][C]0.082338[/C][/ROW]
[ROW][C]19[/C][C]0.053515[/C][C]0.4509[/C][C]0.326709[/C][/ROW]
[ROW][C]20[/C][C]-0.168906[/C][C]-1.4232[/C][C]0.079525[/C][/ROW]
[ROW][C]21[/C][C]-0.305444[/C][C]-2.5737[/C][C]0.006075[/C][/ROW]
[ROW][C]22[/C][C]-0.189009[/C][C]-1.5926[/C][C]0.057844[/C][/ROW]
[ROW][C]23[/C][C]0.16959[/C][C]1.429[/C][C]0.078696[/C][/ROW]
[ROW][C]24[/C][C]0.651433[/C][C]5.4891[/C][C]0[/C][/ROW]
[ROW][C]25[/C][C]0.272583[/C][C]2.2968[/C][C]0.012291[/C][/ROW]
[ROW][C]26[/C][C]-0.143625[/C][C]-1.2102[/C][C]0.115106[/C][/ROW]
[ROW][C]27[/C][C]-0.305197[/C][C]-2.5716[/C][C]0.006108[/C][/ROW]
[ROW][C]28[/C][C]-0.20856[/C][C]-1.7574[/C][C]0.041584[/C][/ROW]
[ROW][C]29[/C][C]-0.01983[/C][C]-0.1671[/C][C]0.433887[/C][/ROW]
[ROW][C]30[/C][C]0.123096[/C][C]1.0372[/C][C]0.151575[/C][/ROW]
[ROW][C]31[/C][C]0.054791[/C][C]0.4617[/C][C]0.322862[/C][/ROW]
[ROW][C]32[/C][C]-0.112692[/C][C]-0.9496[/C][C]0.172779[/C][/ROW]
[ROW][C]33[/C][C]-0.206925[/C][C]-1.7436[/C][C]0.04278[/C][/ROW]
[ROW][C]34[/C][C]-0.131754[/C][C]-1.1102[/C][C]0.135334[/C][/ROW]
[ROW][C]35[/C][C]0.109227[/C][C]0.9204[/C][C]0.18025[/C][/ROW]
[ROW][C]36[/C][C]0.480018[/C][C]4.0447[/C][C]6.6e-05[/C][/ROW]
[ROW][C]37[/C][C]0.220371[/C][C]1.8569[/C][C]0.033738[/C][/ROW]
[ROW][C]38[/C][C]-0.099583[/C][C]-0.8391[/C][C]0.202115[/C][/ROW]
[ROW][C]39[/C][C]-0.222419[/C][C]-1.8741[/C][C]0.032513[/C][/ROW]
[ROW][C]40[/C][C]-0.159047[/C][C]-1.3402[/C][C]0.092234[/C][/ROW]
[ROW][C]41[/C][C]-0.020881[/C][C]-0.1759[/C][C]0.43042[/C][/ROW]
[ROW][C]42[/C][C]0.091254[/C][C]0.7689[/C][C]0.222245[/C][/ROW]
[ROW][C]43[/C][C]0.060853[/C][C]0.5128[/C][C]0.304857[/C][/ROW]
[ROW][C]44[/C][C]-0.071333[/C][C]-0.6011[/C][C]0.274858[/C][/ROW]
[ROW][C]45[/C][C]-0.126465[/C][C]-1.0656[/C][C]0.145105[/C][/ROW]
[ROW][C]46[/C][C]-0.091748[/C][C]-0.7731[/C][C]0.221019[/C][/ROW]
[ROW][C]47[/C][C]0.054255[/C][C]0.4572[/C][C]0.324476[/C][/ROW]
[ROW][C]48[/C][C]0.30243[/C][C]2.5483[/C][C]0.006494[/C][/ROW]
[/TABLE]
Source: https://freestatistics.org/blog/index.php?pk=243464&T=1

Globally Unique Identifier (entire table): ba.freestatistics.org/blog/index.php?pk=243464&T=1

As an alternative you can also use a QR Code:  

The GUIDs for individual cells are displayed in the table below:

Autocorrelation Function
Time lag kACF(k)T-STATP-value
10.3266552.75240.003752
2-0.24278-2.04570.022246
3-0.43225-3.64220.000255
4-0.287889-2.42580.008909
50.0213750.18010.428789
60.2065021.740.043094
70.0599940.50550.307379
8-0.205332-1.73020.043974
9-0.361145-3.04310.001641
10-0.223531-1.88350.031864
110.2523972.12670.018459
120.8062676.79370
130.3019882.54460.006558
14-0.197293-1.66240.050419
15-0.381656-3.21590.000979
16-0.259828-2.18940.01593
170.0080190.06760.47316
180.1666251.4040.082338
190.0535150.45090.326709
20-0.168906-1.42320.079525
21-0.305444-2.57370.006075
22-0.189009-1.59260.057844
230.169591.4290.078696
240.6514335.48910
250.2725832.29680.012291
26-0.143625-1.21020.115106
27-0.305197-2.57160.006108
28-0.20856-1.75740.041584
29-0.01983-0.16710.433887
300.1230961.03720.151575
310.0547910.46170.322862
32-0.112692-0.94960.172779
33-0.206925-1.74360.04278
34-0.131754-1.11020.135334
350.1092270.92040.18025
360.4800184.04476.6e-05
370.2203711.85690.033738
38-0.099583-0.83910.202115
39-0.222419-1.87410.032513
40-0.159047-1.34020.092234
41-0.020881-0.17590.43042
420.0912540.76890.222245
430.0608530.51280.304857
44-0.071333-0.60110.274858
45-0.126465-1.06560.145105
46-0.091748-0.77310.221019
470.0542550.45720.324476
480.302432.54830.006494


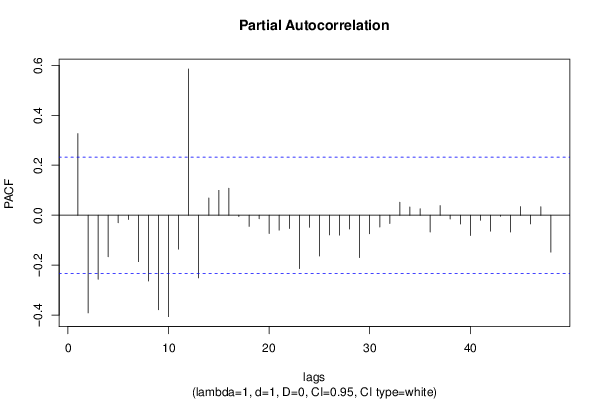
Partial Autocorrelation Function
Time lag kPACF(k)T-STATP-value
10.3266552.75240.003752
2-0.391228-3.29650.000765
3-0.256582-2.1620.016995
4-0.166537-1.40330.082448
5-0.030628-0.25810.398548
6-0.017169-0.14470.442691
7-0.186037-1.56760.060713
8-0.263407-2.21950.014824
9-0.378791-3.19180.001054
10-0.406264-3.42320.000515
11-0.135909-1.14520.127989
120.5855044.93353e-06
13-0.25095-2.11450.018991
140.0689660.58110.281499
150.0994680.83810.202384
160.1081720.91150.182566
17-0.005649-0.04760.481086
18-0.044788-0.37740.353504
19-0.01415-0.11920.452715
20-0.073183-0.61670.269719
21-0.059934-0.5050.307558
22-0.053384-0.44980.327105
23-0.213879-1.80220.037881
24-0.048402-0.40780.34231
25-0.163724-1.37960.086026
26-0.078795-0.66390.25444
27-0.079821-0.67260.251698
28-0.055437-0.46710.320922
29-0.169834-1.4310.078402
30-0.074702-0.62940.265538
31-0.047027-0.39630.346553
32-0.03345-0.28190.389439
330.0516390.43510.332397
340.0329450.27760.391064
350.0260540.21950.413432
36-0.067261-0.56680.286335
370.0383390.3230.373804
38-0.015291-0.12880.448924
39-0.035529-0.29940.382765
40-0.081567-0.68730.247068
41-0.02051-0.17280.431641
42-0.063767-0.53730.296368
43-0.004375-0.03690.485349
44-0.067368-0.56770.286032
450.0343940.28980.386403
46-0.034798-0.29320.385109
470.0338570.28530.38813
48-0.148018-1.24720.108207

\begin{tabular}{lllllllll}
\hline
Partial Autocorrelation Function \tabularnewline
Time lag k & PACF(k) & T-STAT & P-value \tabularnewline
1 & 0.326655 & 2.7524 & 0.003752 \tabularnewline
2 & -0.391228 & -3.2965 & 0.000765 \tabularnewline
3 & -0.256582 & -2.162 & 0.016995 \tabularnewline
4 & -0.166537 & -1.4033 & 0.082448 \tabularnewline
5 & -0.030628 & -0.2581 & 0.398548 \tabularnewline
6 & -0.017169 & -0.1447 & 0.442691 \tabularnewline
7 & -0.186037 & -1.5676 & 0.060713 \tabularnewline
8 & -0.263407 & -2.2195 & 0.014824 \tabularnewline
9 & -0.378791 & -3.1918 & 0.001054 \tabularnewline
10 & -0.406264 & -3.4232 & 0.000515 \tabularnewline
11 & -0.135909 & -1.1452 & 0.127989 \tabularnewline
12 & 0.585504 & 4.9335 & 3e-06 \tabularnewline
13 & -0.25095 & -2.1145 & 0.018991 \tabularnewline
14 & 0.068966 & 0.5811 & 0.281499 \tabularnewline
15 & 0.099468 & 0.8381 & 0.202384 \tabularnewline
16 & 0.108172 & 0.9115 & 0.182566 \tabularnewline
17 & -0.005649 & -0.0476 & 0.481086 \tabularnewline
18 & -0.044788 & -0.3774 & 0.353504 \tabularnewline
19 & -0.01415 & -0.1192 & 0.452715 \tabularnewline
20 & -0.073183 & -0.6167 & 0.269719 \tabularnewline
21 & -0.059934 & -0.505 & 0.307558 \tabularnewline
22 & -0.053384 & -0.4498 & 0.327105 \tabularnewline
23 & -0.213879 & -1.8022 & 0.037881 \tabularnewline
24 & -0.048402 & -0.4078 & 0.34231 \tabularnewline
25 & -0.163724 & -1.3796 & 0.086026 \tabularnewline
26 & -0.078795 & -0.6639 & 0.25444 \tabularnewline
27 & -0.079821 & -0.6726 & 0.251698 \tabularnewline
28 & -0.055437 & -0.4671 & 0.320922 \tabularnewline
29 & -0.169834 & -1.431 & 0.078402 \tabularnewline
30 & -0.074702 & -0.6294 & 0.265538 \tabularnewline
31 & -0.047027 & -0.3963 & 0.346553 \tabularnewline
32 & -0.03345 & -0.2819 & 0.389439 \tabularnewline
33 & 0.051639 & 0.4351 & 0.332397 \tabularnewline
34 & 0.032945 & 0.2776 & 0.391064 \tabularnewline
35 & 0.026054 & 0.2195 & 0.413432 \tabularnewline
36 & -0.067261 & -0.5668 & 0.286335 \tabularnewline
37 & 0.038339 & 0.323 & 0.373804 \tabularnewline
38 & -0.015291 & -0.1288 & 0.448924 \tabularnewline
39 & -0.035529 & -0.2994 & 0.382765 \tabularnewline
40 & -0.081567 & -0.6873 & 0.247068 \tabularnewline
41 & -0.02051 & -0.1728 & 0.431641 \tabularnewline
42 & -0.063767 & -0.5373 & 0.296368 \tabularnewline
43 & -0.004375 & -0.0369 & 0.485349 \tabularnewline
44 & -0.067368 & -0.5677 & 0.286032 \tabularnewline
45 & 0.034394 & 0.2898 & 0.386403 \tabularnewline
46 & -0.034798 & -0.2932 & 0.385109 \tabularnewline
47 & 0.033857 & 0.2853 & 0.38813 \tabularnewline
48 & -0.148018 & -1.2472 & 0.108207 \tabularnewline
\hline
\end{tabular}
%Source: https://freestatistics.org/blog/index.php?pk=243464&T=2

[TABLE]
[ROW][C]Partial Autocorrelation Function[/C][/ROW]
[ROW][C]Time lag k[/C][C]PACF(k)[/C][C]T-STAT[/C][C]P-value[/C][/ROW]
[ROW][C]1[/C][C]0.326655[/C][C]2.7524[/C][C]0.003752[/C][/ROW]
[ROW][C]2[/C][C]-0.391228[/C][C]-3.2965[/C][C]0.000765[/C][/ROW]
[ROW][C]3[/C][C]-0.256582[/C][C]-2.162[/C][C]0.016995[/C][/ROW]
[ROW][C]4[/C][C]-0.166537[/C][C]-1.4033[/C][C]0.082448[/C][/ROW]
[ROW][C]5[/C][C]-0.030628[/C][C]-0.2581[/C][C]0.398548[/C][/ROW]
[ROW][C]6[/C][C]-0.017169[/C][C]-0.1447[/C][C]0.442691[/C][/ROW]
[ROW][C]7[/C][C]-0.186037[/C][C]-1.5676[/C][C]0.060713[/C][/ROW]
[ROW][C]8[/C][C]-0.263407[/C][C]-2.2195[/C][C]0.014824[/C][/ROW]
[ROW][C]9[/C][C]-0.378791[/C][C]-3.1918[/C][C]0.001054[/C][/ROW]
[ROW][C]10[/C][C]-0.406264[/C][C]-3.4232[/C][C]0.000515[/C][/ROW]
[ROW][C]11[/C][C]-0.135909[/C][C]-1.1452[/C][C]0.127989[/C][/ROW]
[ROW][C]12[/C][C]0.585504[/C][C]4.9335[/C][C]3e-06[/C][/ROW]
[ROW][C]13[/C][C]-0.25095[/C][C]-2.1145[/C][C]0.018991[/C][/ROW]
[ROW][C]14[/C][C]0.068966[/C][C]0.5811[/C][C]0.281499[/C][/ROW]
[ROW][C]15[/C][C]0.099468[/C][C]0.8381[/C][C]0.202384[/C][/ROW]
[ROW][C]16[/C][C]0.108172[/C][C]0.9115[/C][C]0.182566[/C][/ROW]
[ROW][C]17[/C][C]-0.005649[/C][C]-0.0476[/C][C]0.481086[/C][/ROW]
[ROW][C]18[/C][C]-0.044788[/C][C]-0.3774[/C][C]0.353504[/C][/ROW]
[ROW][C]19[/C][C]-0.01415[/C][C]-0.1192[/C][C]0.452715[/C][/ROW]
[ROW][C]20[/C][C]-0.073183[/C][C]-0.6167[/C][C]0.269719[/C][/ROW]
[ROW][C]21[/C][C]-0.059934[/C][C]-0.505[/C][C]0.307558[/C][/ROW]
[ROW][C]22[/C][C]-0.053384[/C][C]-0.4498[/C][C]0.327105[/C][/ROW]
[ROW][C]23[/C][C]-0.213879[/C][C]-1.8022[/C][C]0.037881[/C][/ROW]
[ROW][C]24[/C][C]-0.048402[/C][C]-0.4078[/C][C]0.34231[/C][/ROW]
[ROW][C]25[/C][C]-0.163724[/C][C]-1.3796[/C][C]0.086026[/C][/ROW]
[ROW][C]26[/C][C]-0.078795[/C][C]-0.6639[/C][C]0.25444[/C][/ROW]
[ROW][C]27[/C][C]-0.079821[/C][C]-0.6726[/C][C]0.251698[/C][/ROW]
[ROW][C]28[/C][C]-0.055437[/C][C]-0.4671[/C][C]0.320922[/C][/ROW]
[ROW][C]29[/C][C]-0.169834[/C][C]-1.431[/C][C]0.078402[/C][/ROW]
[ROW][C]30[/C][C]-0.074702[/C][C]-0.6294[/C][C]0.265538[/C][/ROW]
[ROW][C]31[/C][C]-0.047027[/C][C]-0.3963[/C][C]0.346553[/C][/ROW]
[ROW][C]32[/C][C]-0.03345[/C][C]-0.2819[/C][C]0.389439[/C][/ROW]
[ROW][C]33[/C][C]0.051639[/C][C]0.4351[/C][C]0.332397[/C][/ROW]
[ROW][C]34[/C][C]0.032945[/C][C]0.2776[/C][C]0.391064[/C][/ROW]
[ROW][C]35[/C][C]0.026054[/C][C]0.2195[/C][C]0.413432[/C][/ROW]
[ROW][C]36[/C][C]-0.067261[/C][C]-0.5668[/C][C]0.286335[/C][/ROW]
[ROW][C]37[/C][C]0.038339[/C][C]0.323[/C][C]0.373804[/C][/ROW]
[ROW][C]38[/C][C]-0.015291[/C][C]-0.1288[/C][C]0.448924[/C][/ROW]
[ROW][C]39[/C][C]-0.035529[/C][C]-0.2994[/C][C]0.382765[/C][/ROW]
[ROW][C]40[/C][C]-0.081567[/C][C]-0.6873[/C][C]0.247068[/C][/ROW]
[ROW][C]41[/C][C]-0.02051[/C][C]-0.1728[/C][C]0.431641[/C][/ROW]
[ROW][C]42[/C][C]-0.063767[/C][C]-0.5373[/C][C]0.296368[/C][/ROW]
[ROW][C]43[/C][C]-0.004375[/C][C]-0.0369[/C][C]0.485349[/C][/ROW]
[ROW][C]44[/C][C]-0.067368[/C][C]-0.5677[/C][C]0.286032[/C][/ROW]
[ROW][C]45[/C][C]0.034394[/C][C]0.2898[/C][C]0.386403[/C][/ROW]
[ROW][C]46[/C][C]-0.034798[/C][C]-0.2932[/C][C]0.385109[/C][/ROW]
[ROW][C]47[/C][C]0.033857[/C][C]0.2853[/C][C]0.38813[/C][/ROW]
[ROW][C]48[/C][C]-0.148018[/C][C]-1.2472[/C][C]0.108207[/C][/ROW]
[/TABLE]
Source: https://freestatistics.org/blog/index.php?pk=243464&T=2

Globally Unique Identifier (entire table): ba.freestatistics.org/blog/index.php?pk=243464&T=2

As an alternative you can also use a QR Code:  

The GUIDs for individual cells are displayed in the table below:

Partial Autocorrelation Function
Time lag kPACF(k)T-STATP-value
10.3266552.75240.003752
2-0.391228-3.29650.000765
3-0.256582-2.1620.016995
4-0.166537-1.40330.082448
5-0.030628-0.25810.398548
6-0.017169-0.14470.442691
7-0.186037-1.56760.060713
8-0.263407-2.21950.014824
9-0.378791-3.19180.001054
10-0.406264-3.42320.000515
11-0.135909-1.14520.127989
120.5855044.93353e-06
13-0.25095-2.11450.018991
140.0689660.58110.281499
150.0994680.83810.202384
160.1081720.91150.182566
17-0.005649-0.04760.481086
18-0.044788-0.37740.353504
19-0.01415-0.11920.452715
20-0.073183-0.61670.269719
21-0.059934-0.5050.307558
22-0.053384-0.44980.327105
23-0.213879-1.80220.037881
24-0.048402-0.40780.34231
25-0.163724-1.37960.086026
26-0.078795-0.66390.25444
27-0.079821-0.67260.251698
28-0.055437-0.46710.320922
29-0.169834-1.4310.078402
30-0.074702-0.62940.265538
31-0.047027-0.39630.346553
32-0.03345-0.28190.389439
330.0516390.43510.332397
340.0329450.27760.391064
350.0260540.21950.413432
36-0.067261-0.56680.286335
370.0383390.3230.373804
38-0.015291-0.12880.448924
39-0.035529-0.29940.382765
40-0.081567-0.68730.247068
41-0.02051-0.17280.431641
42-0.063767-0.53730.296368
43-0.004375-0.03690.485349
44-0.067368-0.56770.286032
450.0343940.28980.386403
46-0.034798-0.29320.385109
470.0338570.28530.38813
48-0.148018-1.24720.108207


Parameters (Session):
par1 = 48 ; par2 = 1 ; par3 = 1 ; par4 = 0 ; par5 = 12 ; par6 = White Noise ; par7 = 0.95 ;
Parameters (R input):
par1 = 48 ; par2 = 1 ; par3 = 1 ; par4 = 0 ; par5 = 12 ; par6 = White Noise ; par7 = 0.95 ; par8 = ;
R code (references can be found in the software module):
if (par1 == 'Default') {
par1 = 10*log10(length(x))
} else {
par1 <- as.numeric(par1)
}
par2 <- as.numeric(par2)
par3 <- as.numeric(par3)
par4 <- as.numeric(par4)
par5 <- as.numeric(par5)
if (par6 == 'White Noise') par6 <- 'white' else par6 <- 'ma'
par7 <- as.numeric(par7)
if (par8 != '') par8 <- as.numeric(par8)
ox <- x
if (par8 == '') {
if (par2 == 0) {
x <- log(x)
} else {
x <- (x ^ par2 - 1) / par2
}
} else {
x <- log(x,base=par8)
}
if (par3 > 0) x <- diff(x,lag=1,difference=par3)
if (par4 > 0) x <- diff(x,lag=par5,difference=par4)
bitmap(file='picts.png')
op <- par(mfrow=c(2,1))
plot(ox,type='l',main='Original Time Series',xlab='time',ylab='value')
if (par8=='') {
mytitle <- paste('Working Time Series (lambda=',par2,', d=',par3,', D=',par4,')',sep='')
mysub <- paste('(lambda=',par2,', d=',par3,', D=',par4,', CI=', par7, ', CI type=',par6,')',sep='')
} else {
mytitle <- paste('Working Time Series (base=',par8,', d=',par3,', D=',par4,')',sep='')
mysub <- paste('(base=',par8,', d=',par3,', D=',par4,', CI=', par7, ', CI type=',par6,')',sep='')
}
plot(x,type='l', main=mytitle,xlab='time',ylab='value')
par(op)
dev.off()
bitmap(file='pic1.png')
racf <- acf(x, par1, main='Autocorrelation', xlab='time lag', ylab='ACF', ci.type=par6, ci=par7, sub=mysub)
dev.off()
bitmap(file='pic2.png')
rpacf <- pacf(x,par1,main='Partial Autocorrelation',xlab='lags',ylab='PACF',sub=mysub)
dev.off()
(myacf <- c(racf$acf))
(mypacf <- c(rpacf$acf))
lengthx <- length(x)
sqrtn <- sqrt(lengthx)
load(file='createtable')
a<-table.start()
a<-table.row.start(a)
a<-table.element(a,'Autocorrelation Function',4,TRUE)
a<-table.row.end(a)
a<-table.row.start(a)
a<-table.element(a,'Time lag k',header=TRUE)
a<-table.element(a,hyperlink('basics.htm','ACF(k)','click here for more information about the Autocorrelation Function'),header=TRUE)
a<-table.element(a,'T-STAT',header=TRUE)
a<-table.element(a,'P-value',header=TRUE)
a<-table.row.end(a)
for (i in 2:(par1+1)) {
a<-table.row.start(a)
a<-table.element(a,i-1,header=TRUE)
a<-table.element(a,round(myacf[i],6))
mytstat <- myacf[i]*sqrtn
a<-table.element(a,round(mytstat,4))
a<-table.element(a,round(1-pt(abs(mytstat),lengthx),6))
a<-table.row.end(a)
}
a<-table.end(a)
table.save(a,file='mytable.tab')
a<-table.start()
a<-table.row.start(a)
a<-table.element(a,'Partial Autocorrelation Function',4,TRUE)
a<-table.row.end(a)
a<-table.row.start(a)
a<-table.element(a,'Time lag k',header=TRUE)
a<-table.element(a,hyperlink('basics.htm','PACF(k)','click here for more information about the Partial Autocorrelation Function'),header=TRUE)
a<-table.element(a,'T-STAT',header=TRUE)
a<-table.element(a,'P-value',header=TRUE)
a<-table.row.end(a)
for (i in 1:par1) {
a<-table.row.start(a)
a<-table.element(a,i,header=TRUE)
a<-table.element(a,round(mypacf[i],6))
mytstat <- mypacf[i]*sqrtn
a<-table.element(a,round(mytstat,4))
a<-table.element(a,round(1-pt(abs(mytstat),lengthx),6))
a<-table.row.end(a)
}
a<-table.end(a)
table.save(a,file='mytable1.tab')