Free Statistics

of Irreproducible Research!

Author's title

Author*Unverified author*
R Software Modulerwasp_autocorrelation.wasp
Title produced by software(Partial) Autocorrelation Function
Date of computationSat, 18 Oct 2014 13:14:28 +0100
Cite this page as followsStatistical Computations at FreeStatistics.org, Office for Research Development and Education, URL https://freestatistics.org/blog/index.php?v=date/2014/Oct/18/t14136345020kp7el6ojz5rlqv.htm/, Retrieved Mon, 13 May 2024 00:09:24 +0000
Statistical Computations at FreeStatistics.org, Office for Research Development and Education, URL https://freestatistics.org/blog/index.php?pk=243463, Retrieved Mon, 13 May 2024 00:09:24 +0000
QR Codes:

Original text written by user:
IsPrivate?No (this computation is public)
User-defined keywords
Estimated Impact71
Family? (F = Feedback message, R = changed R code, M = changed R Module, P = changed Parameters, D = changed Data)
-       [(Partial) Autocorrelation Function] [] [2014-10-18 12:14:28] [2f27692a17e58baa8638275162e45e6c] [Current]
Feedback Forum

Post a new message
Dataseries X:
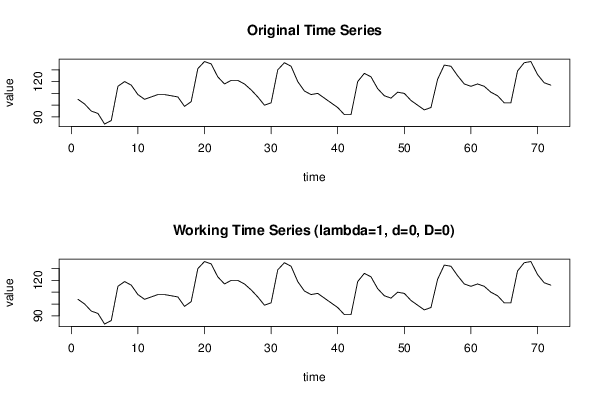
105
101
95
93
84
87
116
120
117
109
105
107
109
109
108
107
99
103
131
137
135
124
118
121
121
118
113
107
100
102
130
136
133
120
112
109
110
106
102
98
92
92
120
127
124
114
108
106
111
110
104
100
96
98
122
134
133
125
118
116
118
116
111
108
102
102
129
136
137
126
119
117


Summary of computational transaction
Raw Inputview raw input (R code)
Raw Outputview raw output of R engine
Computing time1 seconds
R Server'Herman Ole Andreas Wold' @ wold.wessa.net

\begin{tabular}{lllllllll}
\hline
Summary of computational transaction \tabularnewline
Raw Input & view raw input (R code)  \tabularnewline
Raw Output & view raw output of R engine  \tabularnewline
Computing time & 1 seconds \tabularnewline
R Server & 'Herman Ole Andreas Wold' @ wold.wessa.net \tabularnewline
\hline
\end{tabular}
%Source: https://freestatistics.org/blog/index.php?pk=243463&T=0

[TABLE]
[ROW][C]Summary of computational transaction[/C][/ROW]
[ROW][C]Raw Input[/C][C]view raw input (R code) [/C][/ROW]
[ROW][C]Raw Output[/C][C]view raw output of R engine [/C][/ROW]
[ROW][C]Computing time[/C][C]1 seconds[/C][/ROW]
[ROW][C]R Server[/C][C]'Herman Ole Andreas Wold' @ wold.wessa.net[/C][/ROW]
[/TABLE]
Source: https://freestatistics.org/blog/index.php?pk=243463&T=0

Globally Unique Identifier (entire table): ba.freestatistics.org/blog/index.php?pk=243463&T=0

As an alternative you can also use a QR Code:  

The GUIDs for individual cells are displayed in the table below:

Summary of computational transaction
Raw Inputview raw input (R code)
Raw Outputview raw output of R engine
Computing time1 seconds
R Server'Herman Ole Andreas Wold' @ wold.wessa.net


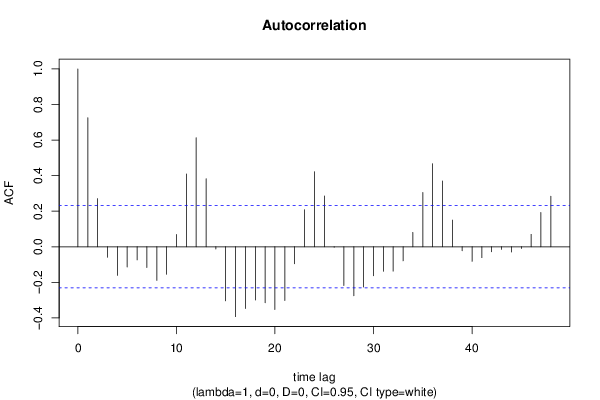
Autocorrelation Function
Time lag kACF(k)T-STATP-value
10.7257196.15790
20.2708632.29840.012224
3-0.059373-0.50380.307972
4-0.161265-1.36840.087725
5-0.113627-0.96420.169097
6-0.073741-0.62570.266741
7-0.116762-0.99080.162561
8-0.189369-1.60680.056233
9-0.154732-1.31290.096686
100.0690960.58630.279755
110.4094153.4740.000436
120.6134685.20551e-06
130.3826773.24710.000886
14-0.012555-0.10650.457729
15-0.304296-2.5820.005928
16-0.393159-3.33610.000673
17-0.347506-2.94870.00215
18-0.299661-2.54270.006575
19-0.314592-2.66940.004692
20-0.353266-2.99760.001866
21-0.302722-2.56870.006141
22-0.095225-0.8080.210872
230.2086211.77020.040463
240.4223463.58370.000306
250.2850912.41910.009044
26-0.002435-0.02070.491785
27-0.217667-1.8470.034431
28-0.275373-2.33660.011123
29-0.226277-1.920.029408
30-0.162995-1.38310.085461
31-0.137474-1.16650.12363
32-0.13707-1.16310.124319
33-0.079291-0.67280.251611
340.0806790.68460.247901
350.3052882.59050.005797
360.4672343.96468.6e-05
370.3701023.14040.001224
380.1497061.27030.104034
39-0.022553-0.19140.424389
40-0.082121-0.69680.24408
41-0.061313-0.52030.30224
42-0.027749-0.23550.407262
43-0.015012-0.12740.449497
44-0.029585-0.2510.40125
45-0.009821-0.08330.466908
460.0695850.59040.278369
470.1926881.6350.053205
480.2836942.40720.00932

\begin{tabular}{lllllllll}
\hline
Autocorrelation Function \tabularnewline
Time lag k & ACF(k) & T-STAT & P-value \tabularnewline
1 & 0.725719 & 6.1579 & 0 \tabularnewline
2 & 0.270863 & 2.2984 & 0.012224 \tabularnewline
3 & -0.059373 & -0.5038 & 0.307972 \tabularnewline
4 & -0.161265 & -1.3684 & 0.087725 \tabularnewline
5 & -0.113627 & -0.9642 & 0.169097 \tabularnewline
6 & -0.073741 & -0.6257 & 0.266741 \tabularnewline
7 & -0.116762 & -0.9908 & 0.162561 \tabularnewline
8 & -0.189369 & -1.6068 & 0.056233 \tabularnewline
9 & -0.154732 & -1.3129 & 0.096686 \tabularnewline
10 & 0.069096 & 0.5863 & 0.279755 \tabularnewline
11 & 0.409415 & 3.474 & 0.000436 \tabularnewline
12 & 0.613468 & 5.2055 & 1e-06 \tabularnewline
13 & 0.382677 & 3.2471 & 0.000886 \tabularnewline
14 & -0.012555 & -0.1065 & 0.457729 \tabularnewline
15 & -0.304296 & -2.582 & 0.005928 \tabularnewline
16 & -0.393159 & -3.3361 & 0.000673 \tabularnewline
17 & -0.347506 & -2.9487 & 0.00215 \tabularnewline
18 & -0.299661 & -2.5427 & 0.006575 \tabularnewline
19 & -0.314592 & -2.6694 & 0.004692 \tabularnewline
20 & -0.353266 & -2.9976 & 0.001866 \tabularnewline
21 & -0.302722 & -2.5687 & 0.006141 \tabularnewline
22 & -0.095225 & -0.808 & 0.210872 \tabularnewline
23 & 0.208621 & 1.7702 & 0.040463 \tabularnewline
24 & 0.422346 & 3.5837 & 0.000306 \tabularnewline
25 & 0.285091 & 2.4191 & 0.009044 \tabularnewline
26 & -0.002435 & -0.0207 & 0.491785 \tabularnewline
27 & -0.217667 & -1.847 & 0.034431 \tabularnewline
28 & -0.275373 & -2.3366 & 0.011123 \tabularnewline
29 & -0.226277 & -1.92 & 0.029408 \tabularnewline
30 & -0.162995 & -1.3831 & 0.085461 \tabularnewline
31 & -0.137474 & -1.1665 & 0.12363 \tabularnewline
32 & -0.13707 & -1.1631 & 0.124319 \tabularnewline
33 & -0.079291 & -0.6728 & 0.251611 \tabularnewline
34 & 0.080679 & 0.6846 & 0.247901 \tabularnewline
35 & 0.305288 & 2.5905 & 0.005797 \tabularnewline
36 & 0.467234 & 3.9646 & 8.6e-05 \tabularnewline
37 & 0.370102 & 3.1404 & 0.001224 \tabularnewline
38 & 0.149706 & 1.2703 & 0.104034 \tabularnewline
39 & -0.022553 & -0.1914 & 0.424389 \tabularnewline
40 & -0.082121 & -0.6968 & 0.24408 \tabularnewline
41 & -0.061313 & -0.5203 & 0.30224 \tabularnewline
42 & -0.027749 & -0.2355 & 0.407262 \tabularnewline
43 & -0.015012 & -0.1274 & 0.449497 \tabularnewline
44 & -0.029585 & -0.251 & 0.40125 \tabularnewline
45 & -0.009821 & -0.0833 & 0.466908 \tabularnewline
46 & 0.069585 & 0.5904 & 0.278369 \tabularnewline
47 & 0.192688 & 1.635 & 0.053205 \tabularnewline
48 & 0.283694 & 2.4072 & 0.00932 \tabularnewline
\hline
\end{tabular}
%Source: https://freestatistics.org/blog/index.php?pk=243463&T=1

[TABLE]
[ROW][C]Autocorrelation Function[/C][/ROW]
[ROW][C]Time lag k[/C][C]ACF(k)[/C][C]T-STAT[/C][C]P-value[/C][/ROW]
[ROW][C]1[/C][C]0.725719[/C][C]6.1579[/C][C]0[/C][/ROW]
[ROW][C]2[/C][C]0.270863[/C][C]2.2984[/C][C]0.012224[/C][/ROW]
[ROW][C]3[/C][C]-0.059373[/C][C]-0.5038[/C][C]0.307972[/C][/ROW]
[ROW][C]4[/C][C]-0.161265[/C][C]-1.3684[/C][C]0.087725[/C][/ROW]
[ROW][C]5[/C][C]-0.113627[/C][C]-0.9642[/C][C]0.169097[/C][/ROW]
[ROW][C]6[/C][C]-0.073741[/C][C]-0.6257[/C][C]0.266741[/C][/ROW]
[ROW][C]7[/C][C]-0.116762[/C][C]-0.9908[/C][C]0.162561[/C][/ROW]
[ROW][C]8[/C][C]-0.189369[/C][C]-1.6068[/C][C]0.056233[/C][/ROW]
[ROW][C]9[/C][C]-0.154732[/C][C]-1.3129[/C][C]0.096686[/C][/ROW]
[ROW][C]10[/C][C]0.069096[/C][C]0.5863[/C][C]0.279755[/C][/ROW]
[ROW][C]11[/C][C]0.409415[/C][C]3.474[/C][C]0.000436[/C][/ROW]
[ROW][C]12[/C][C]0.613468[/C][C]5.2055[/C][C]1e-06[/C][/ROW]
[ROW][C]13[/C][C]0.382677[/C][C]3.2471[/C][C]0.000886[/C][/ROW]
[ROW][C]14[/C][C]-0.012555[/C][C]-0.1065[/C][C]0.457729[/C][/ROW]
[ROW][C]15[/C][C]-0.304296[/C][C]-2.582[/C][C]0.005928[/C][/ROW]
[ROW][C]16[/C][C]-0.393159[/C][C]-3.3361[/C][C]0.000673[/C][/ROW]
[ROW][C]17[/C][C]-0.347506[/C][C]-2.9487[/C][C]0.00215[/C][/ROW]
[ROW][C]18[/C][C]-0.299661[/C][C]-2.5427[/C][C]0.006575[/C][/ROW]
[ROW][C]19[/C][C]-0.314592[/C][C]-2.6694[/C][C]0.004692[/C][/ROW]
[ROW][C]20[/C][C]-0.353266[/C][C]-2.9976[/C][C]0.001866[/C][/ROW]
[ROW][C]21[/C][C]-0.302722[/C][C]-2.5687[/C][C]0.006141[/C][/ROW]
[ROW][C]22[/C][C]-0.095225[/C][C]-0.808[/C][C]0.210872[/C][/ROW]
[ROW][C]23[/C][C]0.208621[/C][C]1.7702[/C][C]0.040463[/C][/ROW]
[ROW][C]24[/C][C]0.422346[/C][C]3.5837[/C][C]0.000306[/C][/ROW]
[ROW][C]25[/C][C]0.285091[/C][C]2.4191[/C][C]0.009044[/C][/ROW]
[ROW][C]26[/C][C]-0.002435[/C][C]-0.0207[/C][C]0.491785[/C][/ROW]
[ROW][C]27[/C][C]-0.217667[/C][C]-1.847[/C][C]0.034431[/C][/ROW]
[ROW][C]28[/C][C]-0.275373[/C][C]-2.3366[/C][C]0.011123[/C][/ROW]
[ROW][C]29[/C][C]-0.226277[/C][C]-1.92[/C][C]0.029408[/C][/ROW]
[ROW][C]30[/C][C]-0.162995[/C][C]-1.3831[/C][C]0.085461[/C][/ROW]
[ROW][C]31[/C][C]-0.137474[/C][C]-1.1665[/C][C]0.12363[/C][/ROW]
[ROW][C]32[/C][C]-0.13707[/C][C]-1.1631[/C][C]0.124319[/C][/ROW]
[ROW][C]33[/C][C]-0.079291[/C][C]-0.6728[/C][C]0.251611[/C][/ROW]
[ROW][C]34[/C][C]0.080679[/C][C]0.6846[/C][C]0.247901[/C][/ROW]
[ROW][C]35[/C][C]0.305288[/C][C]2.5905[/C][C]0.005797[/C][/ROW]
[ROW][C]36[/C][C]0.467234[/C][C]3.9646[/C][C]8.6e-05[/C][/ROW]
[ROW][C]37[/C][C]0.370102[/C][C]3.1404[/C][C]0.001224[/C][/ROW]
[ROW][C]38[/C][C]0.149706[/C][C]1.2703[/C][C]0.104034[/C][/ROW]
[ROW][C]39[/C][C]-0.022553[/C][C]-0.1914[/C][C]0.424389[/C][/ROW]
[ROW][C]40[/C][C]-0.082121[/C][C]-0.6968[/C][C]0.24408[/C][/ROW]
[ROW][C]41[/C][C]-0.061313[/C][C]-0.5203[/C][C]0.30224[/C][/ROW]
[ROW][C]42[/C][C]-0.027749[/C][C]-0.2355[/C][C]0.407262[/C][/ROW]
[ROW][C]43[/C][C]-0.015012[/C][C]-0.1274[/C][C]0.449497[/C][/ROW]
[ROW][C]44[/C][C]-0.029585[/C][C]-0.251[/C][C]0.40125[/C][/ROW]
[ROW][C]45[/C][C]-0.009821[/C][C]-0.0833[/C][C]0.466908[/C][/ROW]
[ROW][C]46[/C][C]0.069585[/C][C]0.5904[/C][C]0.278369[/C][/ROW]
[ROW][C]47[/C][C]0.192688[/C][C]1.635[/C][C]0.053205[/C][/ROW]
[ROW][C]48[/C][C]0.283694[/C][C]2.4072[/C][C]0.00932[/C][/ROW]
[/TABLE]
Source: https://freestatistics.org/blog/index.php?pk=243463&T=1

Globally Unique Identifier (entire table): ba.freestatistics.org/blog/index.php?pk=243463&T=1

As an alternative you can also use a QR Code:  

The GUIDs for individual cells are displayed in the table below:

Autocorrelation Function
Time lag kACF(k)T-STATP-value
10.7257196.15790
20.2708632.29840.012224
3-0.059373-0.50380.307972
4-0.161265-1.36840.087725
5-0.113627-0.96420.169097
6-0.073741-0.62570.266741
7-0.116762-0.99080.162561
8-0.189369-1.60680.056233
9-0.154732-1.31290.096686
100.0690960.58630.279755
110.4094153.4740.000436
120.6134685.20551e-06
130.3826773.24710.000886
14-0.012555-0.10650.457729
15-0.304296-2.5820.005928
16-0.393159-3.33610.000673
17-0.347506-2.94870.00215
18-0.299661-2.54270.006575
19-0.314592-2.66940.004692
20-0.353266-2.99760.001866
21-0.302722-2.56870.006141
22-0.095225-0.8080.210872
230.2086211.77020.040463
240.4223463.58370.000306
250.2850912.41910.009044
26-0.002435-0.02070.491785
27-0.217667-1.8470.034431
28-0.275373-2.33660.011123
29-0.226277-1.920.029408
30-0.162995-1.38310.085461
31-0.137474-1.16650.12363
32-0.13707-1.16310.124319
33-0.079291-0.67280.251611
340.0806790.68460.247901
350.3052882.59050.005797
360.4672343.96468.6e-05
370.3701023.14040.001224
380.1497061.27030.104034
39-0.022553-0.19140.424389
40-0.082121-0.69680.24408
41-0.061313-0.52030.30224
42-0.027749-0.23550.407262
43-0.015012-0.12740.449497
44-0.029585-0.2510.40125
45-0.009821-0.08330.466908
460.0695850.59040.278369
470.1926881.6350.053205
480.2836942.40720.00932


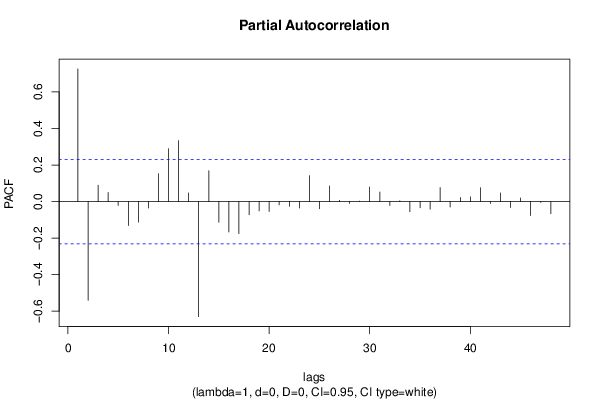
Partial Autocorrelation Function
Time lag kPACF(k)T-STATP-value
10.7257196.15790
2-0.540432-4.58579e-06
30.0896040.76030.224775
40.0495580.42050.337682
5-0.021055-0.17870.429354
6-0.130706-1.10910.135544
7-0.112631-0.95570.171209
8-0.035047-0.29740.383516
90.1520161.28990.100607
100.289412.45570.008237
110.3336792.83140.003003
120.0464740.39430.347247
13-0.629906-5.34491e-06
140.16871.43150.078311
15-0.113533-0.96340.169295
16-0.167105-1.41790.080263
17-0.175434-1.48860.070479
18-0.072135-0.61210.271205
19-0.051022-0.43290.333179
20-0.053696-0.45560.325014
21-0.018263-0.1550.438642
22-0.026077-0.22130.412753
23-0.035404-0.30040.382364
240.1417961.20320.116425
25-0.039631-0.33630.36882
260.0849170.72050.23676
270.0065470.05560.477925
28-0.010207-0.08660.46561
290.0008250.0070.497216
300.0798690.67770.250063
310.0521130.44220.329838
32-0.021316-0.18090.42849
330.0049070.04160.483451
34-0.055978-0.4750.318115
35-0.033516-0.28440.388464
36-0.041457-0.35180.363016
370.0764250.64850.259366
38-0.029854-0.25330.40037
390.0222310.18860.425454
400.0257730.21870.413755
410.0755180.64080.261847
42-0.011093-0.09410.462634
430.0467470.39670.346396
44-0.031969-0.27130.393482
450.0197390.16750.433726
46-0.076289-0.64730.259738
47-0.00446-0.03780.484959
48-0.06724-0.57060.28504

\begin{tabular}{lllllllll}
\hline
Partial Autocorrelation Function \tabularnewline
Time lag k & PACF(k) & T-STAT & P-value \tabularnewline
1 & 0.725719 & 6.1579 & 0 \tabularnewline
2 & -0.540432 & -4.5857 & 9e-06 \tabularnewline
3 & 0.089604 & 0.7603 & 0.224775 \tabularnewline
4 & 0.049558 & 0.4205 & 0.337682 \tabularnewline
5 & -0.021055 & -0.1787 & 0.429354 \tabularnewline
6 & -0.130706 & -1.1091 & 0.135544 \tabularnewline
7 & -0.112631 & -0.9557 & 0.171209 \tabularnewline
8 & -0.035047 & -0.2974 & 0.383516 \tabularnewline
9 & 0.152016 & 1.2899 & 0.100607 \tabularnewline
10 & 0.28941 & 2.4557 & 0.008237 \tabularnewline
11 & 0.333679 & 2.8314 & 0.003003 \tabularnewline
12 & 0.046474 & 0.3943 & 0.347247 \tabularnewline
13 & -0.629906 & -5.3449 & 1e-06 \tabularnewline
14 & 0.1687 & 1.4315 & 0.078311 \tabularnewline
15 & -0.113533 & -0.9634 & 0.169295 \tabularnewline
16 & -0.167105 & -1.4179 & 0.080263 \tabularnewline
17 & -0.175434 & -1.4886 & 0.070479 \tabularnewline
18 & -0.072135 & -0.6121 & 0.271205 \tabularnewline
19 & -0.051022 & -0.4329 & 0.333179 \tabularnewline
20 & -0.053696 & -0.4556 & 0.325014 \tabularnewline
21 & -0.018263 & -0.155 & 0.438642 \tabularnewline
22 & -0.026077 & -0.2213 & 0.412753 \tabularnewline
23 & -0.035404 & -0.3004 & 0.382364 \tabularnewline
24 & 0.141796 & 1.2032 & 0.116425 \tabularnewline
25 & -0.039631 & -0.3363 & 0.36882 \tabularnewline
26 & 0.084917 & 0.7205 & 0.23676 \tabularnewline
27 & 0.006547 & 0.0556 & 0.477925 \tabularnewline
28 & -0.010207 & -0.0866 & 0.46561 \tabularnewline
29 & 0.000825 & 0.007 & 0.497216 \tabularnewline
30 & 0.079869 & 0.6777 & 0.250063 \tabularnewline
31 & 0.052113 & 0.4422 & 0.329838 \tabularnewline
32 & -0.021316 & -0.1809 & 0.42849 \tabularnewline
33 & 0.004907 & 0.0416 & 0.483451 \tabularnewline
34 & -0.055978 & -0.475 & 0.318115 \tabularnewline
35 & -0.033516 & -0.2844 & 0.388464 \tabularnewline
36 & -0.041457 & -0.3518 & 0.363016 \tabularnewline
37 & 0.076425 & 0.6485 & 0.259366 \tabularnewline
38 & -0.029854 & -0.2533 & 0.40037 \tabularnewline
39 & 0.022231 & 0.1886 & 0.425454 \tabularnewline
40 & 0.025773 & 0.2187 & 0.413755 \tabularnewline
41 & 0.075518 & 0.6408 & 0.261847 \tabularnewline
42 & -0.011093 & -0.0941 & 0.462634 \tabularnewline
43 & 0.046747 & 0.3967 & 0.346396 \tabularnewline
44 & -0.031969 & -0.2713 & 0.393482 \tabularnewline
45 & 0.019739 & 0.1675 & 0.433726 \tabularnewline
46 & -0.076289 & -0.6473 & 0.259738 \tabularnewline
47 & -0.00446 & -0.0378 & 0.484959 \tabularnewline
48 & -0.06724 & -0.5706 & 0.28504 \tabularnewline
\hline
\end{tabular}
%Source: https://freestatistics.org/blog/index.php?pk=243463&T=2

[TABLE]
[ROW][C]Partial Autocorrelation Function[/C][/ROW]
[ROW][C]Time lag k[/C][C]PACF(k)[/C][C]T-STAT[/C][C]P-value[/C][/ROW]
[ROW][C]1[/C][C]0.725719[/C][C]6.1579[/C][C]0[/C][/ROW]
[ROW][C]2[/C][C]-0.540432[/C][C]-4.5857[/C][C]9e-06[/C][/ROW]
[ROW][C]3[/C][C]0.089604[/C][C]0.7603[/C][C]0.224775[/C][/ROW]
[ROW][C]4[/C][C]0.049558[/C][C]0.4205[/C][C]0.337682[/C][/ROW]
[ROW][C]5[/C][C]-0.021055[/C][C]-0.1787[/C][C]0.429354[/C][/ROW]
[ROW][C]6[/C][C]-0.130706[/C][C]-1.1091[/C][C]0.135544[/C][/ROW]
[ROW][C]7[/C][C]-0.112631[/C][C]-0.9557[/C][C]0.171209[/C][/ROW]
[ROW][C]8[/C][C]-0.035047[/C][C]-0.2974[/C][C]0.383516[/C][/ROW]
[ROW][C]9[/C][C]0.152016[/C][C]1.2899[/C][C]0.100607[/C][/ROW]
[ROW][C]10[/C][C]0.28941[/C][C]2.4557[/C][C]0.008237[/C][/ROW]
[ROW][C]11[/C][C]0.333679[/C][C]2.8314[/C][C]0.003003[/C][/ROW]
[ROW][C]12[/C][C]0.046474[/C][C]0.3943[/C][C]0.347247[/C][/ROW]
[ROW][C]13[/C][C]-0.629906[/C][C]-5.3449[/C][C]1e-06[/C][/ROW]
[ROW][C]14[/C][C]0.1687[/C][C]1.4315[/C][C]0.078311[/C][/ROW]
[ROW][C]15[/C][C]-0.113533[/C][C]-0.9634[/C][C]0.169295[/C][/ROW]
[ROW][C]16[/C][C]-0.167105[/C][C]-1.4179[/C][C]0.080263[/C][/ROW]
[ROW][C]17[/C][C]-0.175434[/C][C]-1.4886[/C][C]0.070479[/C][/ROW]
[ROW][C]18[/C][C]-0.072135[/C][C]-0.6121[/C][C]0.271205[/C][/ROW]
[ROW][C]19[/C][C]-0.051022[/C][C]-0.4329[/C][C]0.333179[/C][/ROW]
[ROW][C]20[/C][C]-0.053696[/C][C]-0.4556[/C][C]0.325014[/C][/ROW]
[ROW][C]21[/C][C]-0.018263[/C][C]-0.155[/C][C]0.438642[/C][/ROW]
[ROW][C]22[/C][C]-0.026077[/C][C]-0.2213[/C][C]0.412753[/C][/ROW]
[ROW][C]23[/C][C]-0.035404[/C][C]-0.3004[/C][C]0.382364[/C][/ROW]
[ROW][C]24[/C][C]0.141796[/C][C]1.2032[/C][C]0.116425[/C][/ROW]
[ROW][C]25[/C][C]-0.039631[/C][C]-0.3363[/C][C]0.36882[/C][/ROW]
[ROW][C]26[/C][C]0.084917[/C][C]0.7205[/C][C]0.23676[/C][/ROW]
[ROW][C]27[/C][C]0.006547[/C][C]0.0556[/C][C]0.477925[/C][/ROW]
[ROW][C]28[/C][C]-0.010207[/C][C]-0.0866[/C][C]0.46561[/C][/ROW]
[ROW][C]29[/C][C]0.000825[/C][C]0.007[/C][C]0.497216[/C][/ROW]
[ROW][C]30[/C][C]0.079869[/C][C]0.6777[/C][C]0.250063[/C][/ROW]
[ROW][C]31[/C][C]0.052113[/C][C]0.4422[/C][C]0.329838[/C][/ROW]
[ROW][C]32[/C][C]-0.021316[/C][C]-0.1809[/C][C]0.42849[/C][/ROW]
[ROW][C]33[/C][C]0.004907[/C][C]0.0416[/C][C]0.483451[/C][/ROW]
[ROW][C]34[/C][C]-0.055978[/C][C]-0.475[/C][C]0.318115[/C][/ROW]
[ROW][C]35[/C][C]-0.033516[/C][C]-0.2844[/C][C]0.388464[/C][/ROW]
[ROW][C]36[/C][C]-0.041457[/C][C]-0.3518[/C][C]0.363016[/C][/ROW]
[ROW][C]37[/C][C]0.076425[/C][C]0.6485[/C][C]0.259366[/C][/ROW]
[ROW][C]38[/C][C]-0.029854[/C][C]-0.2533[/C][C]0.40037[/C][/ROW]
[ROW][C]39[/C][C]0.022231[/C][C]0.1886[/C][C]0.425454[/C][/ROW]
[ROW][C]40[/C][C]0.025773[/C][C]0.2187[/C][C]0.413755[/C][/ROW]
[ROW][C]41[/C][C]0.075518[/C][C]0.6408[/C][C]0.261847[/C][/ROW]
[ROW][C]42[/C][C]-0.011093[/C][C]-0.0941[/C][C]0.462634[/C][/ROW]
[ROW][C]43[/C][C]0.046747[/C][C]0.3967[/C][C]0.346396[/C][/ROW]
[ROW][C]44[/C][C]-0.031969[/C][C]-0.2713[/C][C]0.393482[/C][/ROW]
[ROW][C]45[/C][C]0.019739[/C][C]0.1675[/C][C]0.433726[/C][/ROW]
[ROW][C]46[/C][C]-0.076289[/C][C]-0.6473[/C][C]0.259738[/C][/ROW]
[ROW][C]47[/C][C]-0.00446[/C][C]-0.0378[/C][C]0.484959[/C][/ROW]
[ROW][C]48[/C][C]-0.06724[/C][C]-0.5706[/C][C]0.28504[/C][/ROW]
[/TABLE]
Source: https://freestatistics.org/blog/index.php?pk=243463&T=2

Globally Unique Identifier (entire table): ba.freestatistics.org/blog/index.php?pk=243463&T=2

As an alternative you can also use a QR Code:  

The GUIDs for individual cells are displayed in the table below:

Partial Autocorrelation Function
Time lag kPACF(k)T-STATP-value
10.7257196.15790
2-0.540432-4.58579e-06
30.0896040.76030.224775
40.0495580.42050.337682
5-0.021055-0.17870.429354
6-0.130706-1.10910.135544
7-0.112631-0.95570.171209
8-0.035047-0.29740.383516
90.1520161.28990.100607
100.289412.45570.008237
110.3336792.83140.003003
120.0464740.39430.347247
13-0.629906-5.34491e-06
140.16871.43150.078311
15-0.113533-0.96340.169295
16-0.167105-1.41790.080263
17-0.175434-1.48860.070479
18-0.072135-0.61210.271205
19-0.051022-0.43290.333179
20-0.053696-0.45560.325014
21-0.018263-0.1550.438642
22-0.026077-0.22130.412753
23-0.035404-0.30040.382364
240.1417961.20320.116425
25-0.039631-0.33630.36882
260.0849170.72050.23676
270.0065470.05560.477925
28-0.010207-0.08660.46561
290.0008250.0070.497216
300.0798690.67770.250063
310.0521130.44220.329838
32-0.021316-0.18090.42849
330.0049070.04160.483451
34-0.055978-0.4750.318115
35-0.033516-0.28440.388464
36-0.041457-0.35180.363016
370.0764250.64850.259366
38-0.029854-0.25330.40037
390.0222310.18860.425454
400.0257730.21870.413755
410.0755180.64080.261847
42-0.011093-0.09410.462634
430.0467470.39670.346396
44-0.031969-0.27130.393482
450.0197390.16750.433726
46-0.076289-0.64730.259738
47-0.00446-0.03780.484959
48-0.06724-0.57060.28504


Parameters (Session):
par1 = 48 ; par2 = 1 ; par3 = 0 ; par4 = 0 ; par5 = 12 ; par6 = White Noise ; par7 = 0.95 ;
Parameters (R input):
par1 = 48 ; par2 = 1 ; par3 = 0 ; par4 = 0 ; par5 = 12 ; par6 = White Noise ; par7 = 0.95 ; par8 = ;
R code (references can be found in the software module):
if (par1 == 'Default') {
par1 = 10*log10(length(x))
} else {
par1 <- as.numeric(par1)
}
par2 <- as.numeric(par2)
par3 <- as.numeric(par3)
par4 <- as.numeric(par4)
par5 <- as.numeric(par5)
if (par6 == 'White Noise') par6 <- 'white' else par6 <- 'ma'
par7 <- as.numeric(par7)
if (par8 != '') par8 <- as.numeric(par8)
ox <- x
if (par8 == '') {
if (par2 == 0) {
x <- log(x)
} else {
x <- (x ^ par2 - 1) / par2
}
} else {
x <- log(x,base=par8)
}
if (par3 > 0) x <- diff(x,lag=1,difference=par3)
if (par4 > 0) x <- diff(x,lag=par5,difference=par4)
bitmap(file='picts.png')
op <- par(mfrow=c(2,1))
plot(ox,type='l',main='Original Time Series',xlab='time',ylab='value')
if (par8=='') {
mytitle <- paste('Working Time Series (lambda=',par2,', d=',par3,', D=',par4,')',sep='')
mysub <- paste('(lambda=',par2,', d=',par3,', D=',par4,', CI=', par7, ', CI type=',par6,')',sep='')
} else {
mytitle <- paste('Working Time Series (base=',par8,', d=',par3,', D=',par4,')',sep='')
mysub <- paste('(base=',par8,', d=',par3,', D=',par4,', CI=', par7, ', CI type=',par6,')',sep='')
}
plot(x,type='l', main=mytitle,xlab='time',ylab='value')
par(op)
dev.off()
bitmap(file='pic1.png')
racf <- acf(x, par1, main='Autocorrelation', xlab='time lag', ylab='ACF', ci.type=par6, ci=par7, sub=mysub)
dev.off()
bitmap(file='pic2.png')
rpacf <- pacf(x,par1,main='Partial Autocorrelation',xlab='lags',ylab='PACF',sub=mysub)
dev.off()
(myacf <- c(racf$acf))
(mypacf <- c(rpacf$acf))
lengthx <- length(x)
sqrtn <- sqrt(lengthx)
load(file='createtable')
a<-table.start()
a<-table.row.start(a)
a<-table.element(a,'Autocorrelation Function',4,TRUE)
a<-table.row.end(a)
a<-table.row.start(a)
a<-table.element(a,'Time lag k',header=TRUE)
a<-table.element(a,hyperlink('basics.htm','ACF(k)','click here for more information about the Autocorrelation Function'),header=TRUE)
a<-table.element(a,'T-STAT',header=TRUE)
a<-table.element(a,'P-value',header=TRUE)
a<-table.row.end(a)
for (i in 2:(par1+1)) {
a<-table.row.start(a)
a<-table.element(a,i-1,header=TRUE)
a<-table.element(a,round(myacf[i],6))
mytstat <- myacf[i]*sqrtn
a<-table.element(a,round(mytstat,4))
a<-table.element(a,round(1-pt(abs(mytstat),lengthx),6))
a<-table.row.end(a)
}
a<-table.end(a)
table.save(a,file='mytable.tab')
a<-table.start()
a<-table.row.start(a)
a<-table.element(a,'Partial Autocorrelation Function',4,TRUE)
a<-table.row.end(a)
a<-table.row.start(a)
a<-table.element(a,'Time lag k',header=TRUE)
a<-table.element(a,hyperlink('basics.htm','PACF(k)','click here for more information about the Partial Autocorrelation Function'),header=TRUE)
a<-table.element(a,'T-STAT',header=TRUE)
a<-table.element(a,'P-value',header=TRUE)
a<-table.row.end(a)
for (i in 1:par1) {
a<-table.row.start(a)
a<-table.element(a,i,header=TRUE)
a<-table.element(a,round(mypacf[i],6))
mytstat <- mypacf[i]*sqrtn
a<-table.element(a,round(mytstat,4))
a<-table.element(a,round(1-pt(abs(mytstat),lengthx),6))
a<-table.row.end(a)
}
a<-table.end(a)
table.save(a,file='mytable1.tab')