Free Statistics

of Irreproducible Research!

Author's title

Author*Unverified author*
R Software Modulerwasp_autocorrelation.wasp
Title produced by software(Partial) Autocorrelation Function
Date of computationSat, 18 Oct 2014 13:00:18 +0100
Cite this page as followsStatistical Computations at FreeStatistics.org, Office for Research Development and Education, URL https://freestatistics.org/blog/index.php?v=date/2014/Oct/18/t141363366100owse3kdtvxj7a.htm/, Retrieved Mon, 13 May 2024 03:05:16 +0000
Statistical Computations at FreeStatistics.org, Office for Research Development and Education, URL https://freestatistics.org/blog/index.php?pk=243458, Retrieved Mon, 13 May 2024 03:05:16 +0000
QR Codes:

Original text written by user:
IsPrivate?No (this computation is public)
User-defined keywords
Estimated Impact66
Family? (F = Feedback message, R = changed R code, M = changed R Module, P = changed Parameters, D = changed Data)
-       [(Partial) Autocorrelation Function] [] [2014-10-18 12:00:18] [7c1b641e1a752e372282648dcc4f5732] [Current]
Feedback Forum

Post a new message
Dataseries X:
111.2
116.7
125.8
131.5
146.2
155.4
157.5
137.2
121.3
89.1
69.6
56.7
58.5
56.4
60.5
64.6
73.2
84.6
80.4
88.4
84.6
90.8
94.9
93.1
96.6
93.1
98.3
105
95.6
94.3
95.3
97.1
98.1
104.4
107.8
114.3
118.7
124.1
134.2
142.4
133.8
131
133.2
125.9
126.2
122.7
126.6
124.8
128
134.1
138.8
134
124
110.4
116.7
124.7
126
122.8
120.2
121.2
125.4
127.9
122
117.5
117.9
117.9
122.7
125.7
126.1
123.2
120.6
123.5


Summary of computational transaction
Raw Inputview raw input (R code)
Raw Outputview raw output of R engine
Computing time11 seconds
R Server'Herman Ole Andreas Wold' @ wold.wessa.net

\begin{tabular}{lllllllll}
\hline
Summary of computational transaction \tabularnewline
Raw Input & view raw input (R code)  \tabularnewline
Raw Output & view raw output of R engine  \tabularnewline
Computing time & 11 seconds \tabularnewline
R Server & 'Herman Ole Andreas Wold' @ wold.wessa.net \tabularnewline
\hline
\end{tabular}
%Source: https://freestatistics.org/blog/index.php?pk=243458&T=0

[TABLE]
[ROW][C]Summary of computational transaction[/C][/ROW]
[ROW][C]Raw Input[/C][C]view raw input (R code) [/C][/ROW]
[ROW][C]Raw Output[/C][C]view raw output of R engine [/C][/ROW]
[ROW][C]Computing time[/C][C]11 seconds[/C][/ROW]
[ROW][C]R Server[/C][C]'Herman Ole Andreas Wold' @ wold.wessa.net[/C][/ROW]
[/TABLE]
Source: https://freestatistics.org/blog/index.php?pk=243458&T=0

Globally Unique Identifier (entire table): ba.freestatistics.org/blog/index.php?pk=243458&T=0

As an alternative you can also use a QR Code:  

The GUIDs for individual cells are displayed in the table below:

Summary of computational transaction
Raw Inputview raw input (R code)
Raw Outputview raw output of R engine
Computing time11 seconds
R Server'Herman Ole Andreas Wold' @ wold.wessa.net


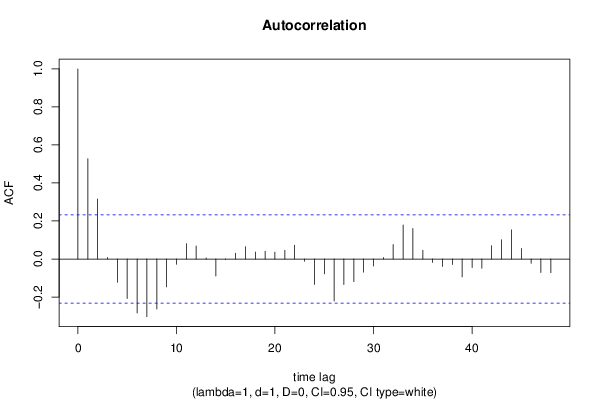
Autocorrelation Function
Time lag kACF(k)T-STATP-value
10.5275534.44521.6e-05
20.3154552.65810.004852
30.0083890.07070.471922
4-0.121956-1.02760.153808
5-0.207534-1.74870.042331
6-0.284544-2.39760.009568
7-0.303317-2.55580.006368
8-0.262912-2.21530.014973
9-0.146767-1.23670.110141
10-0.027695-0.23340.408076
110.0810620.6830.248402
120.0681780.57450.283731
130.0057530.04850.480738
14-0.089267-0.75220.227215
15-0.002371-0.020.492058
160.0299460.25230.400759
170.0648690.54660.293185
180.0372730.31410.377196
190.0412150.34730.364703
200.0361540.30460.380767
210.0460540.38810.349568
220.0723560.60970.272009
23-0.012152-0.10240.459365
24-0.133771-1.12720.131732
25-0.07809-0.6580.256333
26-0.220627-1.8590.033583
27-0.134385-1.13230.130649
28-0.118983-1.00260.159736
29-0.06922-0.58330.280784
30-0.037001-0.31180.378062
310.0080460.06780.47307
320.0757690.63840.262621
330.179031.50850.067928
340.1605691.3530.090177
350.046370.39070.348587
36-0.018324-0.15440.438867
37-0.03953-0.33310.370027
38-0.029383-0.24760.402585
39-0.094274-0.79440.214813
40-0.044612-0.37590.354052
41-0.048857-0.41170.340908
420.069440.58510.280164
430.1011220.85210.19852
440.1533721.29230.100216
450.0556840.46920.320182
46-0.022349-0.18830.425582
47-0.070681-0.59560.27668
48-0.071713-0.60430.273797

\begin{tabular}{lllllllll}
\hline
Autocorrelation Function \tabularnewline
Time lag k & ACF(k) & T-STAT & P-value \tabularnewline
1 & 0.527553 & 4.4452 & 1.6e-05 \tabularnewline
2 & 0.315455 & 2.6581 & 0.004852 \tabularnewline
3 & 0.008389 & 0.0707 & 0.471922 \tabularnewline
4 & -0.121956 & -1.0276 & 0.153808 \tabularnewline
5 & -0.207534 & -1.7487 & 0.042331 \tabularnewline
6 & -0.284544 & -2.3976 & 0.009568 \tabularnewline
7 & -0.303317 & -2.5558 & 0.006368 \tabularnewline
8 & -0.262912 & -2.2153 & 0.014973 \tabularnewline
9 & -0.146767 & -1.2367 & 0.110141 \tabularnewline
10 & -0.027695 & -0.2334 & 0.408076 \tabularnewline
11 & 0.081062 & 0.683 & 0.248402 \tabularnewline
12 & 0.068178 & 0.5745 & 0.283731 \tabularnewline
13 & 0.005753 & 0.0485 & 0.480738 \tabularnewline
14 & -0.089267 & -0.7522 & 0.227215 \tabularnewline
15 & -0.002371 & -0.02 & 0.492058 \tabularnewline
16 & 0.029946 & 0.2523 & 0.400759 \tabularnewline
17 & 0.064869 & 0.5466 & 0.293185 \tabularnewline
18 & 0.037273 & 0.3141 & 0.377196 \tabularnewline
19 & 0.041215 & 0.3473 & 0.364703 \tabularnewline
20 & 0.036154 & 0.3046 & 0.380767 \tabularnewline
21 & 0.046054 & 0.3881 & 0.349568 \tabularnewline
22 & 0.072356 & 0.6097 & 0.272009 \tabularnewline
23 & -0.012152 & -0.1024 & 0.459365 \tabularnewline
24 & -0.133771 & -1.1272 & 0.131732 \tabularnewline
25 & -0.07809 & -0.658 & 0.256333 \tabularnewline
26 & -0.220627 & -1.859 & 0.033583 \tabularnewline
27 & -0.134385 & -1.1323 & 0.130649 \tabularnewline
28 & -0.118983 & -1.0026 & 0.159736 \tabularnewline
29 & -0.06922 & -0.5833 & 0.280784 \tabularnewline
30 & -0.037001 & -0.3118 & 0.378062 \tabularnewline
31 & 0.008046 & 0.0678 & 0.47307 \tabularnewline
32 & 0.075769 & 0.6384 & 0.262621 \tabularnewline
33 & 0.17903 & 1.5085 & 0.067928 \tabularnewline
34 & 0.160569 & 1.353 & 0.090177 \tabularnewline
35 & 0.04637 & 0.3907 & 0.348587 \tabularnewline
36 & -0.018324 & -0.1544 & 0.438867 \tabularnewline
37 & -0.03953 & -0.3331 & 0.370027 \tabularnewline
38 & -0.029383 & -0.2476 & 0.402585 \tabularnewline
39 & -0.094274 & -0.7944 & 0.214813 \tabularnewline
40 & -0.044612 & -0.3759 & 0.354052 \tabularnewline
41 & -0.048857 & -0.4117 & 0.340908 \tabularnewline
42 & 0.06944 & 0.5851 & 0.280164 \tabularnewline
43 & 0.101122 & 0.8521 & 0.19852 \tabularnewline
44 & 0.153372 & 1.2923 & 0.100216 \tabularnewline
45 & 0.055684 & 0.4692 & 0.320182 \tabularnewline
46 & -0.022349 & -0.1883 & 0.425582 \tabularnewline
47 & -0.070681 & -0.5956 & 0.27668 \tabularnewline
48 & -0.071713 & -0.6043 & 0.273797 \tabularnewline
\hline
\end{tabular}
%Source: https://freestatistics.org/blog/index.php?pk=243458&T=1

[TABLE]
[ROW][C]Autocorrelation Function[/C][/ROW]
[ROW][C]Time lag k[/C][C]ACF(k)[/C][C]T-STAT[/C][C]P-value[/C][/ROW]
[ROW][C]1[/C][C]0.527553[/C][C]4.4452[/C][C]1.6e-05[/C][/ROW]
[ROW][C]2[/C][C]0.315455[/C][C]2.6581[/C][C]0.004852[/C][/ROW]
[ROW][C]3[/C][C]0.008389[/C][C]0.0707[/C][C]0.471922[/C][/ROW]
[ROW][C]4[/C][C]-0.121956[/C][C]-1.0276[/C][C]0.153808[/C][/ROW]
[ROW][C]5[/C][C]-0.207534[/C][C]-1.7487[/C][C]0.042331[/C][/ROW]
[ROW][C]6[/C][C]-0.284544[/C][C]-2.3976[/C][C]0.009568[/C][/ROW]
[ROW][C]7[/C][C]-0.303317[/C][C]-2.5558[/C][C]0.006368[/C][/ROW]
[ROW][C]8[/C][C]-0.262912[/C][C]-2.2153[/C][C]0.014973[/C][/ROW]
[ROW][C]9[/C][C]-0.146767[/C][C]-1.2367[/C][C]0.110141[/C][/ROW]
[ROW][C]10[/C][C]-0.027695[/C][C]-0.2334[/C][C]0.408076[/C][/ROW]
[ROW][C]11[/C][C]0.081062[/C][C]0.683[/C][C]0.248402[/C][/ROW]
[ROW][C]12[/C][C]0.068178[/C][C]0.5745[/C][C]0.283731[/C][/ROW]
[ROW][C]13[/C][C]0.005753[/C][C]0.0485[/C][C]0.480738[/C][/ROW]
[ROW][C]14[/C][C]-0.089267[/C][C]-0.7522[/C][C]0.227215[/C][/ROW]
[ROW][C]15[/C][C]-0.002371[/C][C]-0.02[/C][C]0.492058[/C][/ROW]
[ROW][C]16[/C][C]0.029946[/C][C]0.2523[/C][C]0.400759[/C][/ROW]
[ROW][C]17[/C][C]0.064869[/C][C]0.5466[/C][C]0.293185[/C][/ROW]
[ROW][C]18[/C][C]0.037273[/C][C]0.3141[/C][C]0.377196[/C][/ROW]
[ROW][C]19[/C][C]0.041215[/C][C]0.3473[/C][C]0.364703[/C][/ROW]
[ROW][C]20[/C][C]0.036154[/C][C]0.3046[/C][C]0.380767[/C][/ROW]
[ROW][C]21[/C][C]0.046054[/C][C]0.3881[/C][C]0.349568[/C][/ROW]
[ROW][C]22[/C][C]0.072356[/C][C]0.6097[/C][C]0.272009[/C][/ROW]
[ROW][C]23[/C][C]-0.012152[/C][C]-0.1024[/C][C]0.459365[/C][/ROW]
[ROW][C]24[/C][C]-0.133771[/C][C]-1.1272[/C][C]0.131732[/C][/ROW]
[ROW][C]25[/C][C]-0.07809[/C][C]-0.658[/C][C]0.256333[/C][/ROW]
[ROW][C]26[/C][C]-0.220627[/C][C]-1.859[/C][C]0.033583[/C][/ROW]
[ROW][C]27[/C][C]-0.134385[/C][C]-1.1323[/C][C]0.130649[/C][/ROW]
[ROW][C]28[/C][C]-0.118983[/C][C]-1.0026[/C][C]0.159736[/C][/ROW]
[ROW][C]29[/C][C]-0.06922[/C][C]-0.5833[/C][C]0.280784[/C][/ROW]
[ROW][C]30[/C][C]-0.037001[/C][C]-0.3118[/C][C]0.378062[/C][/ROW]
[ROW][C]31[/C][C]0.008046[/C][C]0.0678[/C][C]0.47307[/C][/ROW]
[ROW][C]32[/C][C]0.075769[/C][C]0.6384[/C][C]0.262621[/C][/ROW]
[ROW][C]33[/C][C]0.17903[/C][C]1.5085[/C][C]0.067928[/C][/ROW]
[ROW][C]34[/C][C]0.160569[/C][C]1.353[/C][C]0.090177[/C][/ROW]
[ROW][C]35[/C][C]0.04637[/C][C]0.3907[/C][C]0.348587[/C][/ROW]
[ROW][C]36[/C][C]-0.018324[/C][C]-0.1544[/C][C]0.438867[/C][/ROW]
[ROW][C]37[/C][C]-0.03953[/C][C]-0.3331[/C][C]0.370027[/C][/ROW]
[ROW][C]38[/C][C]-0.029383[/C][C]-0.2476[/C][C]0.402585[/C][/ROW]
[ROW][C]39[/C][C]-0.094274[/C][C]-0.7944[/C][C]0.214813[/C][/ROW]
[ROW][C]40[/C][C]-0.044612[/C][C]-0.3759[/C][C]0.354052[/C][/ROW]
[ROW][C]41[/C][C]-0.048857[/C][C]-0.4117[/C][C]0.340908[/C][/ROW]
[ROW][C]42[/C][C]0.06944[/C][C]0.5851[/C][C]0.280164[/C][/ROW]
[ROW][C]43[/C][C]0.101122[/C][C]0.8521[/C][C]0.19852[/C][/ROW]
[ROW][C]44[/C][C]0.153372[/C][C]1.2923[/C][C]0.100216[/C][/ROW]
[ROW][C]45[/C][C]0.055684[/C][C]0.4692[/C][C]0.320182[/C][/ROW]
[ROW][C]46[/C][C]-0.022349[/C][C]-0.1883[/C][C]0.425582[/C][/ROW]
[ROW][C]47[/C][C]-0.070681[/C][C]-0.5956[/C][C]0.27668[/C][/ROW]
[ROW][C]48[/C][C]-0.071713[/C][C]-0.6043[/C][C]0.273797[/C][/ROW]
[/TABLE]
Source: https://freestatistics.org/blog/index.php?pk=243458&T=1

Globally Unique Identifier (entire table): ba.freestatistics.org/blog/index.php?pk=243458&T=1

As an alternative you can also use a QR Code:  

The GUIDs for individual cells are displayed in the table below:

Autocorrelation Function
Time lag kACF(k)T-STATP-value
10.5275534.44521.6e-05
20.3154552.65810.004852
30.0083890.07070.471922
4-0.121956-1.02760.153808
5-0.207534-1.74870.042331
6-0.284544-2.39760.009568
7-0.303317-2.55580.006368
8-0.262912-2.21530.014973
9-0.146767-1.23670.110141
10-0.027695-0.23340.408076
110.0810620.6830.248402
120.0681780.57450.283731
130.0057530.04850.480738
14-0.089267-0.75220.227215
15-0.002371-0.020.492058
160.0299460.25230.400759
170.0648690.54660.293185
180.0372730.31410.377196
190.0412150.34730.364703
200.0361540.30460.380767
210.0460540.38810.349568
220.0723560.60970.272009
23-0.012152-0.10240.459365
24-0.133771-1.12720.131732
25-0.07809-0.6580.256333
26-0.220627-1.8590.033583
27-0.134385-1.13230.130649
28-0.118983-1.00260.159736
29-0.06922-0.58330.280784
30-0.037001-0.31180.378062
310.0080460.06780.47307
320.0757690.63840.262621
330.179031.50850.067928
340.1605691.3530.090177
350.046370.39070.348587
36-0.018324-0.15440.438867
37-0.03953-0.33310.370027
38-0.029383-0.24760.402585
39-0.094274-0.79440.214813
40-0.044612-0.37590.354052
41-0.048857-0.41170.340908
420.069440.58510.280164
430.1011220.85210.19852
440.1533721.29230.100216
450.0556840.46920.320182
46-0.022349-0.18830.425582
47-0.070681-0.59560.27668
48-0.071713-0.60430.273797


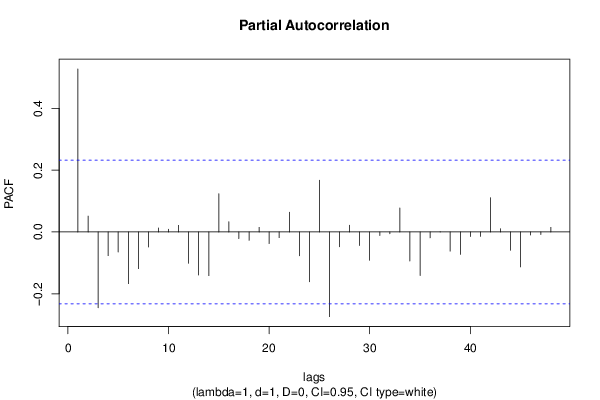
Partial Autocorrelation Function
Time lag kPACF(k)T-STATP-value
10.5275534.44521.6e-05
20.0514670.43370.332923
3-0.245377-2.06760.021163
4-0.076548-0.6450.2605
5-0.064584-0.54420.294006
6-0.167195-1.40880.081628
7-0.118678-10.160353
8-0.048543-0.4090.341875
90.0129430.10910.456731
100.008930.07520.470116
110.0214690.18090.428479
12-0.100931-0.85050.198964
13-0.139006-1.17130.122701
14-0.141334-1.19090.118829
150.123791.04310.150227
160.0331170.2790.390509
17-0.021405-0.18040.428692
18-0.027074-0.22810.410102
190.0149440.12590.450074
20-0.037577-0.31660.376227
21-0.018202-0.15340.439268
220.0636630.53640.296668
23-0.07666-0.64590.260199
24-0.160847-1.35530.089806
250.1672671.40940.081538
26-0.273955-2.30840.011947
27-0.047752-0.40240.344311
280.0219480.18490.426904
29-0.043754-0.36870.356731
30-0.091262-0.7690.222225
31-0.011144-0.09390.462726
32-0.005989-0.05050.479947
330.0778040.65560.257103
34-0.093846-0.79080.215858
35-0.140629-1.1850.119992
36-0.018987-0.160.436673
370.0008930.00750.49701
38-0.061942-0.52190.301672
39-0.072354-0.60970.272014
40-0.014813-0.12480.450512
41-0.014199-0.11960.452551
420.1106660.93250.177123
430.0103920.08760.465234
44-0.059013-0.49720.310275
45-0.112978-0.9520.172172
46-0.009959-0.08390.466678
47-0.008244-0.06950.472407
480.0149660.12610.450003

\begin{tabular}{lllllllll}
\hline
Partial Autocorrelation Function \tabularnewline
Time lag k & PACF(k) & T-STAT & P-value \tabularnewline
1 & 0.527553 & 4.4452 & 1.6e-05 \tabularnewline
2 & 0.051467 & 0.4337 & 0.332923 \tabularnewline
3 & -0.245377 & -2.0676 & 0.021163 \tabularnewline
4 & -0.076548 & -0.645 & 0.2605 \tabularnewline
5 & -0.064584 & -0.5442 & 0.294006 \tabularnewline
6 & -0.167195 & -1.4088 & 0.081628 \tabularnewline
7 & -0.118678 & -1 & 0.160353 \tabularnewline
8 & -0.048543 & -0.409 & 0.341875 \tabularnewline
9 & 0.012943 & 0.1091 & 0.456731 \tabularnewline
10 & 0.00893 & 0.0752 & 0.470116 \tabularnewline
11 & 0.021469 & 0.1809 & 0.428479 \tabularnewline
12 & -0.100931 & -0.8505 & 0.198964 \tabularnewline
13 & -0.139006 & -1.1713 & 0.122701 \tabularnewline
14 & -0.141334 & -1.1909 & 0.118829 \tabularnewline
15 & 0.12379 & 1.0431 & 0.150227 \tabularnewline
16 & 0.033117 & 0.279 & 0.390509 \tabularnewline
17 & -0.021405 & -0.1804 & 0.428692 \tabularnewline
18 & -0.027074 & -0.2281 & 0.410102 \tabularnewline
19 & 0.014944 & 0.1259 & 0.450074 \tabularnewline
20 & -0.037577 & -0.3166 & 0.376227 \tabularnewline
21 & -0.018202 & -0.1534 & 0.439268 \tabularnewline
22 & 0.063663 & 0.5364 & 0.296668 \tabularnewline
23 & -0.07666 & -0.6459 & 0.260199 \tabularnewline
24 & -0.160847 & -1.3553 & 0.089806 \tabularnewline
25 & 0.167267 & 1.4094 & 0.081538 \tabularnewline
26 & -0.273955 & -2.3084 & 0.011947 \tabularnewline
27 & -0.047752 & -0.4024 & 0.344311 \tabularnewline
28 & 0.021948 & 0.1849 & 0.426904 \tabularnewline
29 & -0.043754 & -0.3687 & 0.356731 \tabularnewline
30 & -0.091262 & -0.769 & 0.222225 \tabularnewline
31 & -0.011144 & -0.0939 & 0.462726 \tabularnewline
32 & -0.005989 & -0.0505 & 0.479947 \tabularnewline
33 & 0.077804 & 0.6556 & 0.257103 \tabularnewline
34 & -0.093846 & -0.7908 & 0.215858 \tabularnewline
35 & -0.140629 & -1.185 & 0.119992 \tabularnewline
36 & -0.018987 & -0.16 & 0.436673 \tabularnewline
37 & 0.000893 & 0.0075 & 0.49701 \tabularnewline
38 & -0.061942 & -0.5219 & 0.301672 \tabularnewline
39 & -0.072354 & -0.6097 & 0.272014 \tabularnewline
40 & -0.014813 & -0.1248 & 0.450512 \tabularnewline
41 & -0.014199 & -0.1196 & 0.452551 \tabularnewline
42 & 0.110666 & 0.9325 & 0.177123 \tabularnewline
43 & 0.010392 & 0.0876 & 0.465234 \tabularnewline
44 & -0.059013 & -0.4972 & 0.310275 \tabularnewline
45 & -0.112978 & -0.952 & 0.172172 \tabularnewline
46 & -0.009959 & -0.0839 & 0.466678 \tabularnewline
47 & -0.008244 & -0.0695 & 0.472407 \tabularnewline
48 & 0.014966 & 0.1261 & 0.450003 \tabularnewline
\hline
\end{tabular}
%Source: https://freestatistics.org/blog/index.php?pk=243458&T=2

[TABLE]
[ROW][C]Partial Autocorrelation Function[/C][/ROW]
[ROW][C]Time lag k[/C][C]PACF(k)[/C][C]T-STAT[/C][C]P-value[/C][/ROW]
[ROW][C]1[/C][C]0.527553[/C][C]4.4452[/C][C]1.6e-05[/C][/ROW]
[ROW][C]2[/C][C]0.051467[/C][C]0.4337[/C][C]0.332923[/C][/ROW]
[ROW][C]3[/C][C]-0.245377[/C][C]-2.0676[/C][C]0.021163[/C][/ROW]
[ROW][C]4[/C][C]-0.076548[/C][C]-0.645[/C][C]0.2605[/C][/ROW]
[ROW][C]5[/C][C]-0.064584[/C][C]-0.5442[/C][C]0.294006[/C][/ROW]
[ROW][C]6[/C][C]-0.167195[/C][C]-1.4088[/C][C]0.081628[/C][/ROW]
[ROW][C]7[/C][C]-0.118678[/C][C]-1[/C][C]0.160353[/C][/ROW]
[ROW][C]8[/C][C]-0.048543[/C][C]-0.409[/C][C]0.341875[/C][/ROW]
[ROW][C]9[/C][C]0.012943[/C][C]0.1091[/C][C]0.456731[/C][/ROW]
[ROW][C]10[/C][C]0.00893[/C][C]0.0752[/C][C]0.470116[/C][/ROW]
[ROW][C]11[/C][C]0.021469[/C][C]0.1809[/C][C]0.428479[/C][/ROW]
[ROW][C]12[/C][C]-0.100931[/C][C]-0.8505[/C][C]0.198964[/C][/ROW]
[ROW][C]13[/C][C]-0.139006[/C][C]-1.1713[/C][C]0.122701[/C][/ROW]
[ROW][C]14[/C][C]-0.141334[/C][C]-1.1909[/C][C]0.118829[/C][/ROW]
[ROW][C]15[/C][C]0.12379[/C][C]1.0431[/C][C]0.150227[/C][/ROW]
[ROW][C]16[/C][C]0.033117[/C][C]0.279[/C][C]0.390509[/C][/ROW]
[ROW][C]17[/C][C]-0.021405[/C][C]-0.1804[/C][C]0.428692[/C][/ROW]
[ROW][C]18[/C][C]-0.027074[/C][C]-0.2281[/C][C]0.410102[/C][/ROW]
[ROW][C]19[/C][C]0.014944[/C][C]0.1259[/C][C]0.450074[/C][/ROW]
[ROW][C]20[/C][C]-0.037577[/C][C]-0.3166[/C][C]0.376227[/C][/ROW]
[ROW][C]21[/C][C]-0.018202[/C][C]-0.1534[/C][C]0.439268[/C][/ROW]
[ROW][C]22[/C][C]0.063663[/C][C]0.5364[/C][C]0.296668[/C][/ROW]
[ROW][C]23[/C][C]-0.07666[/C][C]-0.6459[/C][C]0.260199[/C][/ROW]
[ROW][C]24[/C][C]-0.160847[/C][C]-1.3553[/C][C]0.089806[/C][/ROW]
[ROW][C]25[/C][C]0.167267[/C][C]1.4094[/C][C]0.081538[/C][/ROW]
[ROW][C]26[/C][C]-0.273955[/C][C]-2.3084[/C][C]0.011947[/C][/ROW]
[ROW][C]27[/C][C]-0.047752[/C][C]-0.4024[/C][C]0.344311[/C][/ROW]
[ROW][C]28[/C][C]0.021948[/C][C]0.1849[/C][C]0.426904[/C][/ROW]
[ROW][C]29[/C][C]-0.043754[/C][C]-0.3687[/C][C]0.356731[/C][/ROW]
[ROW][C]30[/C][C]-0.091262[/C][C]-0.769[/C][C]0.222225[/C][/ROW]
[ROW][C]31[/C][C]-0.011144[/C][C]-0.0939[/C][C]0.462726[/C][/ROW]
[ROW][C]32[/C][C]-0.005989[/C][C]-0.0505[/C][C]0.479947[/C][/ROW]
[ROW][C]33[/C][C]0.077804[/C][C]0.6556[/C][C]0.257103[/C][/ROW]
[ROW][C]34[/C][C]-0.093846[/C][C]-0.7908[/C][C]0.215858[/C][/ROW]
[ROW][C]35[/C][C]-0.140629[/C][C]-1.185[/C][C]0.119992[/C][/ROW]
[ROW][C]36[/C][C]-0.018987[/C][C]-0.16[/C][C]0.436673[/C][/ROW]
[ROW][C]37[/C][C]0.000893[/C][C]0.0075[/C][C]0.49701[/C][/ROW]
[ROW][C]38[/C][C]-0.061942[/C][C]-0.5219[/C][C]0.301672[/C][/ROW]
[ROW][C]39[/C][C]-0.072354[/C][C]-0.6097[/C][C]0.272014[/C][/ROW]
[ROW][C]40[/C][C]-0.014813[/C][C]-0.1248[/C][C]0.450512[/C][/ROW]
[ROW][C]41[/C][C]-0.014199[/C][C]-0.1196[/C][C]0.452551[/C][/ROW]
[ROW][C]42[/C][C]0.110666[/C][C]0.9325[/C][C]0.177123[/C][/ROW]
[ROW][C]43[/C][C]0.010392[/C][C]0.0876[/C][C]0.465234[/C][/ROW]
[ROW][C]44[/C][C]-0.059013[/C][C]-0.4972[/C][C]0.310275[/C][/ROW]
[ROW][C]45[/C][C]-0.112978[/C][C]-0.952[/C][C]0.172172[/C][/ROW]
[ROW][C]46[/C][C]-0.009959[/C][C]-0.0839[/C][C]0.466678[/C][/ROW]
[ROW][C]47[/C][C]-0.008244[/C][C]-0.0695[/C][C]0.472407[/C][/ROW]
[ROW][C]48[/C][C]0.014966[/C][C]0.1261[/C][C]0.450003[/C][/ROW]
[/TABLE]
Source: https://freestatistics.org/blog/index.php?pk=243458&T=2

Globally Unique Identifier (entire table): ba.freestatistics.org/blog/index.php?pk=243458&T=2

As an alternative you can also use a QR Code:  

The GUIDs for individual cells are displayed in the table below:

Partial Autocorrelation Function
Time lag kPACF(k)T-STATP-value
10.5275534.44521.6e-05
20.0514670.43370.332923
3-0.245377-2.06760.021163
4-0.076548-0.6450.2605
5-0.064584-0.54420.294006
6-0.167195-1.40880.081628
7-0.118678-10.160353
8-0.048543-0.4090.341875
90.0129430.10910.456731
100.008930.07520.470116
110.0214690.18090.428479
12-0.100931-0.85050.198964
13-0.139006-1.17130.122701
14-0.141334-1.19090.118829
150.123791.04310.150227
160.0331170.2790.390509
17-0.021405-0.18040.428692
18-0.027074-0.22810.410102
190.0149440.12590.450074
20-0.037577-0.31660.376227
21-0.018202-0.15340.439268
220.0636630.53640.296668
23-0.07666-0.64590.260199
24-0.160847-1.35530.089806
250.1672671.40940.081538
26-0.273955-2.30840.011947
27-0.047752-0.40240.344311
280.0219480.18490.426904
29-0.043754-0.36870.356731
30-0.091262-0.7690.222225
31-0.011144-0.09390.462726
32-0.005989-0.05050.479947
330.0778040.65560.257103
34-0.093846-0.79080.215858
35-0.140629-1.1850.119992
36-0.018987-0.160.436673
370.0008930.00750.49701
38-0.061942-0.52190.301672
39-0.072354-0.60970.272014
40-0.014813-0.12480.450512
41-0.014199-0.11960.452551
420.1106660.93250.177123
430.0103920.08760.465234
44-0.059013-0.49720.310275
45-0.112978-0.9520.172172
46-0.009959-0.08390.466678
47-0.008244-0.06950.472407
480.0149660.12610.450003


Parameters (Session):
par1 = 48 ; par2 = 1 ; par3 = 1 ; par4 = 0 ; par5 = 12 ; par6 = White Noise ; par7 = 0.95 ;
Parameters (R input):
par1 = 48 ; par2 = 1 ; par3 = 1 ; par4 = 0 ; par5 = 12 ; par6 = White Noise ; par7 = 0.95 ; par8 = ;
R code (references can be found in the software module):
if (par1 == 'Default') {
par1 = 10*log10(length(x))
} else {
par1 <- as.numeric(par1)
}
par2 <- as.numeric(par2)
par3 <- as.numeric(par3)
par4 <- as.numeric(par4)
par5 <- as.numeric(par5)
if (par6 == 'White Noise') par6 <- 'white' else par6 <- 'ma'
par7 <- as.numeric(par7)
if (par8 != '') par8 <- as.numeric(par8)
ox <- x
if (par8 == '') {
if (par2 == 0) {
x <- log(x)
} else {
x <- (x ^ par2 - 1) / par2
}
} else {
x <- log(x,base=par8)
}
if (par3 > 0) x <- diff(x,lag=1,difference=par3)
if (par4 > 0) x <- diff(x,lag=par5,difference=par4)
bitmap(file='picts.png')
op <- par(mfrow=c(2,1))
plot(ox,type='l',main='Original Time Series',xlab='time',ylab='value')
if (par8=='') {
mytitle <- paste('Working Time Series (lambda=',par2,', d=',par3,', D=',par4,')',sep='')
mysub <- paste('(lambda=',par2,', d=',par3,', D=',par4,', CI=', par7, ', CI type=',par6,')',sep='')
} else {
mytitle <- paste('Working Time Series (base=',par8,', d=',par3,', D=',par4,')',sep='')
mysub <- paste('(base=',par8,', d=',par3,', D=',par4,', CI=', par7, ', CI type=',par6,')',sep='')
}
plot(x,type='l', main=mytitle,xlab='time',ylab='value')
par(op)
dev.off()
bitmap(file='pic1.png')
racf <- acf(x, par1, main='Autocorrelation', xlab='time lag', ylab='ACF', ci.type=par6, ci=par7, sub=mysub)
dev.off()
bitmap(file='pic2.png')
rpacf <- pacf(x,par1,main='Partial Autocorrelation',xlab='lags',ylab='PACF',sub=mysub)
dev.off()
(myacf <- c(racf$acf))
(mypacf <- c(rpacf$acf))
lengthx <- length(x)
sqrtn <- sqrt(lengthx)
load(file='createtable')
a<-table.start()
a<-table.row.start(a)
a<-table.element(a,'Autocorrelation Function',4,TRUE)
a<-table.row.end(a)
a<-table.row.start(a)
a<-table.element(a,'Time lag k',header=TRUE)
a<-table.element(a,hyperlink('basics.htm','ACF(k)','click here for more information about the Autocorrelation Function'),header=TRUE)
a<-table.element(a,'T-STAT',header=TRUE)
a<-table.element(a,'P-value',header=TRUE)
a<-table.row.end(a)
for (i in 2:(par1+1)) {
a<-table.row.start(a)
a<-table.element(a,i-1,header=TRUE)
a<-table.element(a,round(myacf[i],6))
mytstat <- myacf[i]*sqrtn
a<-table.element(a,round(mytstat,4))
a<-table.element(a,round(1-pt(abs(mytstat),lengthx),6))
a<-table.row.end(a)
}
a<-table.end(a)
table.save(a,file='mytable.tab')
a<-table.start()
a<-table.row.start(a)
a<-table.element(a,'Partial Autocorrelation Function',4,TRUE)
a<-table.row.end(a)
a<-table.row.start(a)
a<-table.element(a,'Time lag k',header=TRUE)
a<-table.element(a,hyperlink('basics.htm','PACF(k)','click here for more information about the Partial Autocorrelation Function'),header=TRUE)
a<-table.element(a,'T-STAT',header=TRUE)
a<-table.element(a,'P-value',header=TRUE)
a<-table.row.end(a)
for (i in 1:par1) {
a<-table.row.start(a)
a<-table.element(a,i,header=TRUE)
a<-table.element(a,round(mypacf[i],6))
mytstat <- mypacf[i]*sqrtn
a<-table.element(a,round(mytstat,4))
a<-table.element(a,round(1-pt(abs(mytstat),lengthx),6))
a<-table.row.end(a)
}
a<-table.end(a)
table.save(a,file='mytable1.tab')