Free Statistics

of Irreproducible Research!

Author's title

Author*Unverified author*
R Software Modulerwasp_autocorrelation.wasp
Title produced by software(Partial) Autocorrelation Function
Date of computationSat, 18 Oct 2014 12:50:52 +0100
Cite this page as followsStatistical Computations at FreeStatistics.org, Office for Research Development and Education, URL https://freestatistics.org/blog/index.php?v=date/2014/Oct/18/t1413633090u3fr0vphnacq0i7.htm/, Retrieved Sun, 12 May 2024 12:45:31 +0000
Statistical Computations at FreeStatistics.org, Office for Research Development and Education, URL https://freestatistics.org/blog/index.php?pk=243451, Retrieved Sun, 12 May 2024 12:45:31 +0000
QR Codes:

Original text written by user:
IsPrivate?No (this computation is public)
User-defined keywords
Estimated Impact77
Family? (F = Feedback message, R = changed R code, M = changed R Module, P = changed Parameters, D = changed Data)
-       [(Partial) Autocorrelation Function] [] [2014-10-18 11:50:52] [7c1b641e1a752e372282648dcc4f5732] [Current]
Feedback Forum

Post a new message
Dataseries X:
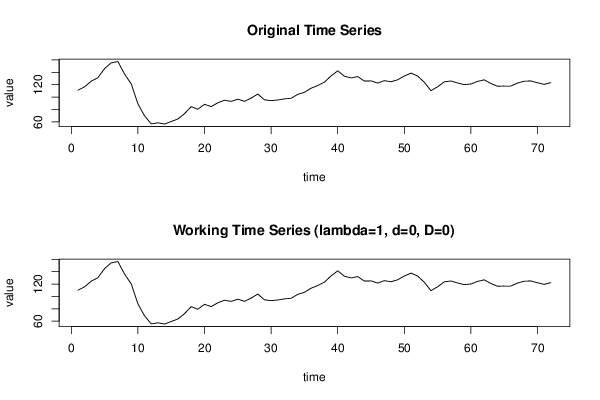
111.2
116.7
125.8
131.5
146.2
155.4
157.5
137.2
121.3
89.1
69.6
56.7
58.5
56.4
60.5
64.6
73.2
84.6
80.4
88.4
84.6
90.8
94.9
93.1
96.6
93.1
98.3
105
95.6
94.3
95.3
97.1
98.1
104.4
107.8
114.3
118.7
124.1
134.2
142.4
133.8
131
133.2
125.9
126.2
122.7
126.6
124.8
128
134.1
138.8
134
124
110.4
116.7
124.7
126
122.8
120.2
121.2
125.4
127.9
122
117.5
117.9
117.9
122.7
125.7
126.1
123.2
120.6
123.5


Summary of computational transaction
Raw Inputview raw input (R code)
Raw Outputview raw output of R engine
Computing time1 seconds
R Server'Herman Ole Andreas Wold' @ wold.wessa.net

\begin{tabular}{lllllllll}
\hline
Summary of computational transaction \tabularnewline
Raw Input & view raw input (R code)  \tabularnewline
Raw Output & view raw output of R engine  \tabularnewline
Computing time & 1 seconds \tabularnewline
R Server & 'Herman Ole Andreas Wold' @ wold.wessa.net \tabularnewline
\hline
\end{tabular}
%Source: https://freestatistics.org/blog/index.php?pk=243451&T=0

[TABLE]
[ROW][C]Summary of computational transaction[/C][/ROW]
[ROW][C]Raw Input[/C][C]view raw input (R code) [/C][/ROW]
[ROW][C]Raw Output[/C][C]view raw output of R engine [/C][/ROW]
[ROW][C]Computing time[/C][C]1 seconds[/C][/ROW]
[ROW][C]R Server[/C][C]'Herman Ole Andreas Wold' @ wold.wessa.net[/C][/ROW]
[/TABLE]
Source: https://freestatistics.org/blog/index.php?pk=243451&T=0

Globally Unique Identifier (entire table): ba.freestatistics.org/blog/index.php?pk=243451&T=0

As an alternative you can also use a QR Code:  

The GUIDs for individual cells are displayed in the table below:

Summary of computational transaction
Raw Inputview raw input (R code)
Raw Outputview raw output of R engine
Computing time1 seconds
R Server'Herman Ole Andreas Wold' @ wold.wessa.net


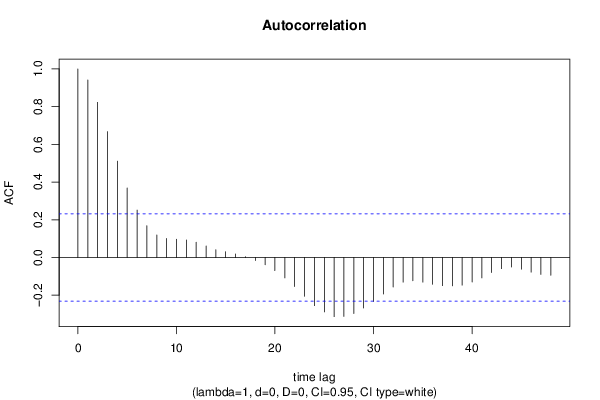
Autocorrelation Function
Time lag kACF(k)T-STATP-value
10.941037.98490
20.8226556.98050
30.6676025.66480
40.510864.33482.3e-05
50.3685823.12750.001272
60.251282.13220.018202
70.1681881.42710.078933
80.1194711.01370.157049
90.1006440.8540.197971
100.0964530.81840.207906
110.0929980.78910.216317
120.0804350.68250.248553
130.0610710.51820.302952
140.0410080.3480.364441
150.0301740.2560.399325
160.0184510.15660.438013
170.0036220.03070.487784
18-0.016164-0.13720.445647
19-0.038565-0.32720.372221
20-0.06976-0.59190.277874
21-0.108398-0.91980.180378
22-0.153847-1.30540.097951
23-0.206279-1.75030.04216
24-0.255709-2.16980.016663
25-0.288949-2.45180.00832
26-0.314033-2.66470.004753
27-0.31273-2.65360.004897
28-0.297075-2.52080.006963
29-0.268066-2.27460.012955
30-0.233544-1.98170.025667
31-0.194293-1.64860.05179
32-0.156953-1.33180.093565
33-0.131057-1.11210.134906
34-0.123227-1.04560.149618
35-0.130781-1.10970.135408
36-0.14194-1.20440.116189
37-0.149606-1.26940.104185
38-0.15065-1.27830.102624
39-0.147004-1.24740.108152
40-0.130351-1.10610.13619
41-0.108336-0.91930.180514
42-0.080121-0.67980.249391
43-0.059365-0.50370.307996
44-0.050615-0.42950.334428
45-0.062158-0.52740.299759
46-0.078067-0.66240.25491
47-0.089668-0.76090.224613
48-0.094175-0.79910.213429

\begin{tabular}{lllllllll}
\hline
Autocorrelation Function \tabularnewline
Time lag k & ACF(k) & T-STAT & P-value \tabularnewline
1 & 0.94103 & 7.9849 & 0 \tabularnewline
2 & 0.822655 & 6.9805 & 0 \tabularnewline
3 & 0.667602 & 5.6648 & 0 \tabularnewline
4 & 0.51086 & 4.3348 & 2.3e-05 \tabularnewline
5 & 0.368582 & 3.1275 & 0.001272 \tabularnewline
6 & 0.25128 & 2.1322 & 0.018202 \tabularnewline
7 & 0.168188 & 1.4271 & 0.078933 \tabularnewline
8 & 0.119471 & 1.0137 & 0.157049 \tabularnewline
9 & 0.100644 & 0.854 & 0.197971 \tabularnewline
10 & 0.096453 & 0.8184 & 0.207906 \tabularnewline
11 & 0.092998 & 0.7891 & 0.216317 \tabularnewline
12 & 0.080435 & 0.6825 & 0.248553 \tabularnewline
13 & 0.061071 & 0.5182 & 0.302952 \tabularnewline
14 & 0.041008 & 0.348 & 0.364441 \tabularnewline
15 & 0.030174 & 0.256 & 0.399325 \tabularnewline
16 & 0.018451 & 0.1566 & 0.438013 \tabularnewline
17 & 0.003622 & 0.0307 & 0.487784 \tabularnewline
18 & -0.016164 & -0.1372 & 0.445647 \tabularnewline
19 & -0.038565 & -0.3272 & 0.372221 \tabularnewline
20 & -0.06976 & -0.5919 & 0.277874 \tabularnewline
21 & -0.108398 & -0.9198 & 0.180378 \tabularnewline
22 & -0.153847 & -1.3054 & 0.097951 \tabularnewline
23 & -0.206279 & -1.7503 & 0.04216 \tabularnewline
24 & -0.255709 & -2.1698 & 0.016663 \tabularnewline
25 & -0.288949 & -2.4518 & 0.00832 \tabularnewline
26 & -0.314033 & -2.6647 & 0.004753 \tabularnewline
27 & -0.31273 & -2.6536 & 0.004897 \tabularnewline
28 & -0.297075 & -2.5208 & 0.006963 \tabularnewline
29 & -0.268066 & -2.2746 & 0.012955 \tabularnewline
30 & -0.233544 & -1.9817 & 0.025667 \tabularnewline
31 & -0.194293 & -1.6486 & 0.05179 \tabularnewline
32 & -0.156953 & -1.3318 & 0.093565 \tabularnewline
33 & -0.131057 & -1.1121 & 0.134906 \tabularnewline
34 & -0.123227 & -1.0456 & 0.149618 \tabularnewline
35 & -0.130781 & -1.1097 & 0.135408 \tabularnewline
36 & -0.14194 & -1.2044 & 0.116189 \tabularnewline
37 & -0.149606 & -1.2694 & 0.104185 \tabularnewline
38 & -0.15065 & -1.2783 & 0.102624 \tabularnewline
39 & -0.147004 & -1.2474 & 0.108152 \tabularnewline
40 & -0.130351 & -1.1061 & 0.13619 \tabularnewline
41 & -0.108336 & -0.9193 & 0.180514 \tabularnewline
42 & -0.080121 & -0.6798 & 0.249391 \tabularnewline
43 & -0.059365 & -0.5037 & 0.307996 \tabularnewline
44 & -0.050615 & -0.4295 & 0.334428 \tabularnewline
45 & -0.062158 & -0.5274 & 0.299759 \tabularnewline
46 & -0.078067 & -0.6624 & 0.25491 \tabularnewline
47 & -0.089668 & -0.7609 & 0.224613 \tabularnewline
48 & -0.094175 & -0.7991 & 0.213429 \tabularnewline
\hline
\end{tabular}
%Source: https://freestatistics.org/blog/index.php?pk=243451&T=1

[TABLE]
[ROW][C]Autocorrelation Function[/C][/ROW]
[ROW][C]Time lag k[/C][C]ACF(k)[/C][C]T-STAT[/C][C]P-value[/C][/ROW]
[ROW][C]1[/C][C]0.94103[/C][C]7.9849[/C][C]0[/C][/ROW]
[ROW][C]2[/C][C]0.822655[/C][C]6.9805[/C][C]0[/C][/ROW]
[ROW][C]3[/C][C]0.667602[/C][C]5.6648[/C][C]0[/C][/ROW]
[ROW][C]4[/C][C]0.51086[/C][C]4.3348[/C][C]2.3e-05[/C][/ROW]
[ROW][C]5[/C][C]0.368582[/C][C]3.1275[/C][C]0.001272[/C][/ROW]
[ROW][C]6[/C][C]0.25128[/C][C]2.1322[/C][C]0.018202[/C][/ROW]
[ROW][C]7[/C][C]0.168188[/C][C]1.4271[/C][C]0.078933[/C][/ROW]
[ROW][C]8[/C][C]0.119471[/C][C]1.0137[/C][C]0.157049[/C][/ROW]
[ROW][C]9[/C][C]0.100644[/C][C]0.854[/C][C]0.197971[/C][/ROW]
[ROW][C]10[/C][C]0.096453[/C][C]0.8184[/C][C]0.207906[/C][/ROW]
[ROW][C]11[/C][C]0.092998[/C][C]0.7891[/C][C]0.216317[/C][/ROW]
[ROW][C]12[/C][C]0.080435[/C][C]0.6825[/C][C]0.248553[/C][/ROW]
[ROW][C]13[/C][C]0.061071[/C][C]0.5182[/C][C]0.302952[/C][/ROW]
[ROW][C]14[/C][C]0.041008[/C][C]0.348[/C][C]0.364441[/C][/ROW]
[ROW][C]15[/C][C]0.030174[/C][C]0.256[/C][C]0.399325[/C][/ROW]
[ROW][C]16[/C][C]0.018451[/C][C]0.1566[/C][C]0.438013[/C][/ROW]
[ROW][C]17[/C][C]0.003622[/C][C]0.0307[/C][C]0.487784[/C][/ROW]
[ROW][C]18[/C][C]-0.016164[/C][C]-0.1372[/C][C]0.445647[/C][/ROW]
[ROW][C]19[/C][C]-0.038565[/C][C]-0.3272[/C][C]0.372221[/C][/ROW]
[ROW][C]20[/C][C]-0.06976[/C][C]-0.5919[/C][C]0.277874[/C][/ROW]
[ROW][C]21[/C][C]-0.108398[/C][C]-0.9198[/C][C]0.180378[/C][/ROW]
[ROW][C]22[/C][C]-0.153847[/C][C]-1.3054[/C][C]0.097951[/C][/ROW]
[ROW][C]23[/C][C]-0.206279[/C][C]-1.7503[/C][C]0.04216[/C][/ROW]
[ROW][C]24[/C][C]-0.255709[/C][C]-2.1698[/C][C]0.016663[/C][/ROW]
[ROW][C]25[/C][C]-0.288949[/C][C]-2.4518[/C][C]0.00832[/C][/ROW]
[ROW][C]26[/C][C]-0.314033[/C][C]-2.6647[/C][C]0.004753[/C][/ROW]
[ROW][C]27[/C][C]-0.31273[/C][C]-2.6536[/C][C]0.004897[/C][/ROW]
[ROW][C]28[/C][C]-0.297075[/C][C]-2.5208[/C][C]0.006963[/C][/ROW]
[ROW][C]29[/C][C]-0.268066[/C][C]-2.2746[/C][C]0.012955[/C][/ROW]
[ROW][C]30[/C][C]-0.233544[/C][C]-1.9817[/C][C]0.025667[/C][/ROW]
[ROW][C]31[/C][C]-0.194293[/C][C]-1.6486[/C][C]0.05179[/C][/ROW]
[ROW][C]32[/C][C]-0.156953[/C][C]-1.3318[/C][C]0.093565[/C][/ROW]
[ROW][C]33[/C][C]-0.131057[/C][C]-1.1121[/C][C]0.134906[/C][/ROW]
[ROW][C]34[/C][C]-0.123227[/C][C]-1.0456[/C][C]0.149618[/C][/ROW]
[ROW][C]35[/C][C]-0.130781[/C][C]-1.1097[/C][C]0.135408[/C][/ROW]
[ROW][C]36[/C][C]-0.14194[/C][C]-1.2044[/C][C]0.116189[/C][/ROW]
[ROW][C]37[/C][C]-0.149606[/C][C]-1.2694[/C][C]0.104185[/C][/ROW]
[ROW][C]38[/C][C]-0.15065[/C][C]-1.2783[/C][C]0.102624[/C][/ROW]
[ROW][C]39[/C][C]-0.147004[/C][C]-1.2474[/C][C]0.108152[/C][/ROW]
[ROW][C]40[/C][C]-0.130351[/C][C]-1.1061[/C][C]0.13619[/C][/ROW]
[ROW][C]41[/C][C]-0.108336[/C][C]-0.9193[/C][C]0.180514[/C][/ROW]
[ROW][C]42[/C][C]-0.080121[/C][C]-0.6798[/C][C]0.249391[/C][/ROW]
[ROW][C]43[/C][C]-0.059365[/C][C]-0.5037[/C][C]0.307996[/C][/ROW]
[ROW][C]44[/C][C]-0.050615[/C][C]-0.4295[/C][C]0.334428[/C][/ROW]
[ROW][C]45[/C][C]-0.062158[/C][C]-0.5274[/C][C]0.299759[/C][/ROW]
[ROW][C]46[/C][C]-0.078067[/C][C]-0.6624[/C][C]0.25491[/C][/ROW]
[ROW][C]47[/C][C]-0.089668[/C][C]-0.7609[/C][C]0.224613[/C][/ROW]
[ROW][C]48[/C][C]-0.094175[/C][C]-0.7991[/C][C]0.213429[/C][/ROW]
[/TABLE]
Source: https://freestatistics.org/blog/index.php?pk=243451&T=1

Globally Unique Identifier (entire table): ba.freestatistics.org/blog/index.php?pk=243451&T=1

As an alternative you can also use a QR Code:  

The GUIDs for individual cells are displayed in the table below:

Autocorrelation Function
Time lag kACF(k)T-STATP-value
10.941037.98490
20.8226556.98050
30.6676025.66480
40.510864.33482.3e-05
50.3685823.12750.001272
60.251282.13220.018202
70.1681881.42710.078933
80.1194711.01370.157049
90.1006440.8540.197971
100.0964530.81840.207906
110.0929980.78910.216317
120.0804350.68250.248553
130.0610710.51820.302952
140.0410080.3480.364441
150.0301740.2560.399325
160.0184510.15660.438013
170.0036220.03070.487784
18-0.016164-0.13720.445647
19-0.038565-0.32720.372221
20-0.06976-0.59190.277874
21-0.108398-0.91980.180378
22-0.153847-1.30540.097951
23-0.206279-1.75030.04216
24-0.255709-2.16980.016663
25-0.288949-2.45180.00832
26-0.314033-2.66470.004753
27-0.31273-2.65360.004897
28-0.297075-2.52080.006963
29-0.268066-2.27460.012955
30-0.233544-1.98170.025667
31-0.194293-1.64860.05179
32-0.156953-1.33180.093565
33-0.131057-1.11210.134906
34-0.123227-1.04560.149618
35-0.130781-1.10970.135408
36-0.14194-1.20440.116189
37-0.149606-1.26940.104185
38-0.15065-1.27830.102624
39-0.147004-1.24740.108152
40-0.130351-1.10610.13619
41-0.108336-0.91930.180514
42-0.080121-0.67980.249391
43-0.059365-0.50370.307996
44-0.050615-0.42950.334428
45-0.062158-0.52740.299759
46-0.078067-0.66240.25491
47-0.089668-0.76090.224613
48-0.094175-0.79910.213429


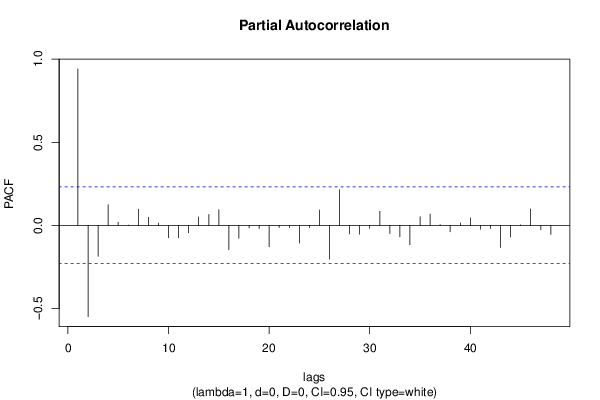
Partial Autocorrelation Function
Time lag kPACF(k)T-STATP-value
10.941037.98490
2-0.549369-4.66157e-06
3-0.18592-1.57760.059523
40.1241881.05380.147755
50.0191190.16220.435789
6-0.001229-0.01040.495854
70.0965640.81940.207639
80.0489640.41550.339514
90.0135760.11520.454306
10-0.074774-0.63450.26389
11-0.074867-0.63530.263634
12-0.0443-0.37590.354049
130.0498870.42330.336667
140.0654150.55510.290285
150.0941620.7990.213461
16-0.147068-1.24790.108053
17-0.077936-0.66130.255263
18-0.015103-0.12820.449192
19-0.019217-0.16310.435463
20-0.128894-1.09370.138865
21-0.013127-0.11140.45581
22-0.01348-0.11440.454626
23-0.106504-0.90370.184581
24-0.013233-0.11230.455456
250.0915220.77660.219971
26-0.20223-1.7160.045233
270.2140931.81660.036717
28-0.051253-0.43490.332469
29-0.052841-0.44840.327615
30-0.018372-0.15590.438276
310.0840730.71340.238956
32-0.048995-0.41570.339419
33-0.068841-0.58410.280478
34-0.116281-0.98670.163553
350.0517150.43880.331054
360.0674760.57260.284365
370.0043480.03690.485337
38-0.038943-0.33040.371013
390.0139520.11840.453046
400.0447880.380.352517
41-0.022648-0.19220.424072
42-0.018717-0.15880.437126
43-0.133389-1.13180.130729
44-0.070419-0.59750.276016
450.003090.02620.489579
460.0979380.8310.204351
47-0.02678-0.22720.410443
48-0.05448-0.46230.322637

\begin{tabular}{lllllllll}
\hline
Partial Autocorrelation Function \tabularnewline
Time lag k & PACF(k) & T-STAT & P-value \tabularnewline
1 & 0.94103 & 7.9849 & 0 \tabularnewline
2 & -0.549369 & -4.6615 & 7e-06 \tabularnewline
3 & -0.18592 & -1.5776 & 0.059523 \tabularnewline
4 & 0.124188 & 1.0538 & 0.147755 \tabularnewline
5 & 0.019119 & 0.1622 & 0.435789 \tabularnewline
6 & -0.001229 & -0.0104 & 0.495854 \tabularnewline
7 & 0.096564 & 0.8194 & 0.207639 \tabularnewline
8 & 0.048964 & 0.4155 & 0.339514 \tabularnewline
9 & 0.013576 & 0.1152 & 0.454306 \tabularnewline
10 & -0.074774 & -0.6345 & 0.26389 \tabularnewline
11 & -0.074867 & -0.6353 & 0.263634 \tabularnewline
12 & -0.0443 & -0.3759 & 0.354049 \tabularnewline
13 & 0.049887 & 0.4233 & 0.336667 \tabularnewline
14 & 0.065415 & 0.5551 & 0.290285 \tabularnewline
15 & 0.094162 & 0.799 & 0.213461 \tabularnewline
16 & -0.147068 & -1.2479 & 0.108053 \tabularnewline
17 & -0.077936 & -0.6613 & 0.255263 \tabularnewline
18 & -0.015103 & -0.1282 & 0.449192 \tabularnewline
19 & -0.019217 & -0.1631 & 0.435463 \tabularnewline
20 & -0.128894 & -1.0937 & 0.138865 \tabularnewline
21 & -0.013127 & -0.1114 & 0.45581 \tabularnewline
22 & -0.01348 & -0.1144 & 0.454626 \tabularnewline
23 & -0.106504 & -0.9037 & 0.184581 \tabularnewline
24 & -0.013233 & -0.1123 & 0.455456 \tabularnewline
25 & 0.091522 & 0.7766 & 0.219971 \tabularnewline
26 & -0.20223 & -1.716 & 0.045233 \tabularnewline
27 & 0.214093 & 1.8166 & 0.036717 \tabularnewline
28 & -0.051253 & -0.4349 & 0.332469 \tabularnewline
29 & -0.052841 & -0.4484 & 0.327615 \tabularnewline
30 & -0.018372 & -0.1559 & 0.438276 \tabularnewline
31 & 0.084073 & 0.7134 & 0.238956 \tabularnewline
32 & -0.048995 & -0.4157 & 0.339419 \tabularnewline
33 & -0.068841 & -0.5841 & 0.280478 \tabularnewline
34 & -0.116281 & -0.9867 & 0.163553 \tabularnewline
35 & 0.051715 & 0.4388 & 0.331054 \tabularnewline
36 & 0.067476 & 0.5726 & 0.284365 \tabularnewline
37 & 0.004348 & 0.0369 & 0.485337 \tabularnewline
38 & -0.038943 & -0.3304 & 0.371013 \tabularnewline
39 & 0.013952 & 0.1184 & 0.453046 \tabularnewline
40 & 0.044788 & 0.38 & 0.352517 \tabularnewline
41 & -0.022648 & -0.1922 & 0.424072 \tabularnewline
42 & -0.018717 & -0.1588 & 0.437126 \tabularnewline
43 & -0.133389 & -1.1318 & 0.130729 \tabularnewline
44 & -0.070419 & -0.5975 & 0.276016 \tabularnewline
45 & 0.00309 & 0.0262 & 0.489579 \tabularnewline
46 & 0.097938 & 0.831 & 0.204351 \tabularnewline
47 & -0.02678 & -0.2272 & 0.410443 \tabularnewline
48 & -0.05448 & -0.4623 & 0.322637 \tabularnewline
\hline
\end{tabular}
%Source: https://freestatistics.org/blog/index.php?pk=243451&T=2

[TABLE]
[ROW][C]Partial Autocorrelation Function[/C][/ROW]
[ROW][C]Time lag k[/C][C]PACF(k)[/C][C]T-STAT[/C][C]P-value[/C][/ROW]
[ROW][C]1[/C][C]0.94103[/C][C]7.9849[/C][C]0[/C][/ROW]
[ROW][C]2[/C][C]-0.549369[/C][C]-4.6615[/C][C]7e-06[/C][/ROW]
[ROW][C]3[/C][C]-0.18592[/C][C]-1.5776[/C][C]0.059523[/C][/ROW]
[ROW][C]4[/C][C]0.124188[/C][C]1.0538[/C][C]0.147755[/C][/ROW]
[ROW][C]5[/C][C]0.019119[/C][C]0.1622[/C][C]0.435789[/C][/ROW]
[ROW][C]6[/C][C]-0.001229[/C][C]-0.0104[/C][C]0.495854[/C][/ROW]
[ROW][C]7[/C][C]0.096564[/C][C]0.8194[/C][C]0.207639[/C][/ROW]
[ROW][C]8[/C][C]0.048964[/C][C]0.4155[/C][C]0.339514[/C][/ROW]
[ROW][C]9[/C][C]0.013576[/C][C]0.1152[/C][C]0.454306[/C][/ROW]
[ROW][C]10[/C][C]-0.074774[/C][C]-0.6345[/C][C]0.26389[/C][/ROW]
[ROW][C]11[/C][C]-0.074867[/C][C]-0.6353[/C][C]0.263634[/C][/ROW]
[ROW][C]12[/C][C]-0.0443[/C][C]-0.3759[/C][C]0.354049[/C][/ROW]
[ROW][C]13[/C][C]0.049887[/C][C]0.4233[/C][C]0.336667[/C][/ROW]
[ROW][C]14[/C][C]0.065415[/C][C]0.5551[/C][C]0.290285[/C][/ROW]
[ROW][C]15[/C][C]0.094162[/C][C]0.799[/C][C]0.213461[/C][/ROW]
[ROW][C]16[/C][C]-0.147068[/C][C]-1.2479[/C][C]0.108053[/C][/ROW]
[ROW][C]17[/C][C]-0.077936[/C][C]-0.6613[/C][C]0.255263[/C][/ROW]
[ROW][C]18[/C][C]-0.015103[/C][C]-0.1282[/C][C]0.449192[/C][/ROW]
[ROW][C]19[/C][C]-0.019217[/C][C]-0.1631[/C][C]0.435463[/C][/ROW]
[ROW][C]20[/C][C]-0.128894[/C][C]-1.0937[/C][C]0.138865[/C][/ROW]
[ROW][C]21[/C][C]-0.013127[/C][C]-0.1114[/C][C]0.45581[/C][/ROW]
[ROW][C]22[/C][C]-0.01348[/C][C]-0.1144[/C][C]0.454626[/C][/ROW]
[ROW][C]23[/C][C]-0.106504[/C][C]-0.9037[/C][C]0.184581[/C][/ROW]
[ROW][C]24[/C][C]-0.013233[/C][C]-0.1123[/C][C]0.455456[/C][/ROW]
[ROW][C]25[/C][C]0.091522[/C][C]0.7766[/C][C]0.219971[/C][/ROW]
[ROW][C]26[/C][C]-0.20223[/C][C]-1.716[/C][C]0.045233[/C][/ROW]
[ROW][C]27[/C][C]0.214093[/C][C]1.8166[/C][C]0.036717[/C][/ROW]
[ROW][C]28[/C][C]-0.051253[/C][C]-0.4349[/C][C]0.332469[/C][/ROW]
[ROW][C]29[/C][C]-0.052841[/C][C]-0.4484[/C][C]0.327615[/C][/ROW]
[ROW][C]30[/C][C]-0.018372[/C][C]-0.1559[/C][C]0.438276[/C][/ROW]
[ROW][C]31[/C][C]0.084073[/C][C]0.7134[/C][C]0.238956[/C][/ROW]
[ROW][C]32[/C][C]-0.048995[/C][C]-0.4157[/C][C]0.339419[/C][/ROW]
[ROW][C]33[/C][C]-0.068841[/C][C]-0.5841[/C][C]0.280478[/C][/ROW]
[ROW][C]34[/C][C]-0.116281[/C][C]-0.9867[/C][C]0.163553[/C][/ROW]
[ROW][C]35[/C][C]0.051715[/C][C]0.4388[/C][C]0.331054[/C][/ROW]
[ROW][C]36[/C][C]0.067476[/C][C]0.5726[/C][C]0.284365[/C][/ROW]
[ROW][C]37[/C][C]0.004348[/C][C]0.0369[/C][C]0.485337[/C][/ROW]
[ROW][C]38[/C][C]-0.038943[/C][C]-0.3304[/C][C]0.371013[/C][/ROW]
[ROW][C]39[/C][C]0.013952[/C][C]0.1184[/C][C]0.453046[/C][/ROW]
[ROW][C]40[/C][C]0.044788[/C][C]0.38[/C][C]0.352517[/C][/ROW]
[ROW][C]41[/C][C]-0.022648[/C][C]-0.1922[/C][C]0.424072[/C][/ROW]
[ROW][C]42[/C][C]-0.018717[/C][C]-0.1588[/C][C]0.437126[/C][/ROW]
[ROW][C]43[/C][C]-0.133389[/C][C]-1.1318[/C][C]0.130729[/C][/ROW]
[ROW][C]44[/C][C]-0.070419[/C][C]-0.5975[/C][C]0.276016[/C][/ROW]
[ROW][C]45[/C][C]0.00309[/C][C]0.0262[/C][C]0.489579[/C][/ROW]
[ROW][C]46[/C][C]0.097938[/C][C]0.831[/C][C]0.204351[/C][/ROW]
[ROW][C]47[/C][C]-0.02678[/C][C]-0.2272[/C][C]0.410443[/C][/ROW]
[ROW][C]48[/C][C]-0.05448[/C][C]-0.4623[/C][C]0.322637[/C][/ROW]
[/TABLE]
Source: https://freestatistics.org/blog/index.php?pk=243451&T=2

Globally Unique Identifier (entire table): ba.freestatistics.org/blog/index.php?pk=243451&T=2

As an alternative you can also use a QR Code:  

The GUIDs for individual cells are displayed in the table below:

Partial Autocorrelation Function
Time lag kPACF(k)T-STATP-value
10.941037.98490
2-0.549369-4.66157e-06
3-0.18592-1.57760.059523
40.1241881.05380.147755
50.0191190.16220.435789
6-0.001229-0.01040.495854
70.0965640.81940.207639
80.0489640.41550.339514
90.0135760.11520.454306
10-0.074774-0.63450.26389
11-0.074867-0.63530.263634
12-0.0443-0.37590.354049
130.0498870.42330.336667
140.0654150.55510.290285
150.0941620.7990.213461
16-0.147068-1.24790.108053
17-0.077936-0.66130.255263
18-0.015103-0.12820.449192
19-0.019217-0.16310.435463
20-0.128894-1.09370.138865
21-0.013127-0.11140.45581
22-0.01348-0.11440.454626
23-0.106504-0.90370.184581
24-0.013233-0.11230.455456
250.0915220.77660.219971
26-0.20223-1.7160.045233
270.2140931.81660.036717
28-0.051253-0.43490.332469
29-0.052841-0.44840.327615
30-0.018372-0.15590.438276
310.0840730.71340.238956
32-0.048995-0.41570.339419
33-0.068841-0.58410.280478
34-0.116281-0.98670.163553
350.0517150.43880.331054
360.0674760.57260.284365
370.0043480.03690.485337
38-0.038943-0.33040.371013
390.0139520.11840.453046
400.0447880.380.352517
41-0.022648-0.19220.424072
42-0.018717-0.15880.437126
43-0.133389-1.13180.130729
44-0.070419-0.59750.276016
450.003090.02620.489579
460.0979380.8310.204351
47-0.02678-0.22720.410443
48-0.05448-0.46230.322637


Parameters (Session):
par1 = 48 ; par2 = 1 ; par3 = 0 ; par4 = 0 ; par5 = 12 ; par6 = White Noise ; par7 = 0.95 ;
Parameters (R input):
par1 = 48 ; par2 = 1 ; par3 = 0 ; par4 = 0 ; par5 = 12 ; par6 = White Noise ; par7 = 0.95 ; par8 = ;
R code (references can be found in the software module):
par8 <- ''
par7 <- '0.95'
par6 <- 'White Noise'
par5 <- '12'
par4 <- '0'
par3 <- '0'
par2 <- '1'
par1 <- '48'
if (par1 == 'Default') {
par1 = 10*log10(length(x))
} else {
par1 <- as.numeric(par1)
}
par2 <- as.numeric(par2)
par3 <- as.numeric(par3)
par4 <- as.numeric(par4)
par5 <- as.numeric(par5)
if (par6 == 'White Noise') par6 <- 'white' else par6 <- 'ma'
par7 <- as.numeric(par7)
if (par8 != '') par8 <- as.numeric(par8)
ox <- x
if (par8 == '') {
if (par2 == 0) {
x <- log(x)
} else {
x <- (x ^ par2 - 1) / par2
}
} else {
x <- log(x,base=par8)
}
if (par3 > 0) x <- diff(x,lag=1,difference=par3)
if (par4 > 0) x <- diff(x,lag=par5,difference=par4)
bitmap(file='picts.png')
op <- par(mfrow=c(2,1))
plot(ox,type='l',main='Original Time Series',xlab='time',ylab='value')
if (par8=='') {
mytitle <- paste('Working Time Series (lambda=',par2,', d=',par3,', D=',par4,')',sep='')
mysub <- paste('(lambda=',par2,', d=',par3,', D=',par4,', CI=', par7, ', CI type=',par6,')',sep='')
} else {
mytitle <- paste('Working Time Series (base=',par8,', d=',par3,', D=',par4,')',sep='')
mysub <- paste('(base=',par8,', d=',par3,', D=',par4,', CI=', par7, ', CI type=',par6,')',sep='')
}
plot(x,type='l', main=mytitle,xlab='time',ylab='value')
par(op)
dev.off()
bitmap(file='pic1.png')
racf <- acf(x, par1, main='Autocorrelation', xlab='time lag', ylab='ACF', ci.type=par6, ci=par7, sub=mysub)
dev.off()
bitmap(file='pic2.png')
rpacf <- pacf(x,par1,main='Partial Autocorrelation',xlab='lags',ylab='PACF',sub=mysub)
dev.off()
(myacf <- c(racf$acf))
(mypacf <- c(rpacf$acf))
lengthx <- length(x)
sqrtn <- sqrt(lengthx)
load(file='createtable')
a<-table.start()
a<-table.row.start(a)
a<-table.element(a,'Autocorrelation Function',4,TRUE)
a<-table.row.end(a)
a<-table.row.start(a)
a<-table.element(a,'Time lag k',header=TRUE)
a<-table.element(a,hyperlink('basics.htm','ACF(k)','click here for more information about the Autocorrelation Function'),header=TRUE)
a<-table.element(a,'T-STAT',header=TRUE)
a<-table.element(a,'P-value',header=TRUE)
a<-table.row.end(a)
for (i in 2:(par1+1)) {
a<-table.row.start(a)
a<-table.element(a,i-1,header=TRUE)
a<-table.element(a,round(myacf[i],6))
mytstat <- myacf[i]*sqrtn
a<-table.element(a,round(mytstat,4))
a<-table.element(a,round(1-pt(abs(mytstat),lengthx),6))
a<-table.row.end(a)
}
a<-table.end(a)
table.save(a,file='mytable.tab')
a<-table.start()
a<-table.row.start(a)
a<-table.element(a,'Partial Autocorrelation Function',4,TRUE)
a<-table.row.end(a)
a<-table.row.start(a)
a<-table.element(a,'Time lag k',header=TRUE)
a<-table.element(a,hyperlink('basics.htm','PACF(k)','click here for more information about the Partial Autocorrelation Function'),header=TRUE)
a<-table.element(a,'T-STAT',header=TRUE)
a<-table.element(a,'P-value',header=TRUE)
a<-table.row.end(a)
for (i in 1:par1) {
a<-table.row.start(a)
a<-table.element(a,i,header=TRUE)
a<-table.element(a,round(mypacf[i],6))
mytstat <- mypacf[i]*sqrtn
a<-table.element(a,round(mytstat,4))
a<-table.element(a,round(1-pt(abs(mytstat),lengthx),6))
a<-table.row.end(a)
}
a<-table.end(a)
table.save(a,file='mytable1.tab')