Free Statistics

of Irreproducible Research!

Author's title

Author*Unverified author*
R Software Modulerwasp_autocorrelation.wasp
Title produced by software(Partial) Autocorrelation Function
Date of computationSat, 18 Oct 2014 11:58:16 +0100
Cite this page as followsStatistical Computations at FreeStatistics.org, Office for Research Development and Education, URL https://freestatistics.org/blog/index.php?v=date/2014/Oct/18/t1413629937ocv7jn3s8q6sxp3.htm/, Retrieved Mon, 13 May 2024 02:00:06 +0000
Statistical Computations at FreeStatistics.org, Office for Research Development and Education, URL https://freestatistics.org/blog/index.php?pk=243438, Retrieved Mon, 13 May 2024 02:00:06 +0000
QR Codes:

Original text written by user:
IsPrivate?No (this computation is public)
User-defined keywords
Estimated Impact126
Family? (F = Feedback message, R = changed R code, M = changed R Module, P = changed Parameters, D = changed Data)
-       [(Partial) Autocorrelation Function] [Asielverzoeken - ...] [2014-10-18 10:58:16] [db747b603bff859876183158e28e8010] [Current]
Feedback Forum

Post a new message
Dataseries X:
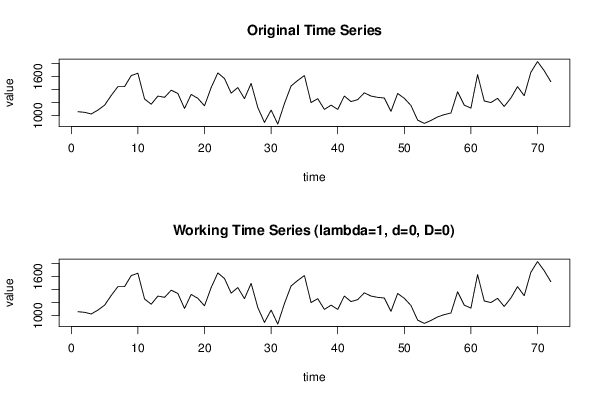
1060
1050
1025
1085
1160
1310
1445
1445
1615
1650
1255
1175
1300
1280
1390
1340
1110
1325
1265
1150
1430
1655
1570
1345
1430
1260
1495
1125
895
1085
870
1185
1455
1540
1615
1200
1260
1095
1160
1095
1300
1215
1245
1350
1300
1280
1270
1065
1340
1265
1155
930
880
925
980
1015
1040
1365
1160
1115
1630
1225
1200
1265
1140
1270
1445
1305
1665
1830
1690
1520


Summary of computational transaction
Raw Inputview raw input (R code)
Raw Outputview raw output of R engine
Computing time2 seconds
R Server'Gwilym Jenkins' @ jenkins.wessa.net

\begin{tabular}{lllllllll}
\hline
Summary of computational transaction \tabularnewline
Raw Input & view raw input (R code)  \tabularnewline
Raw Output & view raw output of R engine  \tabularnewline
Computing time & 2 seconds \tabularnewline
R Server & 'Gwilym Jenkins' @ jenkins.wessa.net \tabularnewline
\hline
\end{tabular}
%Source: https://freestatistics.org/blog/index.php?pk=243438&T=0

[TABLE]
[ROW][C]Summary of computational transaction[/C][/ROW]
[ROW][C]Raw Input[/C][C]view raw input (R code) [/C][/ROW]
[ROW][C]Raw Output[/C][C]view raw output of R engine [/C][/ROW]
[ROW][C]Computing time[/C][C]2 seconds[/C][/ROW]
[ROW][C]R Server[/C][C]'Gwilym Jenkins' @ jenkins.wessa.net[/C][/ROW]
[/TABLE]
Source: https://freestatistics.org/blog/index.php?pk=243438&T=0

Globally Unique Identifier (entire table): ba.freestatistics.org/blog/index.php?pk=243438&T=0

As an alternative you can also use a QR Code:  

The GUIDs for individual cells are displayed in the table below:

Summary of computational transaction
Raw Inputview raw input (R code)
Raw Outputview raw output of R engine
Computing time2 seconds
R Server'Gwilym Jenkins' @ jenkins.wessa.net


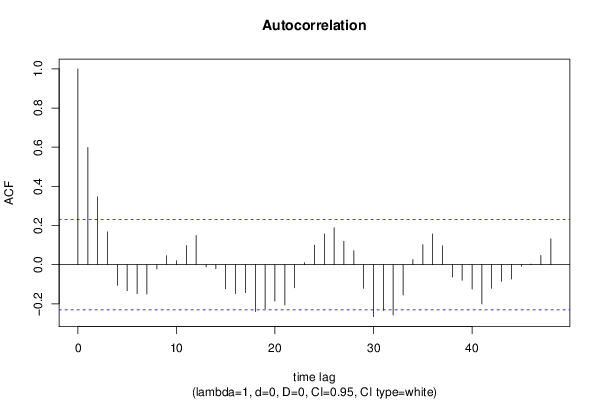
Autocorrelation Function
Time lag kACF(k)T-STATP-value
10.5990725.08331e-06
20.3462622.93810.002217
30.1673781.42020.079926
4-0.105328-0.89370.18722
5-0.132635-1.12540.132068
6-0.148258-1.2580.106225
7-0.150069-1.27340.10349
8-0.022041-0.1870.426086
90.0452610.3840.351037
100.0200710.17030.432623
110.097470.82710.205467
120.1486391.26120.105646
13-0.010945-0.09290.463133
14-0.020264-0.17190.43198
15-0.122917-1.0430.150221
16-0.147084-1.2480.108029
17-0.142843-1.21210.114725
18-0.239415-2.03150.022948
19-0.22555-1.91390.029807
20-0.186297-1.58080.059156
21-0.20592-1.74730.042425
22-0.117825-0.99980.160384
230.0098570.08360.466788
240.0993250.84280.201065
250.1565281.32820.094157
260.1888271.60220.05674
270.1192391.01180.157516
280.0715620.60720.272807
29-0.121397-1.03010.153209
30-0.265708-2.25460.0136
31-0.233024-1.97730.02592
32-0.256987-2.18060.016241
33-0.154831-1.31380.096545
340.025780.21880.413731
350.1024160.8690.193861
360.1566921.32960.093927
370.0961650.8160.2086
38-0.063007-0.53460.297277
39-0.079356-0.67340.251438
40-0.124653-1.05770.14686
41-0.200497-1.70130.046603
42-0.121266-1.0290.153468
43-0.085054-0.72170.236405
44-0.07343-0.62310.267603
45-0.007961-0.06760.473163
460.0027460.02330.490738
470.0471920.40040.34501
480.1319591.11970.13328

\begin{tabular}{lllllllll}
\hline
Autocorrelation Function \tabularnewline
Time lag k & ACF(k) & T-STAT & P-value \tabularnewline
1 & 0.599072 & 5.0833 & 1e-06 \tabularnewline
2 & 0.346262 & 2.9381 & 0.002217 \tabularnewline
3 & 0.167378 & 1.4202 & 0.079926 \tabularnewline
4 & -0.105328 & -0.8937 & 0.18722 \tabularnewline
5 & -0.132635 & -1.1254 & 0.132068 \tabularnewline
6 & -0.148258 & -1.258 & 0.106225 \tabularnewline
7 & -0.150069 & -1.2734 & 0.10349 \tabularnewline
8 & -0.022041 & -0.187 & 0.426086 \tabularnewline
9 & 0.045261 & 0.384 & 0.351037 \tabularnewline
10 & 0.020071 & 0.1703 & 0.432623 \tabularnewline
11 & 0.09747 & 0.8271 & 0.205467 \tabularnewline
12 & 0.148639 & 1.2612 & 0.105646 \tabularnewline
13 & -0.010945 & -0.0929 & 0.463133 \tabularnewline
14 & -0.020264 & -0.1719 & 0.43198 \tabularnewline
15 & -0.122917 & -1.043 & 0.150221 \tabularnewline
16 & -0.147084 & -1.248 & 0.108029 \tabularnewline
17 & -0.142843 & -1.2121 & 0.114725 \tabularnewline
18 & -0.239415 & -2.0315 & 0.022948 \tabularnewline
19 & -0.22555 & -1.9139 & 0.029807 \tabularnewline
20 & -0.186297 & -1.5808 & 0.059156 \tabularnewline
21 & -0.20592 & -1.7473 & 0.042425 \tabularnewline
22 & -0.117825 & -0.9998 & 0.160384 \tabularnewline
23 & 0.009857 & 0.0836 & 0.466788 \tabularnewline
24 & 0.099325 & 0.8428 & 0.201065 \tabularnewline
25 & 0.156528 & 1.3282 & 0.094157 \tabularnewline
26 & 0.188827 & 1.6022 & 0.05674 \tabularnewline
27 & 0.119239 & 1.0118 & 0.157516 \tabularnewline
28 & 0.071562 & 0.6072 & 0.272807 \tabularnewline
29 & -0.121397 & -1.0301 & 0.153209 \tabularnewline
30 & -0.265708 & -2.2546 & 0.0136 \tabularnewline
31 & -0.233024 & -1.9773 & 0.02592 \tabularnewline
32 & -0.256987 & -2.1806 & 0.016241 \tabularnewline
33 & -0.154831 & -1.3138 & 0.096545 \tabularnewline
34 & 0.02578 & 0.2188 & 0.413731 \tabularnewline
35 & 0.102416 & 0.869 & 0.193861 \tabularnewline
36 & 0.156692 & 1.3296 & 0.093927 \tabularnewline
37 & 0.096165 & 0.816 & 0.2086 \tabularnewline
38 & -0.063007 & -0.5346 & 0.297277 \tabularnewline
39 & -0.079356 & -0.6734 & 0.251438 \tabularnewline
40 & -0.124653 & -1.0577 & 0.14686 \tabularnewline
41 & -0.200497 & -1.7013 & 0.046603 \tabularnewline
42 & -0.121266 & -1.029 & 0.153468 \tabularnewline
43 & -0.085054 & -0.7217 & 0.236405 \tabularnewline
44 & -0.07343 & -0.6231 & 0.267603 \tabularnewline
45 & -0.007961 & -0.0676 & 0.473163 \tabularnewline
46 & 0.002746 & 0.0233 & 0.490738 \tabularnewline
47 & 0.047192 & 0.4004 & 0.34501 \tabularnewline
48 & 0.131959 & 1.1197 & 0.13328 \tabularnewline
\hline
\end{tabular}
%Source: https://freestatistics.org/blog/index.php?pk=243438&T=1

[TABLE]
[ROW][C]Autocorrelation Function[/C][/ROW]
[ROW][C]Time lag k[/C][C]ACF(k)[/C][C]T-STAT[/C][C]P-value[/C][/ROW]
[ROW][C]1[/C][C]0.599072[/C][C]5.0833[/C][C]1e-06[/C][/ROW]
[ROW][C]2[/C][C]0.346262[/C][C]2.9381[/C][C]0.002217[/C][/ROW]
[ROW][C]3[/C][C]0.167378[/C][C]1.4202[/C][C]0.079926[/C][/ROW]
[ROW][C]4[/C][C]-0.105328[/C][C]-0.8937[/C][C]0.18722[/C][/ROW]
[ROW][C]5[/C][C]-0.132635[/C][C]-1.1254[/C][C]0.132068[/C][/ROW]
[ROW][C]6[/C][C]-0.148258[/C][C]-1.258[/C][C]0.106225[/C][/ROW]
[ROW][C]7[/C][C]-0.150069[/C][C]-1.2734[/C][C]0.10349[/C][/ROW]
[ROW][C]8[/C][C]-0.022041[/C][C]-0.187[/C][C]0.426086[/C][/ROW]
[ROW][C]9[/C][C]0.045261[/C][C]0.384[/C][C]0.351037[/C][/ROW]
[ROW][C]10[/C][C]0.020071[/C][C]0.1703[/C][C]0.432623[/C][/ROW]
[ROW][C]11[/C][C]0.09747[/C][C]0.8271[/C][C]0.205467[/C][/ROW]
[ROW][C]12[/C][C]0.148639[/C][C]1.2612[/C][C]0.105646[/C][/ROW]
[ROW][C]13[/C][C]-0.010945[/C][C]-0.0929[/C][C]0.463133[/C][/ROW]
[ROW][C]14[/C][C]-0.020264[/C][C]-0.1719[/C][C]0.43198[/C][/ROW]
[ROW][C]15[/C][C]-0.122917[/C][C]-1.043[/C][C]0.150221[/C][/ROW]
[ROW][C]16[/C][C]-0.147084[/C][C]-1.248[/C][C]0.108029[/C][/ROW]
[ROW][C]17[/C][C]-0.142843[/C][C]-1.2121[/C][C]0.114725[/C][/ROW]
[ROW][C]18[/C][C]-0.239415[/C][C]-2.0315[/C][C]0.022948[/C][/ROW]
[ROW][C]19[/C][C]-0.22555[/C][C]-1.9139[/C][C]0.029807[/C][/ROW]
[ROW][C]20[/C][C]-0.186297[/C][C]-1.5808[/C][C]0.059156[/C][/ROW]
[ROW][C]21[/C][C]-0.20592[/C][C]-1.7473[/C][C]0.042425[/C][/ROW]
[ROW][C]22[/C][C]-0.117825[/C][C]-0.9998[/C][C]0.160384[/C][/ROW]
[ROW][C]23[/C][C]0.009857[/C][C]0.0836[/C][C]0.466788[/C][/ROW]
[ROW][C]24[/C][C]0.099325[/C][C]0.8428[/C][C]0.201065[/C][/ROW]
[ROW][C]25[/C][C]0.156528[/C][C]1.3282[/C][C]0.094157[/C][/ROW]
[ROW][C]26[/C][C]0.188827[/C][C]1.6022[/C][C]0.05674[/C][/ROW]
[ROW][C]27[/C][C]0.119239[/C][C]1.0118[/C][C]0.157516[/C][/ROW]
[ROW][C]28[/C][C]0.071562[/C][C]0.6072[/C][C]0.272807[/C][/ROW]
[ROW][C]29[/C][C]-0.121397[/C][C]-1.0301[/C][C]0.153209[/C][/ROW]
[ROW][C]30[/C][C]-0.265708[/C][C]-2.2546[/C][C]0.0136[/C][/ROW]
[ROW][C]31[/C][C]-0.233024[/C][C]-1.9773[/C][C]0.02592[/C][/ROW]
[ROW][C]32[/C][C]-0.256987[/C][C]-2.1806[/C][C]0.016241[/C][/ROW]
[ROW][C]33[/C][C]-0.154831[/C][C]-1.3138[/C][C]0.096545[/C][/ROW]
[ROW][C]34[/C][C]0.02578[/C][C]0.2188[/C][C]0.413731[/C][/ROW]
[ROW][C]35[/C][C]0.102416[/C][C]0.869[/C][C]0.193861[/C][/ROW]
[ROW][C]36[/C][C]0.156692[/C][C]1.3296[/C][C]0.093927[/C][/ROW]
[ROW][C]37[/C][C]0.096165[/C][C]0.816[/C][C]0.2086[/C][/ROW]
[ROW][C]38[/C][C]-0.063007[/C][C]-0.5346[/C][C]0.297277[/C][/ROW]
[ROW][C]39[/C][C]-0.079356[/C][C]-0.6734[/C][C]0.251438[/C][/ROW]
[ROW][C]40[/C][C]-0.124653[/C][C]-1.0577[/C][C]0.14686[/C][/ROW]
[ROW][C]41[/C][C]-0.200497[/C][C]-1.7013[/C][C]0.046603[/C][/ROW]
[ROW][C]42[/C][C]-0.121266[/C][C]-1.029[/C][C]0.153468[/C][/ROW]
[ROW][C]43[/C][C]-0.085054[/C][C]-0.7217[/C][C]0.236405[/C][/ROW]
[ROW][C]44[/C][C]-0.07343[/C][C]-0.6231[/C][C]0.267603[/C][/ROW]
[ROW][C]45[/C][C]-0.007961[/C][C]-0.0676[/C][C]0.473163[/C][/ROW]
[ROW][C]46[/C][C]0.002746[/C][C]0.0233[/C][C]0.490738[/C][/ROW]
[ROW][C]47[/C][C]0.047192[/C][C]0.4004[/C][C]0.34501[/C][/ROW]
[ROW][C]48[/C][C]0.131959[/C][C]1.1197[/C][C]0.13328[/C][/ROW]
[/TABLE]
Source: https://freestatistics.org/blog/index.php?pk=243438&T=1

Globally Unique Identifier (entire table): ba.freestatistics.org/blog/index.php?pk=243438&T=1

As an alternative you can also use a QR Code:  

The GUIDs for individual cells are displayed in the table below:

Autocorrelation Function
Time lag kACF(k)T-STATP-value
10.5990725.08331e-06
20.3462622.93810.002217
30.1673781.42020.079926
4-0.105328-0.89370.18722
5-0.132635-1.12540.132068
6-0.148258-1.2580.106225
7-0.150069-1.27340.10349
8-0.022041-0.1870.426086
90.0452610.3840.351037
100.0200710.17030.432623
110.097470.82710.205467
120.1486391.26120.105646
13-0.010945-0.09290.463133
14-0.020264-0.17190.43198
15-0.122917-1.0430.150221
16-0.147084-1.2480.108029
17-0.142843-1.21210.114725
18-0.239415-2.03150.022948
19-0.22555-1.91390.029807
20-0.186297-1.58080.059156
21-0.20592-1.74730.042425
22-0.117825-0.99980.160384
230.0098570.08360.466788
240.0993250.84280.201065
250.1565281.32820.094157
260.1888271.60220.05674
270.1192391.01180.157516
280.0715620.60720.272807
29-0.121397-1.03010.153209
30-0.265708-2.25460.0136
31-0.233024-1.97730.02592
32-0.256987-2.18060.016241
33-0.154831-1.31380.096545
340.025780.21880.413731
350.1024160.8690.193861
360.1566921.32960.093927
370.0961650.8160.2086
38-0.063007-0.53460.297277
39-0.079356-0.67340.251438
40-0.124653-1.05770.14686
41-0.200497-1.70130.046603
42-0.121266-1.0290.153468
43-0.085054-0.72170.236405
44-0.07343-0.62310.267603
45-0.007961-0.06760.473163
460.0027460.02330.490738
470.0471920.40040.34501
480.1319591.11970.13328


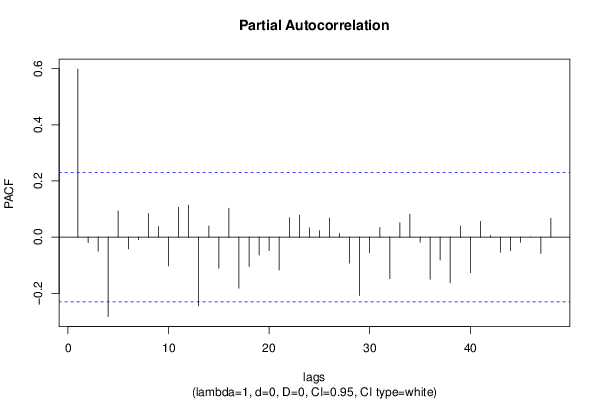
Partial Autocorrelation Function
Time lag kPACF(k)T-STATP-value
10.5990725.08331e-06
2-0.019692-0.16710.433883
3-0.050473-0.42830.334864
4-0.283196-2.4030.00942
50.0935950.79420.214849
6-0.041852-0.35510.361768
7-0.008825-0.07490.470256
80.0840980.71360.238892
90.0381370.32360.373589
10-0.102579-0.87040.193484
110.1063540.90240.184915
120.1141330.96840.168031
13-0.245198-2.08060.020516
140.0395010.33520.369234
15-0.111-0.94190.174705
160.1027460.87180.193101
17-0.182345-1.54730.063094
18-0.104498-0.88670.189098
19-0.063506-0.53890.295822
20-0.04796-0.4070.342624
21-0.116848-0.99150.162384
220.0689230.58480.280246
230.0783790.66510.254066
240.0329780.27980.390207
250.0239630.20330.419724
260.0678570.57580.283277
270.0134290.11390.454798
28-0.092682-0.78640.217096
29-0.208125-1.7660.040818
30-0.056119-0.47620.317693
310.034250.29060.386087
32-0.147743-1.25360.107015
330.0511680.43420.332731
340.0820780.69650.244194
35-0.017829-0.15130.440088
36-0.149718-1.27040.104017
37-0.081443-0.69110.245872
38-0.162728-1.38080.085807
390.0397150.3370.36855
40-0.126471-1.07310.143395
410.0561540.47650.317588
420.0062170.05280.479036
43-0.053828-0.45670.324614
44-0.048763-0.41380.340139
45-0.018407-0.15620.43816
46-0.000371-0.00320.498747
47-0.057938-0.49160.312242
480.0674650.57250.284396

\begin{tabular}{lllllllll}
\hline
Partial Autocorrelation Function \tabularnewline
Time lag k & PACF(k) & T-STAT & P-value \tabularnewline
1 & 0.599072 & 5.0833 & 1e-06 \tabularnewline
2 & -0.019692 & -0.1671 & 0.433883 \tabularnewline
3 & -0.050473 & -0.4283 & 0.334864 \tabularnewline
4 & -0.283196 & -2.403 & 0.00942 \tabularnewline
5 & 0.093595 & 0.7942 & 0.214849 \tabularnewline
6 & -0.041852 & -0.3551 & 0.361768 \tabularnewline
7 & -0.008825 & -0.0749 & 0.470256 \tabularnewline
8 & 0.084098 & 0.7136 & 0.238892 \tabularnewline
9 & 0.038137 & 0.3236 & 0.373589 \tabularnewline
10 & -0.102579 & -0.8704 & 0.193484 \tabularnewline
11 & 0.106354 & 0.9024 & 0.184915 \tabularnewline
12 & 0.114133 & 0.9684 & 0.168031 \tabularnewline
13 & -0.245198 & -2.0806 & 0.020516 \tabularnewline
14 & 0.039501 & 0.3352 & 0.369234 \tabularnewline
15 & -0.111 & -0.9419 & 0.174705 \tabularnewline
16 & 0.102746 & 0.8718 & 0.193101 \tabularnewline
17 & -0.182345 & -1.5473 & 0.063094 \tabularnewline
18 & -0.104498 & -0.8867 & 0.189098 \tabularnewline
19 & -0.063506 & -0.5389 & 0.295822 \tabularnewline
20 & -0.04796 & -0.407 & 0.342624 \tabularnewline
21 & -0.116848 & -0.9915 & 0.162384 \tabularnewline
22 & 0.068923 & 0.5848 & 0.280246 \tabularnewline
23 & 0.078379 & 0.6651 & 0.254066 \tabularnewline
24 & 0.032978 & 0.2798 & 0.390207 \tabularnewline
25 & 0.023963 & 0.2033 & 0.419724 \tabularnewline
26 & 0.067857 & 0.5758 & 0.283277 \tabularnewline
27 & 0.013429 & 0.1139 & 0.454798 \tabularnewline
28 & -0.092682 & -0.7864 & 0.217096 \tabularnewline
29 & -0.208125 & -1.766 & 0.040818 \tabularnewline
30 & -0.056119 & -0.4762 & 0.317693 \tabularnewline
31 & 0.03425 & 0.2906 & 0.386087 \tabularnewline
32 & -0.147743 & -1.2536 & 0.107015 \tabularnewline
33 & 0.051168 & 0.4342 & 0.332731 \tabularnewline
34 & 0.082078 & 0.6965 & 0.244194 \tabularnewline
35 & -0.017829 & -0.1513 & 0.440088 \tabularnewline
36 & -0.149718 & -1.2704 & 0.104017 \tabularnewline
37 & -0.081443 & -0.6911 & 0.245872 \tabularnewline
38 & -0.162728 & -1.3808 & 0.085807 \tabularnewline
39 & 0.039715 & 0.337 & 0.36855 \tabularnewline
40 & -0.126471 & -1.0731 & 0.143395 \tabularnewline
41 & 0.056154 & 0.4765 & 0.317588 \tabularnewline
42 & 0.006217 & 0.0528 & 0.479036 \tabularnewline
43 & -0.053828 & -0.4567 & 0.324614 \tabularnewline
44 & -0.048763 & -0.4138 & 0.340139 \tabularnewline
45 & -0.018407 & -0.1562 & 0.43816 \tabularnewline
46 & -0.000371 & -0.0032 & 0.498747 \tabularnewline
47 & -0.057938 & -0.4916 & 0.312242 \tabularnewline
48 & 0.067465 & 0.5725 & 0.284396 \tabularnewline
\hline
\end{tabular}
%Source: https://freestatistics.org/blog/index.php?pk=243438&T=2

[TABLE]
[ROW][C]Partial Autocorrelation Function[/C][/ROW]
[ROW][C]Time lag k[/C][C]PACF(k)[/C][C]T-STAT[/C][C]P-value[/C][/ROW]
[ROW][C]1[/C][C]0.599072[/C][C]5.0833[/C][C]1e-06[/C][/ROW]
[ROW][C]2[/C][C]-0.019692[/C][C]-0.1671[/C][C]0.433883[/C][/ROW]
[ROW][C]3[/C][C]-0.050473[/C][C]-0.4283[/C][C]0.334864[/C][/ROW]
[ROW][C]4[/C][C]-0.283196[/C][C]-2.403[/C][C]0.00942[/C][/ROW]
[ROW][C]5[/C][C]0.093595[/C][C]0.7942[/C][C]0.214849[/C][/ROW]
[ROW][C]6[/C][C]-0.041852[/C][C]-0.3551[/C][C]0.361768[/C][/ROW]
[ROW][C]7[/C][C]-0.008825[/C][C]-0.0749[/C][C]0.470256[/C][/ROW]
[ROW][C]8[/C][C]0.084098[/C][C]0.7136[/C][C]0.238892[/C][/ROW]
[ROW][C]9[/C][C]0.038137[/C][C]0.3236[/C][C]0.373589[/C][/ROW]
[ROW][C]10[/C][C]-0.102579[/C][C]-0.8704[/C][C]0.193484[/C][/ROW]
[ROW][C]11[/C][C]0.106354[/C][C]0.9024[/C][C]0.184915[/C][/ROW]
[ROW][C]12[/C][C]0.114133[/C][C]0.9684[/C][C]0.168031[/C][/ROW]
[ROW][C]13[/C][C]-0.245198[/C][C]-2.0806[/C][C]0.020516[/C][/ROW]
[ROW][C]14[/C][C]0.039501[/C][C]0.3352[/C][C]0.369234[/C][/ROW]
[ROW][C]15[/C][C]-0.111[/C][C]-0.9419[/C][C]0.174705[/C][/ROW]
[ROW][C]16[/C][C]0.102746[/C][C]0.8718[/C][C]0.193101[/C][/ROW]
[ROW][C]17[/C][C]-0.182345[/C][C]-1.5473[/C][C]0.063094[/C][/ROW]
[ROW][C]18[/C][C]-0.104498[/C][C]-0.8867[/C][C]0.189098[/C][/ROW]
[ROW][C]19[/C][C]-0.063506[/C][C]-0.5389[/C][C]0.295822[/C][/ROW]
[ROW][C]20[/C][C]-0.04796[/C][C]-0.407[/C][C]0.342624[/C][/ROW]
[ROW][C]21[/C][C]-0.116848[/C][C]-0.9915[/C][C]0.162384[/C][/ROW]
[ROW][C]22[/C][C]0.068923[/C][C]0.5848[/C][C]0.280246[/C][/ROW]
[ROW][C]23[/C][C]0.078379[/C][C]0.6651[/C][C]0.254066[/C][/ROW]
[ROW][C]24[/C][C]0.032978[/C][C]0.2798[/C][C]0.390207[/C][/ROW]
[ROW][C]25[/C][C]0.023963[/C][C]0.2033[/C][C]0.419724[/C][/ROW]
[ROW][C]26[/C][C]0.067857[/C][C]0.5758[/C][C]0.283277[/C][/ROW]
[ROW][C]27[/C][C]0.013429[/C][C]0.1139[/C][C]0.454798[/C][/ROW]
[ROW][C]28[/C][C]-0.092682[/C][C]-0.7864[/C][C]0.217096[/C][/ROW]
[ROW][C]29[/C][C]-0.208125[/C][C]-1.766[/C][C]0.040818[/C][/ROW]
[ROW][C]30[/C][C]-0.056119[/C][C]-0.4762[/C][C]0.317693[/C][/ROW]
[ROW][C]31[/C][C]0.03425[/C][C]0.2906[/C][C]0.386087[/C][/ROW]
[ROW][C]32[/C][C]-0.147743[/C][C]-1.2536[/C][C]0.107015[/C][/ROW]
[ROW][C]33[/C][C]0.051168[/C][C]0.4342[/C][C]0.332731[/C][/ROW]
[ROW][C]34[/C][C]0.082078[/C][C]0.6965[/C][C]0.244194[/C][/ROW]
[ROW][C]35[/C][C]-0.017829[/C][C]-0.1513[/C][C]0.440088[/C][/ROW]
[ROW][C]36[/C][C]-0.149718[/C][C]-1.2704[/C][C]0.104017[/C][/ROW]
[ROW][C]37[/C][C]-0.081443[/C][C]-0.6911[/C][C]0.245872[/C][/ROW]
[ROW][C]38[/C][C]-0.162728[/C][C]-1.3808[/C][C]0.085807[/C][/ROW]
[ROW][C]39[/C][C]0.039715[/C][C]0.337[/C][C]0.36855[/C][/ROW]
[ROW][C]40[/C][C]-0.126471[/C][C]-1.0731[/C][C]0.143395[/C][/ROW]
[ROW][C]41[/C][C]0.056154[/C][C]0.4765[/C][C]0.317588[/C][/ROW]
[ROW][C]42[/C][C]0.006217[/C][C]0.0528[/C][C]0.479036[/C][/ROW]
[ROW][C]43[/C][C]-0.053828[/C][C]-0.4567[/C][C]0.324614[/C][/ROW]
[ROW][C]44[/C][C]-0.048763[/C][C]-0.4138[/C][C]0.340139[/C][/ROW]
[ROW][C]45[/C][C]-0.018407[/C][C]-0.1562[/C][C]0.43816[/C][/ROW]
[ROW][C]46[/C][C]-0.000371[/C][C]-0.0032[/C][C]0.498747[/C][/ROW]
[ROW][C]47[/C][C]-0.057938[/C][C]-0.4916[/C][C]0.312242[/C][/ROW]
[ROW][C]48[/C][C]0.067465[/C][C]0.5725[/C][C]0.284396[/C][/ROW]
[/TABLE]
Source: https://freestatistics.org/blog/index.php?pk=243438&T=2

Globally Unique Identifier (entire table): ba.freestatistics.org/blog/index.php?pk=243438&T=2

As an alternative you can also use a QR Code:  

The GUIDs for individual cells are displayed in the table below:

Partial Autocorrelation Function
Time lag kPACF(k)T-STATP-value
10.5990725.08331e-06
2-0.019692-0.16710.433883
3-0.050473-0.42830.334864
4-0.283196-2.4030.00942
50.0935950.79420.214849
6-0.041852-0.35510.361768
7-0.008825-0.07490.470256
80.0840980.71360.238892
90.0381370.32360.373589
10-0.102579-0.87040.193484
110.1063540.90240.184915
120.1141330.96840.168031
13-0.245198-2.08060.020516
140.0395010.33520.369234
15-0.111-0.94190.174705
160.1027460.87180.193101
17-0.182345-1.54730.063094
18-0.104498-0.88670.189098
19-0.063506-0.53890.295822
20-0.04796-0.4070.342624
21-0.116848-0.99150.162384
220.0689230.58480.280246
230.0783790.66510.254066
240.0329780.27980.390207
250.0239630.20330.419724
260.0678570.57580.283277
270.0134290.11390.454798
28-0.092682-0.78640.217096
29-0.208125-1.7660.040818
30-0.056119-0.47620.317693
310.034250.29060.386087
32-0.147743-1.25360.107015
330.0511680.43420.332731
340.0820780.69650.244194
35-0.017829-0.15130.440088
36-0.149718-1.27040.104017
37-0.081443-0.69110.245872
38-0.162728-1.38080.085807
390.0397150.3370.36855
40-0.126471-1.07310.143395
410.0561540.47650.317588
420.0062170.05280.479036
43-0.053828-0.45670.324614
44-0.048763-0.41380.340139
45-0.018407-0.15620.43816
46-0.000371-0.00320.498747
47-0.057938-0.49160.312242
480.0674650.57250.284396


Parameters (Session):
par1 = 48 ; par2 = 1 ; par3 = 0 ; par4 = 0 ; par5 = 12 ; par6 = White Noise ; par7 = 0.95 ;
Parameters (R input):
par1 = 48 ; par2 = 1 ; par3 = 0 ; par4 = 0 ; par5 = 12 ; par6 = White Noise ; par7 = 0.95 ; par8 = ;
R code (references can be found in the software module):
if (par1 == 'Default') {
par1 = 10*log10(length(x))
} else {
par1 <- as.numeric(par1)
}
par2 <- as.numeric(par2)
par3 <- as.numeric(par3)
par4 <- as.numeric(par4)
par5 <- as.numeric(par5)
if (par6 == 'White Noise') par6 <- 'white' else par6 <- 'ma'
par7 <- as.numeric(par7)
if (par8 != '') par8 <- as.numeric(par8)
ox <- x
if (par8 == '') {
if (par2 == 0) {
x <- log(x)
} else {
x <- (x ^ par2 - 1) / par2
}
} else {
x <- log(x,base=par8)
}
if (par3 > 0) x <- diff(x,lag=1,difference=par3)
if (par4 > 0) x <- diff(x,lag=par5,difference=par4)
bitmap(file='picts.png')
op <- par(mfrow=c(2,1))
plot(ox,type='l',main='Original Time Series',xlab='time',ylab='value')
if (par8=='') {
mytitle <- paste('Working Time Series (lambda=',par2,', d=',par3,', D=',par4,')',sep='')
mysub <- paste('(lambda=',par2,', d=',par3,', D=',par4,', CI=', par7, ', CI type=',par6,')',sep='')
} else {
mytitle <- paste('Working Time Series (base=',par8,', d=',par3,', D=',par4,')',sep='')
mysub <- paste('(base=',par8,', d=',par3,', D=',par4,', CI=', par7, ', CI type=',par6,')',sep='')
}
plot(x,type='l', main=mytitle,xlab='time',ylab='value')
par(op)
dev.off()
bitmap(file='pic1.png')
racf <- acf(x, par1, main='Autocorrelation', xlab='time lag', ylab='ACF', ci.type=par6, ci=par7, sub=mysub)
dev.off()
bitmap(file='pic2.png')
rpacf <- pacf(x,par1,main='Partial Autocorrelation',xlab='lags',ylab='PACF',sub=mysub)
dev.off()
(myacf <- c(racf$acf))
(mypacf <- c(rpacf$acf))
lengthx <- length(x)
sqrtn <- sqrt(lengthx)
load(file='createtable')
a<-table.start()
a<-table.row.start(a)
a<-table.element(a,'Autocorrelation Function',4,TRUE)
a<-table.row.end(a)
a<-table.row.start(a)
a<-table.element(a,'Time lag k',header=TRUE)
a<-table.element(a,hyperlink('basics.htm','ACF(k)','click here for more information about the Autocorrelation Function'),header=TRUE)
a<-table.element(a,'T-STAT',header=TRUE)
a<-table.element(a,'P-value',header=TRUE)
a<-table.row.end(a)
for (i in 2:(par1+1)) {
a<-table.row.start(a)
a<-table.element(a,i-1,header=TRUE)
a<-table.element(a,round(myacf[i],6))
mytstat <- myacf[i]*sqrtn
a<-table.element(a,round(mytstat,4))
a<-table.element(a,round(1-pt(abs(mytstat),lengthx),6))
a<-table.row.end(a)
}
a<-table.end(a)
table.save(a,file='mytable.tab')
a<-table.start()
a<-table.row.start(a)
a<-table.element(a,'Partial Autocorrelation Function',4,TRUE)
a<-table.row.end(a)
a<-table.row.start(a)
a<-table.element(a,'Time lag k',header=TRUE)
a<-table.element(a,hyperlink('basics.htm','PACF(k)','click here for more information about the Partial Autocorrelation Function'),header=TRUE)
a<-table.element(a,'T-STAT',header=TRUE)
a<-table.element(a,'P-value',header=TRUE)
a<-table.row.end(a)
for (i in 1:par1) {
a<-table.row.start(a)
a<-table.element(a,i,header=TRUE)
a<-table.element(a,round(mypacf[i],6))
mytstat <- mypacf[i]*sqrtn
a<-table.element(a,round(mytstat,4))
a<-table.element(a,round(1-pt(abs(mytstat),lengthx),6))
a<-table.row.end(a)
}
a<-table.end(a)
table.save(a,file='mytable1.tab')