Free Statistics

of Irreproducible Research!

Author's title

Author*Unverified author*
R Software Modulerwasp_autocorrelation.wasp
Title produced by software(Partial) Autocorrelation Function
Date of computationSat, 18 Oct 2014 11:43:11 +0100
Cite this page as followsStatistical Computations at FreeStatistics.org, Office for Research Development and Education, URL https://freestatistics.org/blog/index.php?v=date/2014/Oct/18/t1413629023j5c2u8fz07iz4l6.htm/, Retrieved Mon, 13 May 2024 17:17:36 +0000
Statistical Computations at FreeStatistics.org, Office for Research Development and Education, URL https://freestatistics.org/blog/index.php?pk=243433, Retrieved Mon, 13 May 2024 17:17:36 +0000
QR Codes:

Original text written by user:
IsPrivate?No (this computation is public)
User-defined keywords
Estimated Impact111
Family? (F = Feedback message, R = changed R code, M = changed R Module, P = changed Parameters, D = changed Data)
-       [(Partial) Autocorrelation Function] [] [2014-10-18 10:43:11] [72d1b0bbc256d1ec09d716526c8fc98d] [Current]
Feedback Forum

Post a new message
Dataseries X:
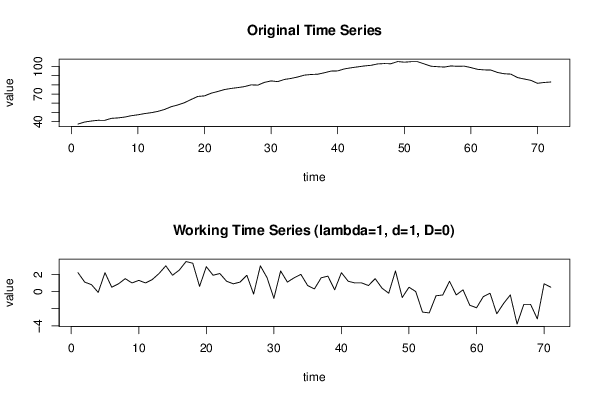
37.3
39.5
40.6
41.4
41.3
43.5
44
44.9
46.4
47.4
48.7
49.7
51.1
53.2
56.2
58.1
60.6
64.1
67.4
68
70.9
72.8
74.9
76.1
77
78.1
80
79.7
82.7
84.3
83.5
85.9
87
88.6
90.6
91.3
91.6
93.2
95
95.2
97.4
98.6
99.6
100.6
101.3
102.8
103.2
103
105.4
104.7
105.2
105.2
102.8
100.3
99.8
99.4
100.6
100.2
100.4
98.8
96.9
96.3
96.1
93.5
92.1
91.7
87.9
86.4
84.9
81.7
82.6
83.1


Summary of computational transaction
Raw Inputview raw input (R code)
Raw Outputview raw output of R engine
Computing time2 seconds
R Server'Herman Ole Andreas Wold' @ wold.wessa.net

\begin{tabular}{lllllllll}
\hline
Summary of computational transaction \tabularnewline
Raw Input & view raw input (R code)  \tabularnewline
Raw Output & view raw output of R engine  \tabularnewline
Computing time & 2 seconds \tabularnewline
R Server & 'Herman Ole Andreas Wold' @ wold.wessa.net \tabularnewline
\hline
\end{tabular}
%Source: https://freestatistics.org/blog/index.php?pk=243433&T=0

[TABLE]
[ROW][C]Summary of computational transaction[/C][/ROW]
[ROW][C]Raw Input[/C][C]view raw input (R code) [/C][/ROW]
[ROW][C]Raw Output[/C][C]view raw output of R engine [/C][/ROW]
[ROW][C]Computing time[/C][C]2 seconds[/C][/ROW]
[ROW][C]R Server[/C][C]'Herman Ole Andreas Wold' @ wold.wessa.net[/C][/ROW]
[/TABLE]
Source: https://freestatistics.org/blog/index.php?pk=243433&T=0

Globally Unique Identifier (entire table): ba.freestatistics.org/blog/index.php?pk=243433&T=0

As an alternative you can also use a QR Code:  

The GUIDs for individual cells are displayed in the table below:

Summary of computational transaction
Raw Inputview raw input (R code)
Raw Outputview raw output of R engine
Computing time2 seconds
R Server'Herman Ole Andreas Wold' @ wold.wessa.net


Autocorrelation Function
Time lag kACF(k)T-STATP-value
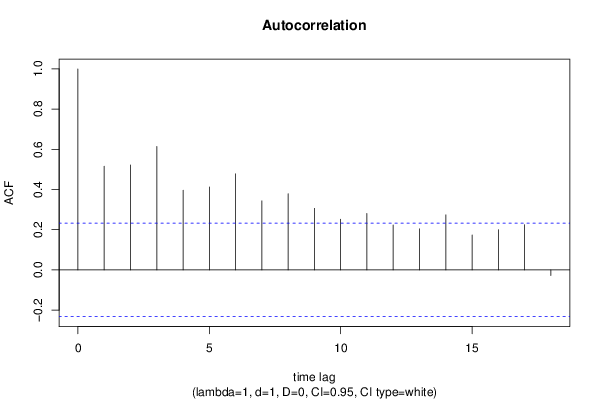
10.5155234.34392.3e-05
20.5219824.39831.9e-05
30.613985.17351e-06
40.396133.33790.000673
50.4128943.47910.000432
60.4780364.0287e-05
70.3436962.8960.00251
80.3787293.19120.001055
90.3062562.58060.005966
100.252222.12520.018523
110.2808392.36640.010347
120.2231641.88040.032077
130.2042471.7210.044801
140.273972.30850.011943
150.1734151.46120.074184
160.1997441.68310.048377
170.2243941.89080.031367
18-0.02763-0.23280.408289

\begin{tabular}{lllllllll}
\hline
Autocorrelation Function \tabularnewline
Time lag k & ACF(k) & T-STAT & P-value \tabularnewline
1 & 0.515523 & 4.3439 & 2.3e-05 \tabularnewline
2 & 0.521982 & 4.3983 & 1.9e-05 \tabularnewline
3 & 0.61398 & 5.1735 & 1e-06 \tabularnewline
4 & 0.39613 & 3.3379 & 0.000673 \tabularnewline
5 & 0.412894 & 3.4791 & 0.000432 \tabularnewline
6 & 0.478036 & 4.028 & 7e-05 \tabularnewline
7 & 0.343696 & 2.896 & 0.00251 \tabularnewline
8 & 0.378729 & 3.1912 & 0.001055 \tabularnewline
9 & 0.306256 & 2.5806 & 0.005966 \tabularnewline
10 & 0.25222 & 2.1252 & 0.018523 \tabularnewline
11 & 0.280839 & 2.3664 & 0.010347 \tabularnewline
12 & 0.223164 & 1.8804 & 0.032077 \tabularnewline
13 & 0.204247 & 1.721 & 0.044801 \tabularnewline
14 & 0.27397 & 2.3085 & 0.011943 \tabularnewline
15 & 0.173415 & 1.4612 & 0.074184 \tabularnewline
16 & 0.199744 & 1.6831 & 0.048377 \tabularnewline
17 & 0.224394 & 1.8908 & 0.031367 \tabularnewline
18 & -0.02763 & -0.2328 & 0.408289 \tabularnewline
\hline
\end{tabular}
%Source: https://freestatistics.org/blog/index.php?pk=243433&T=1

[TABLE]
[ROW][C]Autocorrelation Function[/C][/ROW]
[ROW][C]Time lag k[/C][C]ACF(k)[/C][C]T-STAT[/C][C]P-value[/C][/ROW]
[ROW][C]1[/C][C]0.515523[/C][C]4.3439[/C][C]2.3e-05[/C][/ROW]
[ROW][C]2[/C][C]0.521982[/C][C]4.3983[/C][C]1.9e-05[/C][/ROW]
[ROW][C]3[/C][C]0.61398[/C][C]5.1735[/C][C]1e-06[/C][/ROW]
[ROW][C]4[/C][C]0.39613[/C][C]3.3379[/C][C]0.000673[/C][/ROW]
[ROW][C]5[/C][C]0.412894[/C][C]3.4791[/C][C]0.000432[/C][/ROW]
[ROW][C]6[/C][C]0.478036[/C][C]4.028[/C][C]7e-05[/C][/ROW]
[ROW][C]7[/C][C]0.343696[/C][C]2.896[/C][C]0.00251[/C][/ROW]
[ROW][C]8[/C][C]0.378729[/C][C]3.1912[/C][C]0.001055[/C][/ROW]
[ROW][C]9[/C][C]0.306256[/C][C]2.5806[/C][C]0.005966[/C][/ROW]
[ROW][C]10[/C][C]0.25222[/C][C]2.1252[/C][C]0.018523[/C][/ROW]
[ROW][C]11[/C][C]0.280839[/C][C]2.3664[/C][C]0.010347[/C][/ROW]
[ROW][C]12[/C][C]0.223164[/C][C]1.8804[/C][C]0.032077[/C][/ROW]
[ROW][C]13[/C][C]0.204247[/C][C]1.721[/C][C]0.044801[/C][/ROW]
[ROW][C]14[/C][C]0.27397[/C][C]2.3085[/C][C]0.011943[/C][/ROW]
[ROW][C]15[/C][C]0.173415[/C][C]1.4612[/C][C]0.074184[/C][/ROW]
[ROW][C]16[/C][C]0.199744[/C][C]1.6831[/C][C]0.048377[/C][/ROW]
[ROW][C]17[/C][C]0.224394[/C][C]1.8908[/C][C]0.031367[/C][/ROW]
[ROW][C]18[/C][C]-0.02763[/C][C]-0.2328[/C][C]0.408289[/C][/ROW]
[/TABLE]
Source: https://freestatistics.org/blog/index.php?pk=243433&T=1

Globally Unique Identifier (entire table): ba.freestatistics.org/blog/index.php?pk=243433&T=1

As an alternative you can also use a QR Code:  

The GUIDs for individual cells are displayed in the table below:

Autocorrelation Function
Time lag kACF(k)T-STATP-value
10.5155234.34392.3e-05
20.5219824.39831.9e-05
30.613985.17351e-06
40.396133.33790.000673
50.4128943.47910.000432
60.4780364.0287e-05
70.3436962.8960.00251
80.3787293.19120.001055
90.3062562.58060.005966
100.252222.12520.018523
110.2808392.36640.010347
120.2231641.88040.032077
130.2042471.7210.044801
140.273972.30850.011943
150.1734151.46120.074184
160.1997441.68310.048377
170.2243941.89080.031367
18-0.02763-0.23280.408289


Partial Autocorrelation Function
Time lag kPACF(k)T-STATP-value
10.5155234.34392.3e-05
20.3489582.94040.002211
30.4014913.3830.000585
4-0.078958-0.66530.254003
50.0075440.06360.474746
60.14321.20660.115791
70.0082320.06940.472447
80.0455510.38380.351129
9-0.132914-1.120.133255
10-0.02951-0.24870.402174
110.0357510.30120.382056
120.006950.05860.476731
13-0.003706-0.03120.487586
140.0982870.82820.205171
15-0.028644-0.24140.404987
160.0319590.26930.394244
170.0253370.21350.415777
18-0.359041-3.02530.001728

\begin{tabular}{lllllllll}
\hline
Partial Autocorrelation Function \tabularnewline
Time lag k & PACF(k) & T-STAT & P-value \tabularnewline
1 & 0.515523 & 4.3439 & 2.3e-05 \tabularnewline
2 & 0.348958 & 2.9404 & 0.002211 \tabularnewline
3 & 0.401491 & 3.383 & 0.000585 \tabularnewline
4 & -0.078958 & -0.6653 & 0.254003 \tabularnewline
5 & 0.007544 & 0.0636 & 0.474746 \tabularnewline
6 & 0.1432 & 1.2066 & 0.115791 \tabularnewline
7 & 0.008232 & 0.0694 & 0.472447 \tabularnewline
8 & 0.045551 & 0.3838 & 0.351129 \tabularnewline
9 & -0.132914 & -1.12 & 0.133255 \tabularnewline
10 & -0.02951 & -0.2487 & 0.402174 \tabularnewline
11 & 0.035751 & 0.3012 & 0.382056 \tabularnewline
12 & 0.00695 & 0.0586 & 0.476731 \tabularnewline
13 & -0.003706 & -0.0312 & 0.487586 \tabularnewline
14 & 0.098287 & 0.8282 & 0.205171 \tabularnewline
15 & -0.028644 & -0.2414 & 0.404987 \tabularnewline
16 & 0.031959 & 0.2693 & 0.394244 \tabularnewline
17 & 0.025337 & 0.2135 & 0.415777 \tabularnewline
18 & -0.359041 & -3.0253 & 0.001728 \tabularnewline
\hline
\end{tabular}
%Source: https://freestatistics.org/blog/index.php?pk=243433&T=2

[TABLE]
[ROW][C]Partial Autocorrelation Function[/C][/ROW]
[ROW][C]Time lag k[/C][C]PACF(k)[/C][C]T-STAT[/C][C]P-value[/C][/ROW]
[ROW][C]1[/C][C]0.515523[/C][C]4.3439[/C][C]2.3e-05[/C][/ROW]
[ROW][C]2[/C][C]0.348958[/C][C]2.9404[/C][C]0.002211[/C][/ROW]
[ROW][C]3[/C][C]0.401491[/C][C]3.383[/C][C]0.000585[/C][/ROW]
[ROW][C]4[/C][C]-0.078958[/C][C]-0.6653[/C][C]0.254003[/C][/ROW]
[ROW][C]5[/C][C]0.007544[/C][C]0.0636[/C][C]0.474746[/C][/ROW]
[ROW][C]6[/C][C]0.1432[/C][C]1.2066[/C][C]0.115791[/C][/ROW]
[ROW][C]7[/C][C]0.008232[/C][C]0.0694[/C][C]0.472447[/C][/ROW]
[ROW][C]8[/C][C]0.045551[/C][C]0.3838[/C][C]0.351129[/C][/ROW]
[ROW][C]9[/C][C]-0.132914[/C][C]-1.12[/C][C]0.133255[/C][/ROW]
[ROW][C]10[/C][C]-0.02951[/C][C]-0.2487[/C][C]0.402174[/C][/ROW]
[ROW][C]11[/C][C]0.035751[/C][C]0.3012[/C][C]0.382056[/C][/ROW]
[ROW][C]12[/C][C]0.00695[/C][C]0.0586[/C][C]0.476731[/C][/ROW]
[ROW][C]13[/C][C]-0.003706[/C][C]-0.0312[/C][C]0.487586[/C][/ROW]
[ROW][C]14[/C][C]0.098287[/C][C]0.8282[/C][C]0.205171[/C][/ROW]
[ROW][C]15[/C][C]-0.028644[/C][C]-0.2414[/C][C]0.404987[/C][/ROW]
[ROW][C]16[/C][C]0.031959[/C][C]0.2693[/C][C]0.394244[/C][/ROW]
[ROW][C]17[/C][C]0.025337[/C][C]0.2135[/C][C]0.415777[/C][/ROW]
[ROW][C]18[/C][C]-0.359041[/C][C]-3.0253[/C][C]0.001728[/C][/ROW]
[/TABLE]
Source: https://freestatistics.org/blog/index.php?pk=243433&T=2

Globally Unique Identifier (entire table): ba.freestatistics.org/blog/index.php?pk=243433&T=2

As an alternative you can also use a QR Code:  

The GUIDs for individual cells are displayed in the table below:

Partial Autocorrelation Function
Time lag kPACF(k)T-STATP-value
10.5155234.34392.3e-05
20.3489582.94040.002211
30.4014913.3830.000585
4-0.078958-0.66530.254003
50.0075440.06360.474746
60.14321.20660.115791
70.0082320.06940.472447
80.0455510.38380.351129
9-0.132914-1.120.133255
10-0.02951-0.24870.402174
110.0357510.30120.382056
120.006950.05860.476731
13-0.003706-0.03120.487586
140.0982870.82820.205171
15-0.028644-0.24140.404987
160.0319590.26930.394244
170.0253370.21350.415777
18-0.359041-3.02530.001728


Parameters (Session):
par1 = Default ; par2 = 1 ; par3 = 1 ; par4 = 0 ; par5 = 12 ; par6 = White Noise ; par7 = 0.95 ;
Parameters (R input):
par1 = Default ; par2 = 1 ; par3 = 1 ; par4 = 0 ; par5 = 12 ; par6 = White Noise ; par7 = 0.95 ; par8 = ;
R code (references can be found in the software module):
if (par1 == 'Default') {
par1 = 10*log10(length(x))
} else {
par1 <- as.numeric(par1)
}
par2 <- as.numeric(par2)
par3 <- as.numeric(par3)
par4 <- as.numeric(par4)
par5 <- as.numeric(par5)
if (par6 == 'White Noise') par6 <- 'white' else par6 <- 'ma'
par7 <- as.numeric(par7)
if (par8 != '') par8 <- as.numeric(par8)
ox <- x
if (par8 == '') {
if (par2 == 0) {
x <- log(x)
} else {
x <- (x ^ par2 - 1) / par2
}
} else {
x <- log(x,base=par8)
}
if (par3 > 0) x <- diff(x,lag=1,difference=par3)
if (par4 > 0) x <- diff(x,lag=par5,difference=par4)
bitmap(file='picts.png')
op <- par(mfrow=c(2,1))
plot(ox,type='l',main='Original Time Series',xlab='time',ylab='value')
if (par8=='') {
mytitle <- paste('Working Time Series (lambda=',par2,', d=',par3,', D=',par4,')',sep='')
mysub <- paste('(lambda=',par2,', d=',par3,', D=',par4,', CI=', par7, ', CI type=',par6,')',sep='')
} else {
mytitle <- paste('Working Time Series (base=',par8,', d=',par3,', D=',par4,')',sep='')
mysub <- paste('(base=',par8,', d=',par3,', D=',par4,', CI=', par7, ', CI type=',par6,')',sep='')
}
plot(x,type='l', main=mytitle,xlab='time',ylab='value')
par(op)
dev.off()
bitmap(file='pic1.png')
racf <- acf(x, par1, main='Autocorrelation', xlab='time lag', ylab='ACF', ci.type=par6, ci=par7, sub=mysub)
dev.off()
bitmap(file='pic2.png')
rpacf <- pacf(x,par1,main='Partial Autocorrelation',xlab='lags',ylab='PACF',sub=mysub)
dev.off()
(myacf <- c(racf$acf))
(mypacf <- c(rpacf$acf))
lengthx <- length(x)
sqrtn <- sqrt(lengthx)
load(file='createtable')
a<-table.start()
a<-table.row.start(a)
a<-table.element(a,'Autocorrelation Function',4,TRUE)
a<-table.row.end(a)
a<-table.row.start(a)
a<-table.element(a,'Time lag k',header=TRUE)
a<-table.element(a,hyperlink('basics.htm','ACF(k)','click here for more information about the Autocorrelation Function'),header=TRUE)
a<-table.element(a,'T-STAT',header=TRUE)
a<-table.element(a,'P-value',header=TRUE)
a<-table.row.end(a)
for (i in 2:(par1+1)) {
a<-table.row.start(a)
a<-table.element(a,i-1,header=TRUE)
a<-table.element(a,round(myacf[i],6))
mytstat <- myacf[i]*sqrtn
a<-table.element(a,round(mytstat,4))
a<-table.element(a,round(1-pt(abs(mytstat),lengthx),6))
a<-table.row.end(a)
}
a<-table.end(a)
table.save(a,file='mytable.tab')
a<-table.start()
a<-table.row.start(a)
a<-table.element(a,'Partial Autocorrelation Function',4,TRUE)
a<-table.row.end(a)
a<-table.row.start(a)
a<-table.element(a,'Time lag k',header=TRUE)
a<-table.element(a,hyperlink('basics.htm','PACF(k)','click here for more information about the Partial Autocorrelation Function'),header=TRUE)
a<-table.element(a,'T-STAT',header=TRUE)
a<-table.element(a,'P-value',header=TRUE)
a<-table.row.end(a)
for (i in 1:par1) {
a<-table.row.start(a)
a<-table.element(a,i,header=TRUE)
a<-table.element(a,round(mypacf[i],6))
mytstat <- mypacf[i]*sqrtn
a<-table.element(a,round(mytstat,4))
a<-table.element(a,round(1-pt(abs(mytstat),lengthx),6))
a<-table.row.end(a)
}
a<-table.end(a)
table.save(a,file='mytable1.tab')