Free Statistics

of Irreproducible Research!

Author's title

Author*Unverified author*
R Software Modulerwasp_autocorrelation.wasp
Title produced by software(Partial) Autocorrelation Function
Date of computationSat, 18 Oct 2014 11:34:12 +0100
Cite this page as followsStatistical Computations at FreeStatistics.org, Office for Research Development and Education, URL https://freestatistics.org/blog/index.php?v=date/2014/Oct/18/t1413628487l4pwfdfuxgydzfj.htm/, Retrieved Mon, 13 May 2024 11:23:35 +0000
Statistical Computations at FreeStatistics.org, Office for Research Development and Education, URL https://freestatistics.org/blog/index.php?pk=243430, Retrieved Mon, 13 May 2024 11:23:35 +0000
QR Codes:

Original text written by user:
IsPrivate?No (this computation is public)
User-defined keywords
Estimated Impact105
Family? (F = Feedback message, R = changed R code, M = changed R Module, P = changed Parameters, D = changed Data)
-       [(Partial) Autocorrelation Function] [] [2014-10-18 10:34:12] [72d1b0bbc256d1ec09d716526c8fc98d] [Current]
Feedback Forum

Post a new message
Dataseries X:
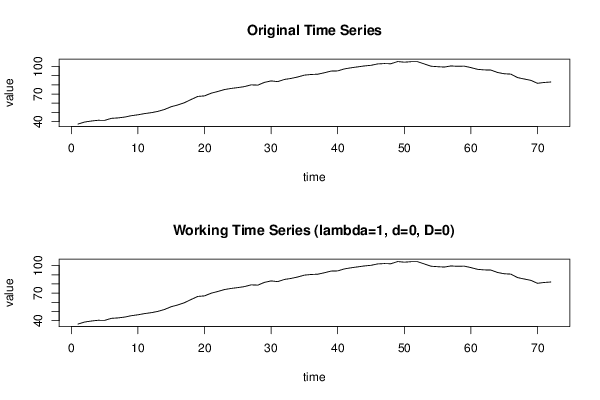
37,3
39,5
40,6
41,4
41,3
43,5
44
44,9
46,4
47,4
48,7
49,7
51,1
53,2
56,2
58,1
60,6
64,1
67,4
68
70,9
72,8
74,9
76,1
77
78,1
80
79,7
82,7
84,3
83,5
85,9
87
88,6
90,6
91,3
91,6
93,2
95
95,2
97,4
98,6
99,6
100,6
101,3
102,8
103,2
103
105,4
104,7
105,2
105,2
102,8
100,3
99,8
99,4
100,6
100,2
100,4
98,8
96,9
96,3
96,1
93,5
92,1
91,7
87,9
86,4
84,9
81,7
82,6
83,1


Summary of computational transaction
Raw Inputview raw input (R code)
Raw Outputview raw output of R engine
Computing time2 seconds
R Server'Sir Ronald Aylmer Fisher' @ fisher.wessa.net

\begin{tabular}{lllllllll}
\hline
Summary of computational transaction \tabularnewline
Raw Input & view raw input (R code)  \tabularnewline
Raw Output & view raw output of R engine  \tabularnewline
Computing time & 2 seconds \tabularnewline
R Server & 'Sir Ronald Aylmer Fisher' @ fisher.wessa.net \tabularnewline
\hline
\end{tabular}
%Source: https://freestatistics.org/blog/index.php?pk=243430&T=0

[TABLE]
[ROW][C]Summary of computational transaction[/C][/ROW]
[ROW][C]Raw Input[/C][C]view raw input (R code) [/C][/ROW]
[ROW][C]Raw Output[/C][C]view raw output of R engine [/C][/ROW]
[ROW][C]Computing time[/C][C]2 seconds[/C][/ROW]
[ROW][C]R Server[/C][C]'Sir Ronald Aylmer Fisher' @ fisher.wessa.net[/C][/ROW]
[/TABLE]
Source: https://freestatistics.org/blog/index.php?pk=243430&T=0

Globally Unique Identifier (entire table): ba.freestatistics.org/blog/index.php?pk=243430&T=0

As an alternative you can also use a QR Code:  

The GUIDs for individual cells are displayed in the table below:

Summary of computational transaction
Raw Inputview raw input (R code)
Raw Outputview raw output of R engine
Computing time2 seconds
R Server'Sir Ronald Aylmer Fisher' @ fisher.wessa.net


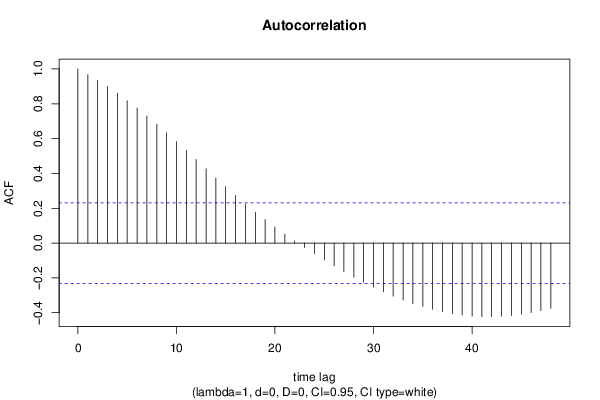
Autocorrelation Function
Time lag kACF(k)T-STATP-value
10.9674148.20880
20.9341877.92680
30.8988497.6270
40.8600747.2980
50.8179166.94020
60.7754186.57960
70.7296326.19110
80.6821225.7880
90.6334185.37470
100.583084.94762e-06
110.5320284.51441.2e-05
120.4796584.076e-05
130.426693.62060.000272
140.3742033.17520.001102
150.3232542.74290.00384
160.2728542.31520.011727
170.223881.89970.03074
180.177471.50590.068236
190.134751.14340.128332
200.0914870.77630.220058
210.050580.42920.334535
220.0117540.09970.460417
23-0.02509-0.21290.416004
24-0.061298-0.52010.302283
25-0.096645-0.82010.207445
26-0.131049-1.1120.134921
27-0.163107-1.3840.085315
28-0.196011-1.66320.050309
29-0.225199-1.91090.030001
30-0.251915-2.13760.017974
31-0.280113-2.37680.010061
32-0.304745-2.58580.005868
33-0.327328-2.77750.00349
34-0.347676-2.95010.002141
35-0.364758-3.09510.001401
36-0.37976-3.22240.000955
37-0.393959-3.34290.000659
38-0.405235-3.43850.000488
39-0.412905-3.50360.000397
40-0.419684-3.56110.00033
41-0.422548-3.58540.000305
42-0.422581-3.58570.000304
43-0.42058-3.56870.000322
44-0.416057-3.53040.000364
45-0.409253-3.47260.000438
46-0.399282-3.3880.000572
47-0.387153-3.28510.000788
48-0.374012-3.17360.001108

\begin{tabular}{lllllllll}
\hline
Autocorrelation Function \tabularnewline
Time lag k & ACF(k) & T-STAT & P-value \tabularnewline
1 & 0.967414 & 8.2088 & 0 \tabularnewline
2 & 0.934187 & 7.9268 & 0 \tabularnewline
3 & 0.898849 & 7.627 & 0 \tabularnewline
4 & 0.860074 & 7.298 & 0 \tabularnewline
5 & 0.817916 & 6.9402 & 0 \tabularnewline
6 & 0.775418 & 6.5796 & 0 \tabularnewline
7 & 0.729632 & 6.1911 & 0 \tabularnewline
8 & 0.682122 & 5.788 & 0 \tabularnewline
9 & 0.633418 & 5.3747 & 0 \tabularnewline
10 & 0.58308 & 4.9476 & 2e-06 \tabularnewline
11 & 0.532028 & 4.5144 & 1.2e-05 \tabularnewline
12 & 0.479658 & 4.07 & 6e-05 \tabularnewline
13 & 0.42669 & 3.6206 & 0.000272 \tabularnewline
14 & 0.374203 & 3.1752 & 0.001102 \tabularnewline
15 & 0.323254 & 2.7429 & 0.00384 \tabularnewline
16 & 0.272854 & 2.3152 & 0.011727 \tabularnewline
17 & 0.22388 & 1.8997 & 0.03074 \tabularnewline
18 & 0.17747 & 1.5059 & 0.068236 \tabularnewline
19 & 0.13475 & 1.1434 & 0.128332 \tabularnewline
20 & 0.091487 & 0.7763 & 0.220058 \tabularnewline
21 & 0.05058 & 0.4292 & 0.334535 \tabularnewline
22 & 0.011754 & 0.0997 & 0.460417 \tabularnewline
23 & -0.02509 & -0.2129 & 0.416004 \tabularnewline
24 & -0.061298 & -0.5201 & 0.302283 \tabularnewline
25 & -0.096645 & -0.8201 & 0.207445 \tabularnewline
26 & -0.131049 & -1.112 & 0.134921 \tabularnewline
27 & -0.163107 & -1.384 & 0.085315 \tabularnewline
28 & -0.196011 & -1.6632 & 0.050309 \tabularnewline
29 & -0.225199 & -1.9109 & 0.030001 \tabularnewline
30 & -0.251915 & -2.1376 & 0.017974 \tabularnewline
31 & -0.280113 & -2.3768 & 0.010061 \tabularnewline
32 & -0.304745 & -2.5858 & 0.005868 \tabularnewline
33 & -0.327328 & -2.7775 & 0.00349 \tabularnewline
34 & -0.347676 & -2.9501 & 0.002141 \tabularnewline
35 & -0.364758 & -3.0951 & 0.001401 \tabularnewline
36 & -0.37976 & -3.2224 & 0.000955 \tabularnewline
37 & -0.393959 & -3.3429 & 0.000659 \tabularnewline
38 & -0.405235 & -3.4385 & 0.000488 \tabularnewline
39 & -0.412905 & -3.5036 & 0.000397 \tabularnewline
40 & -0.419684 & -3.5611 & 0.00033 \tabularnewline
41 & -0.422548 & -3.5854 & 0.000305 \tabularnewline
42 & -0.422581 & -3.5857 & 0.000304 \tabularnewline
43 & -0.42058 & -3.5687 & 0.000322 \tabularnewline
44 & -0.416057 & -3.5304 & 0.000364 \tabularnewline
45 & -0.409253 & -3.4726 & 0.000438 \tabularnewline
46 & -0.399282 & -3.388 & 0.000572 \tabularnewline
47 & -0.387153 & -3.2851 & 0.000788 \tabularnewline
48 & -0.374012 & -3.1736 & 0.001108 \tabularnewline
\hline
\end{tabular}
%Source: https://freestatistics.org/blog/index.php?pk=243430&T=1

[TABLE]
[ROW][C]Autocorrelation Function[/C][/ROW]
[ROW][C]Time lag k[/C][C]ACF(k)[/C][C]T-STAT[/C][C]P-value[/C][/ROW]
[ROW][C]1[/C][C]0.967414[/C][C]8.2088[/C][C]0[/C][/ROW]
[ROW][C]2[/C][C]0.934187[/C][C]7.9268[/C][C]0[/C][/ROW]
[ROW][C]3[/C][C]0.898849[/C][C]7.627[/C][C]0[/C][/ROW]
[ROW][C]4[/C][C]0.860074[/C][C]7.298[/C][C]0[/C][/ROW]
[ROW][C]5[/C][C]0.817916[/C][C]6.9402[/C][C]0[/C][/ROW]
[ROW][C]6[/C][C]0.775418[/C][C]6.5796[/C][C]0[/C][/ROW]
[ROW][C]7[/C][C]0.729632[/C][C]6.1911[/C][C]0[/C][/ROW]
[ROW][C]8[/C][C]0.682122[/C][C]5.788[/C][C]0[/C][/ROW]
[ROW][C]9[/C][C]0.633418[/C][C]5.3747[/C][C]0[/C][/ROW]
[ROW][C]10[/C][C]0.58308[/C][C]4.9476[/C][C]2e-06[/C][/ROW]
[ROW][C]11[/C][C]0.532028[/C][C]4.5144[/C][C]1.2e-05[/C][/ROW]
[ROW][C]12[/C][C]0.479658[/C][C]4.07[/C][C]6e-05[/C][/ROW]
[ROW][C]13[/C][C]0.42669[/C][C]3.6206[/C][C]0.000272[/C][/ROW]
[ROW][C]14[/C][C]0.374203[/C][C]3.1752[/C][C]0.001102[/C][/ROW]
[ROW][C]15[/C][C]0.323254[/C][C]2.7429[/C][C]0.00384[/C][/ROW]
[ROW][C]16[/C][C]0.272854[/C][C]2.3152[/C][C]0.011727[/C][/ROW]
[ROW][C]17[/C][C]0.22388[/C][C]1.8997[/C][C]0.03074[/C][/ROW]
[ROW][C]18[/C][C]0.17747[/C][C]1.5059[/C][C]0.068236[/C][/ROW]
[ROW][C]19[/C][C]0.13475[/C][C]1.1434[/C][C]0.128332[/C][/ROW]
[ROW][C]20[/C][C]0.091487[/C][C]0.7763[/C][C]0.220058[/C][/ROW]
[ROW][C]21[/C][C]0.05058[/C][C]0.4292[/C][C]0.334535[/C][/ROW]
[ROW][C]22[/C][C]0.011754[/C][C]0.0997[/C][C]0.460417[/C][/ROW]
[ROW][C]23[/C][C]-0.02509[/C][C]-0.2129[/C][C]0.416004[/C][/ROW]
[ROW][C]24[/C][C]-0.061298[/C][C]-0.5201[/C][C]0.302283[/C][/ROW]
[ROW][C]25[/C][C]-0.096645[/C][C]-0.8201[/C][C]0.207445[/C][/ROW]
[ROW][C]26[/C][C]-0.131049[/C][C]-1.112[/C][C]0.134921[/C][/ROW]
[ROW][C]27[/C][C]-0.163107[/C][C]-1.384[/C][C]0.085315[/C][/ROW]
[ROW][C]28[/C][C]-0.196011[/C][C]-1.6632[/C][C]0.050309[/C][/ROW]
[ROW][C]29[/C][C]-0.225199[/C][C]-1.9109[/C][C]0.030001[/C][/ROW]
[ROW][C]30[/C][C]-0.251915[/C][C]-2.1376[/C][C]0.017974[/C][/ROW]
[ROW][C]31[/C][C]-0.280113[/C][C]-2.3768[/C][C]0.010061[/C][/ROW]
[ROW][C]32[/C][C]-0.304745[/C][C]-2.5858[/C][C]0.005868[/C][/ROW]
[ROW][C]33[/C][C]-0.327328[/C][C]-2.7775[/C][C]0.00349[/C][/ROW]
[ROW][C]34[/C][C]-0.347676[/C][C]-2.9501[/C][C]0.002141[/C][/ROW]
[ROW][C]35[/C][C]-0.364758[/C][C]-3.0951[/C][C]0.001401[/C][/ROW]
[ROW][C]36[/C][C]-0.37976[/C][C]-3.2224[/C][C]0.000955[/C][/ROW]
[ROW][C]37[/C][C]-0.393959[/C][C]-3.3429[/C][C]0.000659[/C][/ROW]
[ROW][C]38[/C][C]-0.405235[/C][C]-3.4385[/C][C]0.000488[/C][/ROW]
[ROW][C]39[/C][C]-0.412905[/C][C]-3.5036[/C][C]0.000397[/C][/ROW]
[ROW][C]40[/C][C]-0.419684[/C][C]-3.5611[/C][C]0.00033[/C][/ROW]
[ROW][C]41[/C][C]-0.422548[/C][C]-3.5854[/C][C]0.000305[/C][/ROW]
[ROW][C]42[/C][C]-0.422581[/C][C]-3.5857[/C][C]0.000304[/C][/ROW]
[ROW][C]43[/C][C]-0.42058[/C][C]-3.5687[/C][C]0.000322[/C][/ROW]
[ROW][C]44[/C][C]-0.416057[/C][C]-3.5304[/C][C]0.000364[/C][/ROW]
[ROW][C]45[/C][C]-0.409253[/C][C]-3.4726[/C][C]0.000438[/C][/ROW]
[ROW][C]46[/C][C]-0.399282[/C][C]-3.388[/C][C]0.000572[/C][/ROW]
[ROW][C]47[/C][C]-0.387153[/C][C]-3.2851[/C][C]0.000788[/C][/ROW]
[ROW][C]48[/C][C]-0.374012[/C][C]-3.1736[/C][C]0.001108[/C][/ROW]
[/TABLE]
Source: https://freestatistics.org/blog/index.php?pk=243430&T=1

Globally Unique Identifier (entire table): ba.freestatistics.org/blog/index.php?pk=243430&T=1

As an alternative you can also use a QR Code:  

The GUIDs for individual cells are displayed in the table below:

Autocorrelation Function
Time lag kACF(k)T-STATP-value
10.9674148.20880
20.9341877.92680
30.8988497.6270
40.8600747.2980
50.8179166.94020
60.7754186.57960
70.7296326.19110
80.6821225.7880
90.6334185.37470
100.583084.94762e-06
110.5320284.51441.2e-05
120.4796584.076e-05
130.426693.62060.000272
140.3742033.17520.001102
150.3232542.74290.00384
160.2728542.31520.011727
170.223881.89970.03074
180.177471.50590.068236
190.134751.14340.128332
200.0914870.77630.220058
210.050580.42920.334535
220.0117540.09970.460417
23-0.02509-0.21290.416004
24-0.061298-0.52010.302283
25-0.096645-0.82010.207445
26-0.131049-1.1120.134921
27-0.163107-1.3840.085315
28-0.196011-1.66320.050309
29-0.225199-1.91090.030001
30-0.251915-2.13760.017974
31-0.280113-2.37680.010061
32-0.304745-2.58580.005868
33-0.327328-2.77750.00349
34-0.347676-2.95010.002141
35-0.364758-3.09510.001401
36-0.37976-3.22240.000955
37-0.393959-3.34290.000659
38-0.405235-3.43850.000488
39-0.412905-3.50360.000397
40-0.419684-3.56110.00033
41-0.422548-3.58540.000305
42-0.422581-3.58570.000304
43-0.42058-3.56870.000322
44-0.416057-3.53040.000364
45-0.409253-3.47260.000438
46-0.399282-3.3880.000572
47-0.387153-3.28510.000788
48-0.374012-3.17360.001108


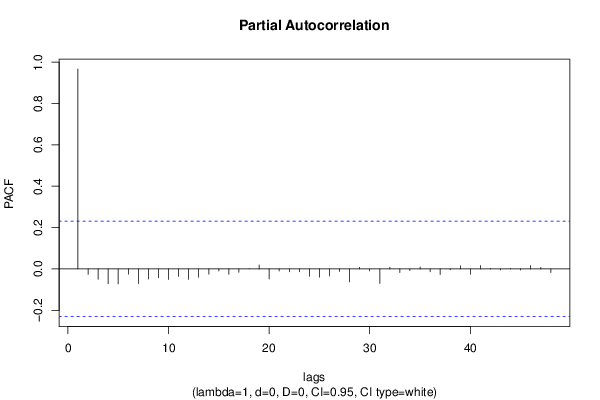
Partial Autocorrelation Function
Time lag kPACF(k)T-STATP-value
10.9674148.20880
2-0.026567-0.22540.411143
3-0.050037-0.42460.336204
4-0.071823-0.60940.272077
5-0.072356-0.6140.270587
6-0.025185-0.21370.415693
7-0.070497-0.59820.275796
8-0.048833-0.41440.339921
9-0.04257-0.36120.359496
10-0.050611-0.42940.33444
11-0.036646-0.3110.378368
12-0.050624-0.42960.3344
13-0.040337-0.34230.366574
14-0.025142-0.21330.415834
15-0.010037-0.08520.466182
16-0.025617-0.21740.414269
17-0.016466-0.13970.444635
180.0004760.0040.498396
190.0188330.15980.436743
20-0.049101-0.41660.339093
21-0.010205-0.08660.465617
22-0.0139-0.11790.453221
23-0.013955-0.11840.453034
24-0.035553-0.30170.381884
25-0.03972-0.3370.368537
26-0.034456-0.29240.385423
27-0.012735-0.10810.457125
28-0.062739-0.53240.298059
290.0076520.06490.474205
30-0.009723-0.08250.467238
31-0.07023-0.59590.276548
320.0082370.06990.472235
33-0.01757-0.14910.44095
34-0.00754-0.0640.474581
350.0088760.07530.470087
36-0.014077-0.11940.452627
37-0.027467-0.23310.408184
38-0.004154-0.03520.48599
390.0155290.13180.447767
40-0.026003-0.22060.412998
410.0165820.14070.444248
420.0015460.01310.494786
43-0.004916-0.04170.483422
440.0013850.01180.495329
45-0.005205-0.04420.482449
460.0161470.1370.445703
470.0070880.06010.476103
48-0.017278-0.14660.441924

\begin{tabular}{lllllllll}
\hline
Partial Autocorrelation Function \tabularnewline
Time lag k & PACF(k) & T-STAT & P-value \tabularnewline
1 & 0.967414 & 8.2088 & 0 \tabularnewline
2 & -0.026567 & -0.2254 & 0.411143 \tabularnewline
3 & -0.050037 & -0.4246 & 0.336204 \tabularnewline
4 & -0.071823 & -0.6094 & 0.272077 \tabularnewline
5 & -0.072356 & -0.614 & 0.270587 \tabularnewline
6 & -0.025185 & -0.2137 & 0.415693 \tabularnewline
7 & -0.070497 & -0.5982 & 0.275796 \tabularnewline
8 & -0.048833 & -0.4144 & 0.339921 \tabularnewline
9 & -0.04257 & -0.3612 & 0.359496 \tabularnewline
10 & -0.050611 & -0.4294 & 0.33444 \tabularnewline
11 & -0.036646 & -0.311 & 0.378368 \tabularnewline
12 & -0.050624 & -0.4296 & 0.3344 \tabularnewline
13 & -0.040337 & -0.3423 & 0.366574 \tabularnewline
14 & -0.025142 & -0.2133 & 0.415834 \tabularnewline
15 & -0.010037 & -0.0852 & 0.466182 \tabularnewline
16 & -0.025617 & -0.2174 & 0.414269 \tabularnewline
17 & -0.016466 & -0.1397 & 0.444635 \tabularnewline
18 & 0.000476 & 0.004 & 0.498396 \tabularnewline
19 & 0.018833 & 0.1598 & 0.436743 \tabularnewline
20 & -0.049101 & -0.4166 & 0.339093 \tabularnewline
21 & -0.010205 & -0.0866 & 0.465617 \tabularnewline
22 & -0.0139 & -0.1179 & 0.453221 \tabularnewline
23 & -0.013955 & -0.1184 & 0.453034 \tabularnewline
24 & -0.035553 & -0.3017 & 0.381884 \tabularnewline
25 & -0.03972 & -0.337 & 0.368537 \tabularnewline
26 & -0.034456 & -0.2924 & 0.385423 \tabularnewline
27 & -0.012735 & -0.1081 & 0.457125 \tabularnewline
28 & -0.062739 & -0.5324 & 0.298059 \tabularnewline
29 & 0.007652 & 0.0649 & 0.474205 \tabularnewline
30 & -0.009723 & -0.0825 & 0.467238 \tabularnewline
31 & -0.07023 & -0.5959 & 0.276548 \tabularnewline
32 & 0.008237 & 0.0699 & 0.472235 \tabularnewline
33 & -0.01757 & -0.1491 & 0.44095 \tabularnewline
34 & -0.00754 & -0.064 & 0.474581 \tabularnewline
35 & 0.008876 & 0.0753 & 0.470087 \tabularnewline
36 & -0.014077 & -0.1194 & 0.452627 \tabularnewline
37 & -0.027467 & -0.2331 & 0.408184 \tabularnewline
38 & -0.004154 & -0.0352 & 0.48599 \tabularnewline
39 & 0.015529 & 0.1318 & 0.447767 \tabularnewline
40 & -0.026003 & -0.2206 & 0.412998 \tabularnewline
41 & 0.016582 & 0.1407 & 0.444248 \tabularnewline
42 & 0.001546 & 0.0131 & 0.494786 \tabularnewline
43 & -0.004916 & -0.0417 & 0.483422 \tabularnewline
44 & 0.001385 & 0.0118 & 0.495329 \tabularnewline
45 & -0.005205 & -0.0442 & 0.482449 \tabularnewline
46 & 0.016147 & 0.137 & 0.445703 \tabularnewline
47 & 0.007088 & 0.0601 & 0.476103 \tabularnewline
48 & -0.017278 & -0.1466 & 0.441924 \tabularnewline
\hline
\end{tabular}
%Source: https://freestatistics.org/blog/index.php?pk=243430&T=2

[TABLE]
[ROW][C]Partial Autocorrelation Function[/C][/ROW]
[ROW][C]Time lag k[/C][C]PACF(k)[/C][C]T-STAT[/C][C]P-value[/C][/ROW]
[ROW][C]1[/C][C]0.967414[/C][C]8.2088[/C][C]0[/C][/ROW]
[ROW][C]2[/C][C]-0.026567[/C][C]-0.2254[/C][C]0.411143[/C][/ROW]
[ROW][C]3[/C][C]-0.050037[/C][C]-0.4246[/C][C]0.336204[/C][/ROW]
[ROW][C]4[/C][C]-0.071823[/C][C]-0.6094[/C][C]0.272077[/C][/ROW]
[ROW][C]5[/C][C]-0.072356[/C][C]-0.614[/C][C]0.270587[/C][/ROW]
[ROW][C]6[/C][C]-0.025185[/C][C]-0.2137[/C][C]0.415693[/C][/ROW]
[ROW][C]7[/C][C]-0.070497[/C][C]-0.5982[/C][C]0.275796[/C][/ROW]
[ROW][C]8[/C][C]-0.048833[/C][C]-0.4144[/C][C]0.339921[/C][/ROW]
[ROW][C]9[/C][C]-0.04257[/C][C]-0.3612[/C][C]0.359496[/C][/ROW]
[ROW][C]10[/C][C]-0.050611[/C][C]-0.4294[/C][C]0.33444[/C][/ROW]
[ROW][C]11[/C][C]-0.036646[/C][C]-0.311[/C][C]0.378368[/C][/ROW]
[ROW][C]12[/C][C]-0.050624[/C][C]-0.4296[/C][C]0.3344[/C][/ROW]
[ROW][C]13[/C][C]-0.040337[/C][C]-0.3423[/C][C]0.366574[/C][/ROW]
[ROW][C]14[/C][C]-0.025142[/C][C]-0.2133[/C][C]0.415834[/C][/ROW]
[ROW][C]15[/C][C]-0.010037[/C][C]-0.0852[/C][C]0.466182[/C][/ROW]
[ROW][C]16[/C][C]-0.025617[/C][C]-0.2174[/C][C]0.414269[/C][/ROW]
[ROW][C]17[/C][C]-0.016466[/C][C]-0.1397[/C][C]0.444635[/C][/ROW]
[ROW][C]18[/C][C]0.000476[/C][C]0.004[/C][C]0.498396[/C][/ROW]
[ROW][C]19[/C][C]0.018833[/C][C]0.1598[/C][C]0.436743[/C][/ROW]
[ROW][C]20[/C][C]-0.049101[/C][C]-0.4166[/C][C]0.339093[/C][/ROW]
[ROW][C]21[/C][C]-0.010205[/C][C]-0.0866[/C][C]0.465617[/C][/ROW]
[ROW][C]22[/C][C]-0.0139[/C][C]-0.1179[/C][C]0.453221[/C][/ROW]
[ROW][C]23[/C][C]-0.013955[/C][C]-0.1184[/C][C]0.453034[/C][/ROW]
[ROW][C]24[/C][C]-0.035553[/C][C]-0.3017[/C][C]0.381884[/C][/ROW]
[ROW][C]25[/C][C]-0.03972[/C][C]-0.337[/C][C]0.368537[/C][/ROW]
[ROW][C]26[/C][C]-0.034456[/C][C]-0.2924[/C][C]0.385423[/C][/ROW]
[ROW][C]27[/C][C]-0.012735[/C][C]-0.1081[/C][C]0.457125[/C][/ROW]
[ROW][C]28[/C][C]-0.062739[/C][C]-0.5324[/C][C]0.298059[/C][/ROW]
[ROW][C]29[/C][C]0.007652[/C][C]0.0649[/C][C]0.474205[/C][/ROW]
[ROW][C]30[/C][C]-0.009723[/C][C]-0.0825[/C][C]0.467238[/C][/ROW]
[ROW][C]31[/C][C]-0.07023[/C][C]-0.5959[/C][C]0.276548[/C][/ROW]
[ROW][C]32[/C][C]0.008237[/C][C]0.0699[/C][C]0.472235[/C][/ROW]
[ROW][C]33[/C][C]-0.01757[/C][C]-0.1491[/C][C]0.44095[/C][/ROW]
[ROW][C]34[/C][C]-0.00754[/C][C]-0.064[/C][C]0.474581[/C][/ROW]
[ROW][C]35[/C][C]0.008876[/C][C]0.0753[/C][C]0.470087[/C][/ROW]
[ROW][C]36[/C][C]-0.014077[/C][C]-0.1194[/C][C]0.452627[/C][/ROW]
[ROW][C]37[/C][C]-0.027467[/C][C]-0.2331[/C][C]0.408184[/C][/ROW]
[ROW][C]38[/C][C]-0.004154[/C][C]-0.0352[/C][C]0.48599[/C][/ROW]
[ROW][C]39[/C][C]0.015529[/C][C]0.1318[/C][C]0.447767[/C][/ROW]
[ROW][C]40[/C][C]-0.026003[/C][C]-0.2206[/C][C]0.412998[/C][/ROW]
[ROW][C]41[/C][C]0.016582[/C][C]0.1407[/C][C]0.444248[/C][/ROW]
[ROW][C]42[/C][C]0.001546[/C][C]0.0131[/C][C]0.494786[/C][/ROW]
[ROW][C]43[/C][C]-0.004916[/C][C]-0.0417[/C][C]0.483422[/C][/ROW]
[ROW][C]44[/C][C]0.001385[/C][C]0.0118[/C][C]0.495329[/C][/ROW]
[ROW][C]45[/C][C]-0.005205[/C][C]-0.0442[/C][C]0.482449[/C][/ROW]
[ROW][C]46[/C][C]0.016147[/C][C]0.137[/C][C]0.445703[/C][/ROW]
[ROW][C]47[/C][C]0.007088[/C][C]0.0601[/C][C]0.476103[/C][/ROW]
[ROW][C]48[/C][C]-0.017278[/C][C]-0.1466[/C][C]0.441924[/C][/ROW]
[/TABLE]
Source: https://freestatistics.org/blog/index.php?pk=243430&T=2

Globally Unique Identifier (entire table): ba.freestatistics.org/blog/index.php?pk=243430&T=2

As an alternative you can also use a QR Code:  

The GUIDs for individual cells are displayed in the table below:

Partial Autocorrelation Function
Time lag kPACF(k)T-STATP-value
10.9674148.20880
2-0.026567-0.22540.411143
3-0.050037-0.42460.336204
4-0.071823-0.60940.272077
5-0.072356-0.6140.270587
6-0.025185-0.21370.415693
7-0.070497-0.59820.275796
8-0.048833-0.41440.339921
9-0.04257-0.36120.359496
10-0.050611-0.42940.33444
11-0.036646-0.3110.378368
12-0.050624-0.42960.3344
13-0.040337-0.34230.366574
14-0.025142-0.21330.415834
15-0.010037-0.08520.466182
16-0.025617-0.21740.414269
17-0.016466-0.13970.444635
180.0004760.0040.498396
190.0188330.15980.436743
20-0.049101-0.41660.339093
21-0.010205-0.08660.465617
22-0.0139-0.11790.453221
23-0.013955-0.11840.453034
24-0.035553-0.30170.381884
25-0.03972-0.3370.368537
26-0.034456-0.29240.385423
27-0.012735-0.10810.457125
28-0.062739-0.53240.298059
290.0076520.06490.474205
30-0.009723-0.08250.467238
31-0.07023-0.59590.276548
320.0082370.06990.472235
33-0.01757-0.14910.44095
34-0.00754-0.0640.474581
350.0088760.07530.470087
36-0.014077-0.11940.452627
37-0.027467-0.23310.408184
38-0.004154-0.03520.48599
390.0155290.13180.447767
40-0.026003-0.22060.412998
410.0165820.14070.444248
420.0015460.01310.494786
43-0.004916-0.04170.483422
440.0013850.01180.495329
45-0.005205-0.04420.482449
460.0161470.1370.445703
470.0070880.06010.476103
48-0.017278-0.14660.441924


Parameters (Session):
par1 = 48 ; par2 = 1 ; par3 = 0 ; par4 = 0 ; par5 = 12 ; par6 = White Noise ; par7 = 0.95 ;
Parameters (R input):
par1 = 48 ; par2 = 1 ; par3 = 0 ; par4 = 0 ; par5 = 12 ; par6 = White Noise ; par7 = 0.95 ; par8 = ;
R code (references can be found in the software module):
if (par1 == 'Default') {
par1 = 10*log10(length(x))
} else {
par1 <- as.numeric(par1)
}
par2 <- as.numeric(par2)
par3 <- as.numeric(par3)
par4 <- as.numeric(par4)
par5 <- as.numeric(par5)
if (par6 == 'White Noise') par6 <- 'white' else par6 <- 'ma'
par7 <- as.numeric(par7)
if (par8 != '') par8 <- as.numeric(par8)
ox <- x
if (par8 == '') {
if (par2 == 0) {
x <- log(x)
} else {
x <- (x ^ par2 - 1) / par2
}
} else {
x <- log(x,base=par8)
}
if (par3 > 0) x <- diff(x,lag=1,difference=par3)
if (par4 > 0) x <- diff(x,lag=par5,difference=par4)
bitmap(file='picts.png')
op <- par(mfrow=c(2,1))
plot(ox,type='l',main='Original Time Series',xlab='time',ylab='value')
if (par8=='') {
mytitle <- paste('Working Time Series (lambda=',par2,', d=',par3,', D=',par4,')',sep='')
mysub <- paste('(lambda=',par2,', d=',par3,', D=',par4,', CI=', par7, ', CI type=',par6,')',sep='')
} else {
mytitle <- paste('Working Time Series (base=',par8,', d=',par3,', D=',par4,')',sep='')
mysub <- paste('(base=',par8,', d=',par3,', D=',par4,', CI=', par7, ', CI type=',par6,')',sep='')
}
plot(x,type='l', main=mytitle,xlab='time',ylab='value')
par(op)
dev.off()
bitmap(file='pic1.png')
racf <- acf(x, par1, main='Autocorrelation', xlab='time lag', ylab='ACF', ci.type=par6, ci=par7, sub=mysub)
dev.off()
bitmap(file='pic2.png')
rpacf <- pacf(x,par1,main='Partial Autocorrelation',xlab='lags',ylab='PACF',sub=mysub)
dev.off()
(myacf <- c(racf$acf))
(mypacf <- c(rpacf$acf))
lengthx <- length(x)
sqrtn <- sqrt(lengthx)
load(file='createtable')
a<-table.start()
a<-table.row.start(a)
a<-table.element(a,'Autocorrelation Function',4,TRUE)
a<-table.row.end(a)
a<-table.row.start(a)
a<-table.element(a,'Time lag k',header=TRUE)
a<-table.element(a,hyperlink('basics.htm','ACF(k)','click here for more information about the Autocorrelation Function'),header=TRUE)
a<-table.element(a,'T-STAT',header=TRUE)
a<-table.element(a,'P-value',header=TRUE)
a<-table.row.end(a)
for (i in 2:(par1+1)) {
a<-table.row.start(a)
a<-table.element(a,i-1,header=TRUE)
a<-table.element(a,round(myacf[i],6))
mytstat <- myacf[i]*sqrtn
a<-table.element(a,round(mytstat,4))
a<-table.element(a,round(1-pt(abs(mytstat),lengthx),6))
a<-table.row.end(a)
}
a<-table.end(a)
table.save(a,file='mytable.tab')
a<-table.start()
a<-table.row.start(a)
a<-table.element(a,'Partial Autocorrelation Function',4,TRUE)
a<-table.row.end(a)
a<-table.row.start(a)
a<-table.element(a,'Time lag k',header=TRUE)
a<-table.element(a,hyperlink('basics.htm','PACF(k)','click here for more information about the Partial Autocorrelation Function'),header=TRUE)
a<-table.element(a,'T-STAT',header=TRUE)
a<-table.element(a,'P-value',header=TRUE)
a<-table.row.end(a)
for (i in 1:par1) {
a<-table.row.start(a)
a<-table.element(a,i,header=TRUE)
a<-table.element(a,round(mypacf[i],6))
mytstat <- mypacf[i]*sqrtn
a<-table.element(a,round(mytstat,4))
a<-table.element(a,round(1-pt(abs(mytstat),lengthx),6))
a<-table.row.end(a)
}
a<-table.end(a)
table.save(a,file='mytable1.tab')